

Inflation Through the Lense of Inflation Bet_Noire/iStock via Getty Images
In this article, I look at how different segments of the yield curve behave prior to recessions and the likely direction of the curve as the Federal Reserve raises short-term interest rates while reducing bond purchases (quantitative tightening) with high inflation and rising geopolitical risk. An article on Bloomberg, Powell Says Look at Short-Term Treasury Yield Curve for Recession Risk, caught my attention when Federal Reserve Jerome Powell explained:
Frankly, there’s good research by staff in the Federal Reserve system that really says to look at the short — the first 18 months — of the yield curve… That’s really what has 100% of the explanatory power of the yield curve. It make sense. Because if it’s inverted, that means the Fed’s going to cut, which means the economy is weak.
Joseph Calhoun elaborates on the importance of the short end of the yield curve in Weekly Market Pulse: What Now? and that the current yield curve inversion is more comparable to the 1978 inversion.
So, yes, parts of the yield curve are inverted but the short end of the curve remains fairly steep. That is an unusual situation with no recent comparable periods (back to the 1978 inversion). Typically, 10/2 inversions occur when the entire curve is flat with maturities shorter than 2 years going on to invert later at varying frequencies. So what does the current shape of the curve mean? …One thing is sure; as the nature of the economy reveals itself over the coming months, the yield curve will continue to change – at the market’s pace, not the Fed’s.
Wikipedia describes some similarities and differences between 1978 and the current environment. First, 1978 was a period of “stagflation” with unemployment near 8% and high inflation near 10%. By contrast, unemployment is at a very low 3.6% with inflation at 7.9%.
The NBER considers a very short recession to have occurred in 1980, followed by a short period of growth and then a deep recession. Unemployment remained relatively elevated in between recessions. The recession began as the Federal Reserve, under Paul Volcker, raised interest rates dramatically to fight the inflation of the 1970s…
Other major differences are the recovery from the COVID-induced recession along with massive stimulus and additional supply shocks from Russia’s invasion of Ukraine. The following figure shows the relationship of the yield on 10-year treasuries (blue line), inflation (red line) as measured by the personal consumptions price index, Federal Funds rate (green line), and the 10 to 2-year yield curve (purple line). Rising federal funds rates have been effective in dampening inflation other than 1975 to 1980 when inflation was extreme. Recently, the Federal Reserve has been letting inflation run a “little” hotter than usual. It is significant that the 10/2-year yield curve approaches zero for long periods of time prior to a recession, and a brief dip below zero does not necessarily signal a recession.
Inflation, Fed Funds Rate, 10-Year Treasury, and 10 to 2-Year Yield Curve (St. Louis Federal Reserve)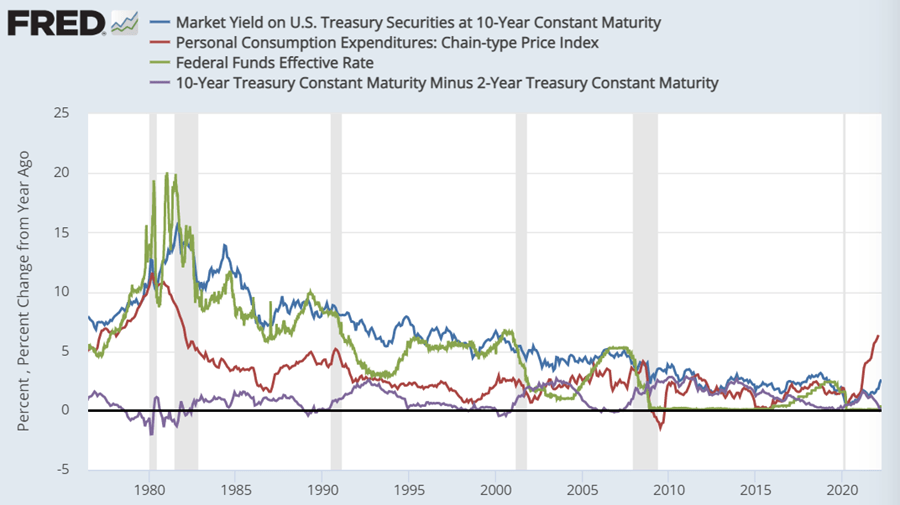
The next figure shows the 10-year to 2-year segment of the yield curve and the 10-year to 3-month segment. They typically move in the same direction but have diverged during the past one to two years. The Federal Reserve has only begun to raise rates to contain inflation as the market sets the pace.
Ten Year Treasury to Two-Year and Three-Month (St. Louis Federal Reserve)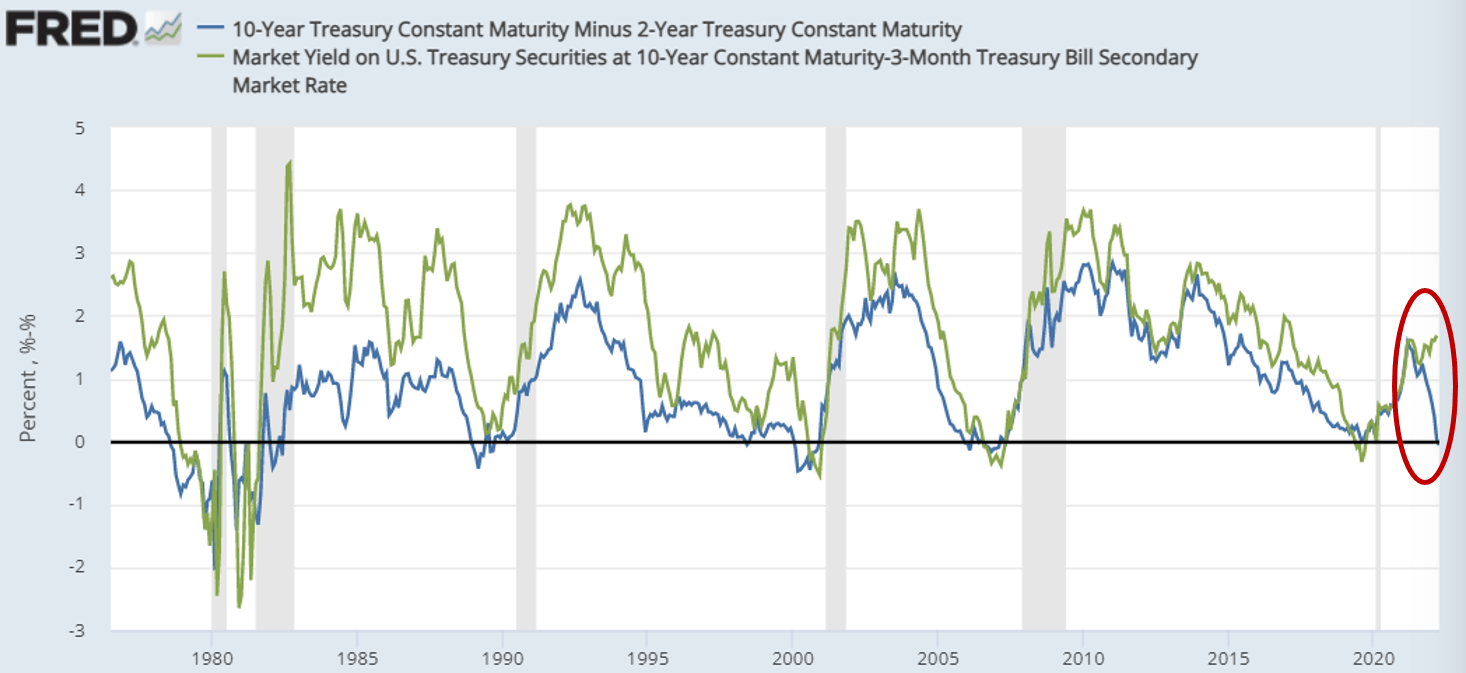
The next figure shows the yield curves from 1979 to 2022. (Prior to 2006, I used the secondary market due to the availability of data). First, the current three-month to two-year segment of the yield curve is steep, as Mr. Calhoun and Mr. Powell point out. Second, the entire yield curve is lower prior to the quantitative easing applied after the Great Financial Crisis.
Inverted Yield Curves from 1978 to 2022 (Created by the Author Using the St. Louis Federal Reserve)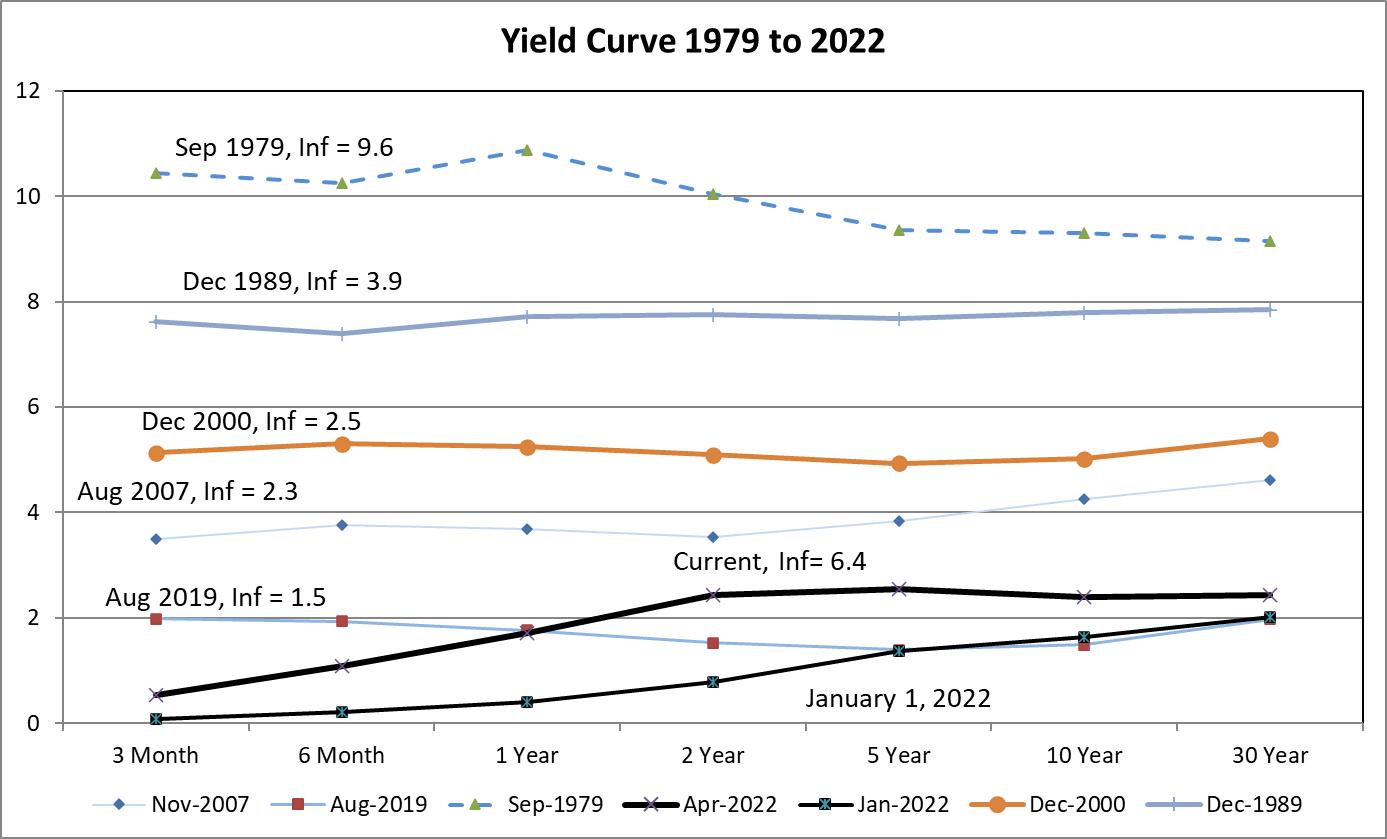
Doug Noland provides an excellent condensed and thorough summary of economic and financial news on Seeking Alpha in his Weekly Commentary. He says that “Rate markets are now pricing in a 2.54% Fed funds rate by the FOMC’s December 14th meeting.” The Federal Reserve will also begin shrinking the balance sheet as soon as May.
I use an indicator of the percent of the yield curve segments below the three-month treasury rate plus the ten-year to two-year segment in my Investment Model which is shown below compared to recession probabilities. It is not signaling a recession. The inverted yield curve in 1995 was not followed by a recession because the Federal Reserve managed a “soft landing”.
Investment Model Yield Curve Indicator (Created by the Author)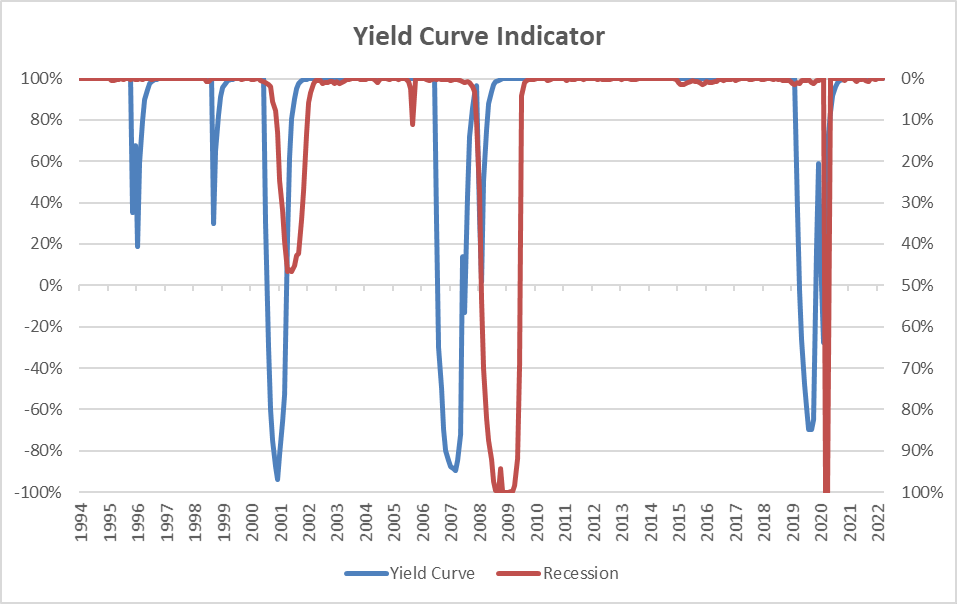
Another indicator that I use is “Interest” based on bond returns and spreads, ten-year minus two-year treasury spread, and changes in the prime and credit card rates. It is signaling more caution is warranted.
Investment Model Interest Rate Indicator (Created By the Author)
Running a “Little” Hot
The economy is strong but starting to slow with inventories at low levels. Doug Noland cites Mark Burton and Jack Farchy on Bloomberg:
The available stockpiles across the six main contracts on the London Metal Exchange have plunged to the lowest on record in data going back to 1997.
In the following figure, I show private inventories divided by GDP along with Capacity Utilization. Indeed, inventories are low due to just in time deliveries and are more susceptible to supply shocks. Supply chains will have to adjust as sources of raw materials become more aligned with national security. Capacity Utilization has been declining as we have become more service oriented, but production is near capacity and increasing production will likely be accompanied with higher inflation.
Capacity Utilization and Inventories/GDP (St. Louis Federal Reserve)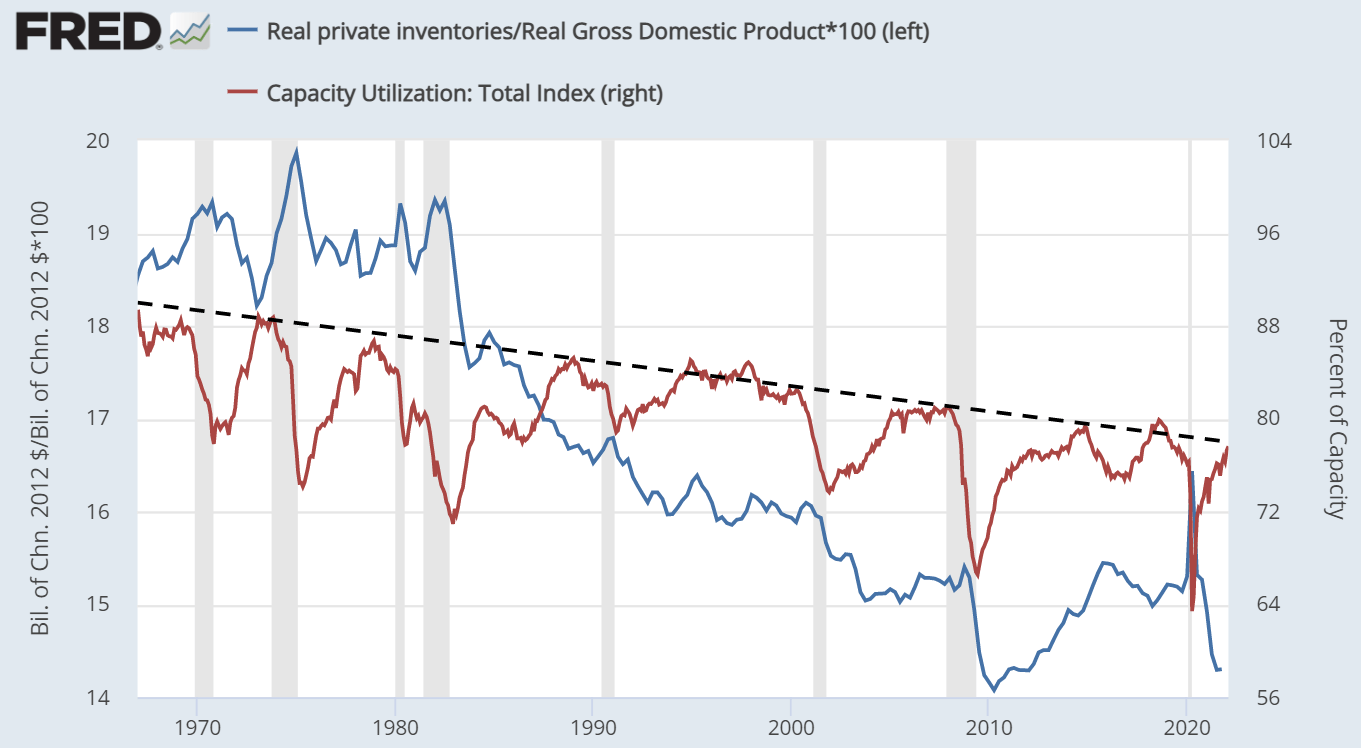
David Roche, President of Independent Strategy, describes in a CNBC article the impact of war on supply chains, inflation and adds production:
This [Russian Invasion of Ukraine] is an enormous supply-side shock that will continue in food, in energy, in metals and I can go on. That will go on while at the same time, we’re dealing with inflation worldwide, we’re dealing with rising interest rates – I think the 30-year [Treasury yield] will be at least 3.5% in a year’s time – and we’re looking at, of course, supply disruptions in China due to what is happening on Covid, which people are not talking about, but which are obviously another supply side to the global system…
In a normal recession, output and demand go down, inflation goes down. In this sort of a recession, a ‘war-cession,’ you actually have output which falls at the same time as costs and inflation rise…
The Production Gap, shown below, is the difference between Real Potential GDP and Real GDP. It represents the gap between real GDP and the U.S. Congressional Budget Office’s estimate of “the output the economy would produce with a high rate of use of its capital and labor resources.” There is little slack in the economy to expand without inflation rising.
Real GDP Gap (St. Louis Federal Reserve FRED)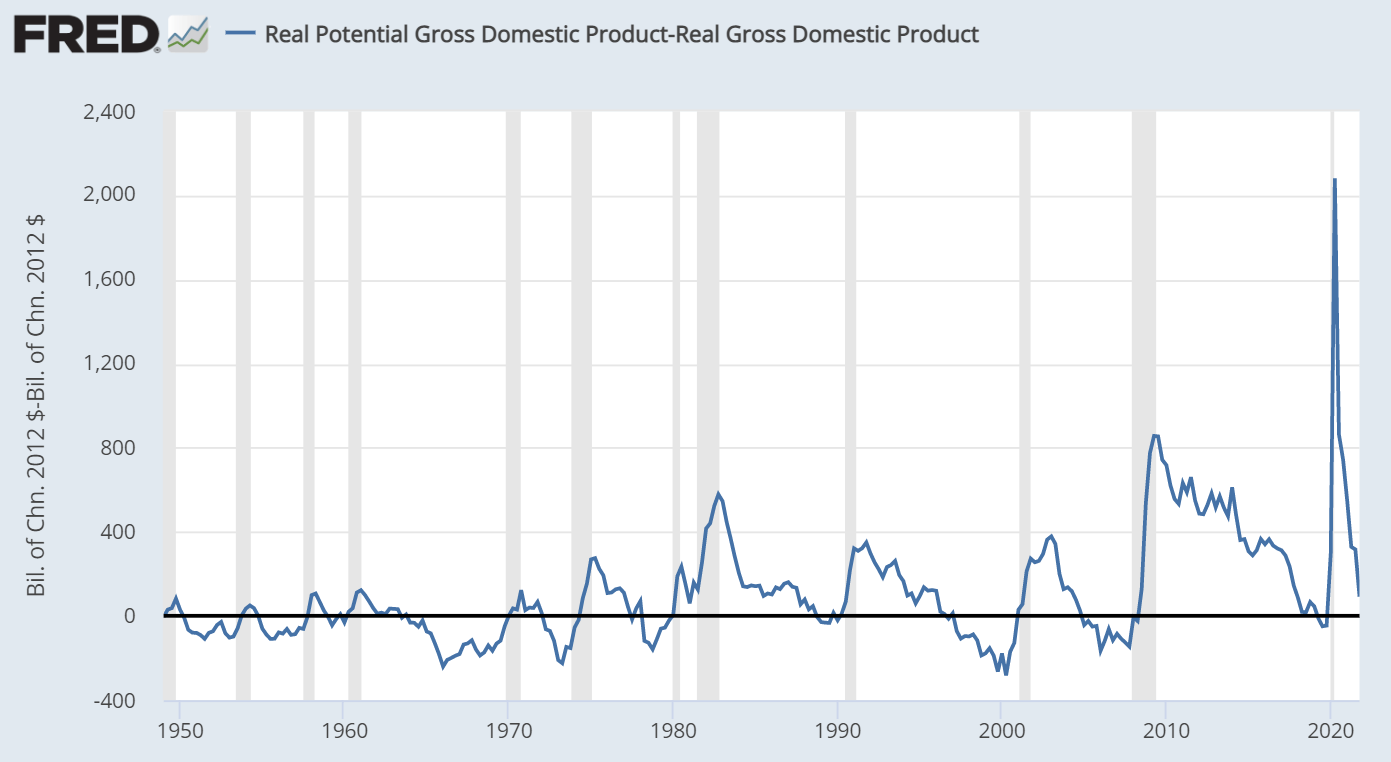
The velocity of money (blue line) is basically the rate at which money changes hands. High inflation is often described as there is “too much money chasing too few goods.” Quantitative easing occurred through the Federal Reserve purchasing bonds or increasing Total Assets (red line) to increase the money supply. The velocity of money has stopped declining as inflation is increasing, leading to monetary tightening or reducing the balance sheet.
Velocity of Money and Federal Reserve Total Assets (St. Louis Federal Reserve)
Global Inflation
The consumer price index (green line) is nearly 7.5% year-over-year. The 5-year breakeven inflation rate (blue line) estimates that inflation will average 2.4% over the next five years. However, the University of Michigan Survey of Inflation Expectations (red line) estimates prices to increase 4.9% over the next 12 months.
Inflation and Inflation Expectations (St. Louis Federal Reserve)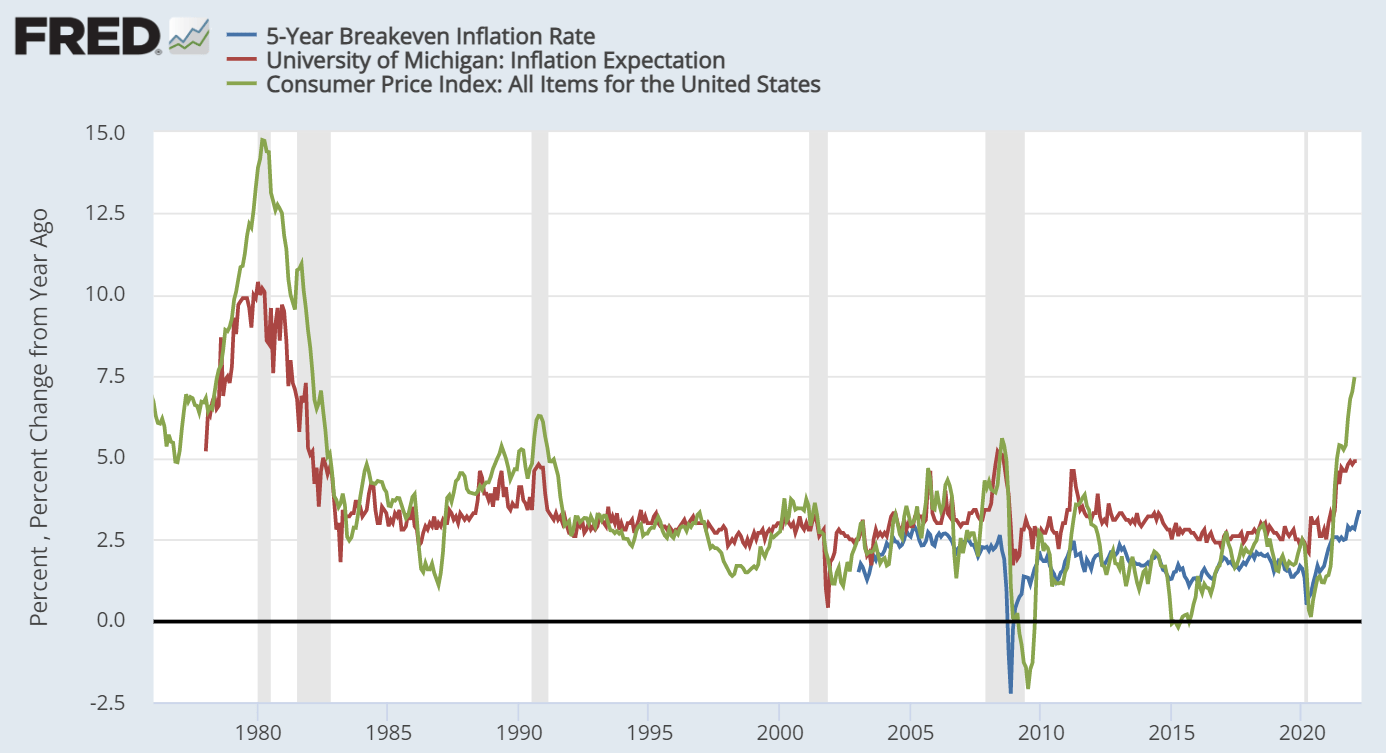
I use the St. Louis Federal Reserve Price Pressures to estimate the probability of inflation above 2.5% to create an inflation indicator. The impact is currently very negative, and stock valuations typically compress during periods of high inflation.
Price Change Probability/Inflation Probability Indicator (Created by the Author Using the St. Louis Federal Reserve FRED)
I adapted Robert Dieli’s Mr. Model based on the “Aggregate Spread” using long-term treasuries, Federal Funds rate, inflation rate, and unemployment rate. Jeff Miller described the accuracy of Robert Dieli’s Mr. Model to forecast recessions in Business Cycle Forecasting: The Superlative Results Of Robert F. Dieli. I have adapted this concept which is currently cautioning of a possible recession.
Author’s Adaptation of Bob Dieli’s Mr. Model (Created by the Author)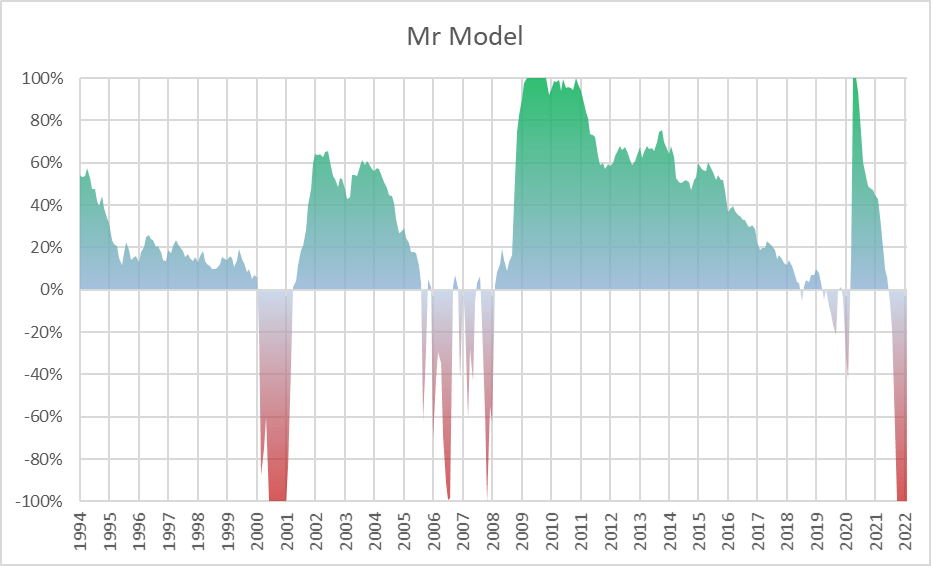
I built a Recession Probability Indicator (green line) to give a more advanced warning of a pending recession based on the percent of recession-sensitive indicators that I track that are negative. The economy is strong but slowing with only a 13% probability of recession.
Recession Probability (Created by the Author Using the St. Louis Federal Reserve FRED)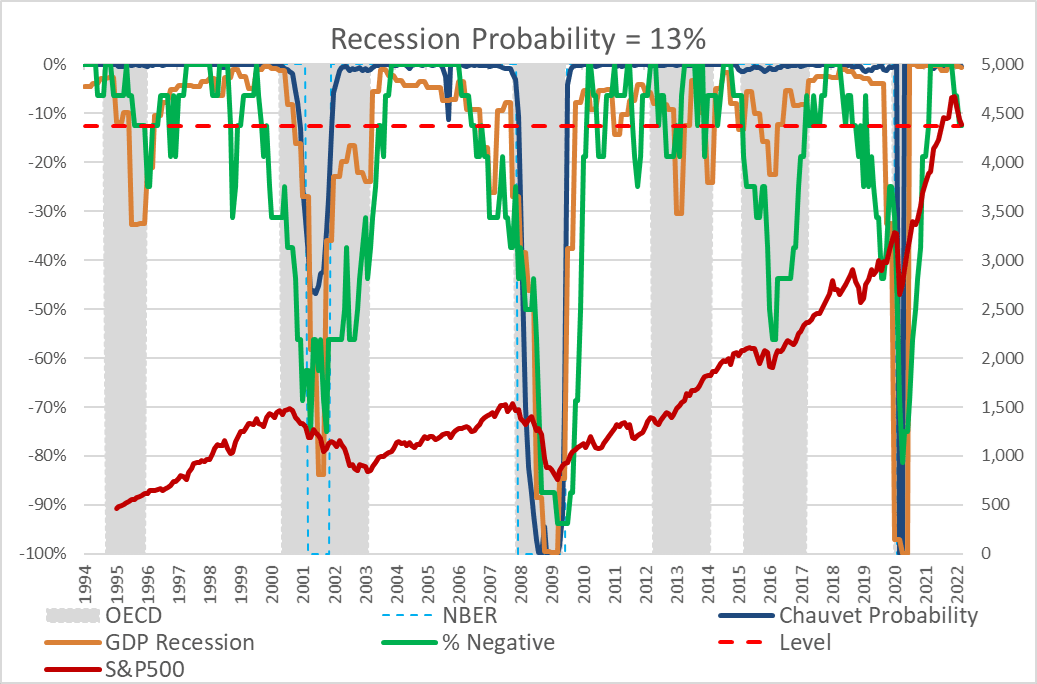
The supply chain shocks are global as shown in the Global Price of Commodities. There are plenty of indications of the extent of inflation around the world in Doug Noland’s Weekly Commentary. The de-globalization currently happening will be inflationary. It may be difficult to get under control.
Global Price Index of All Commodities (St. Louis Federal Reserve FRED)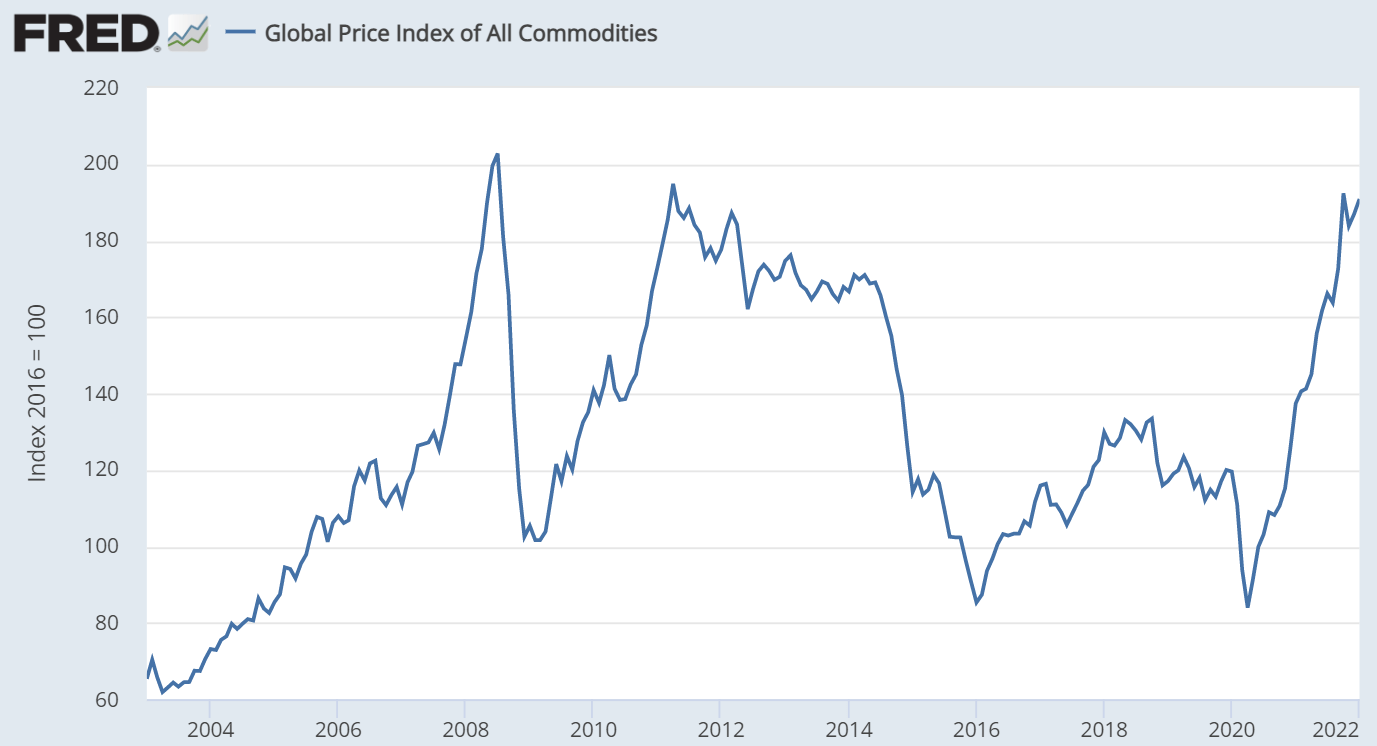
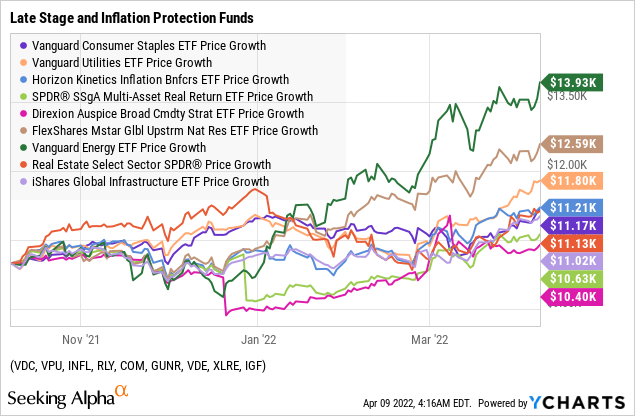
Classical Late Stage Assets
As the economy matures into the late stage of the business cycle, typical funds that do well in late stages are outperforming the S&P 500, technology and growth funds. Commodities, natural resources, real return, utilities, and energy have been performing exceptionally well. Below are some of the exchange traded funds that have done well over the past six months. Some of the sharp drops are due to dividend distributions. As a conservative investor, I look for funds with higher risk-adjusted returns in Lipper Categories.
ProShares Short 7-10 Year Treasury (NYSEARCA:TBX)
The ProShares Trust – ProShares Short 7-10 Year Treasury has $171M in assets under management and expenses of 0.95%. It has a Seeking Alpha Quant Rating of “Buy” and 3.63.
The fund seeks to track the inverse of the daily performance of the ICE U.S. Treasury 7-10 Year Bond Index, by using full replication technique. ProShares Trust – ProShares Short 7-10 Year Treasury was formed on April 4, 2011 and is domiciled in the United States.
I favor TBX of the three funds that short treasuries because of its lower volatility and drawdown. It provides some protection for against rising rates. I made a small investment in TBX and may add more if conditions develop the way that I expect.
Inverse Treasury Funds (Mutual Fund Observer)
Summary
The Federal Reserve can control inflation created by rising demand by slowing the economy sometimes resulting in a recession, but inflation on a global scale resulting from disruptions in supply chains due to COVID and the Russian Invasion of Ukraine will be much harder to contain.
Individual investors should maintain balanced portfolios. I reserve a tactical sleeve of 25% of a portfolio. I bought a modest amount of TBX as a tactical holding as the inverted yield curve story unfolds.
Be the first to comment