

Richard Villalonundefined undefined/iStock via Getty Images
I last wrote about the SPDR Dow Jones Industrial Average ETF (NYSEARCA:DIA) in June last year, arguing that the weakness in the Dow Transportation index suggesting a potential top for the DIA in accordance with Dow Theory. The theory states that a bull market is likely to remain intact if new highs in the Dow Jones Industrial Average are accompanied or followed by new highs in the Dow Jones Transportation Average. Major market peaks of the past have been characterized by weakness in the Transports even as the Industrials have traded at new all-time highs. Over the past 10 months, the divergence between the two indices was closed by a recovery in the Dow Transports, but we once again have a sell signal in place, making the DIA a poor risk-reward investment at present.
DIA Vs Dow Transports (Bloomberg)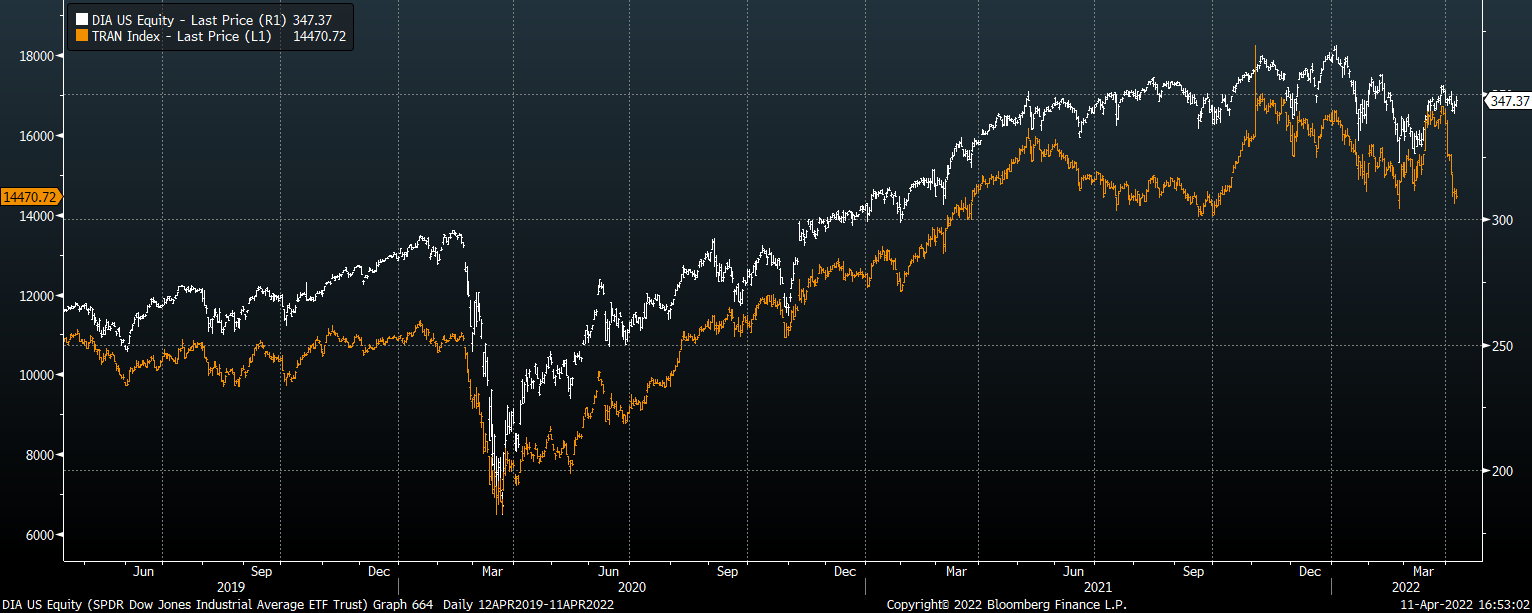
The DIA ETF
The SPDR Dow Jones Industrial Average ETF seeks to provide investment results that correspond to the performance of the Dow Jones Industrial Average. As a price-weighted index rather than a market capitalization-weighted index, the Dow Jones Industrial Average has a much lower weighting of Tech stocks due to its notable exclusion of Google, Amazon, and Facebook, and its much lower weighting of Apple, which commands just a 3% share.
Dow Industrials Components (Bloomberg)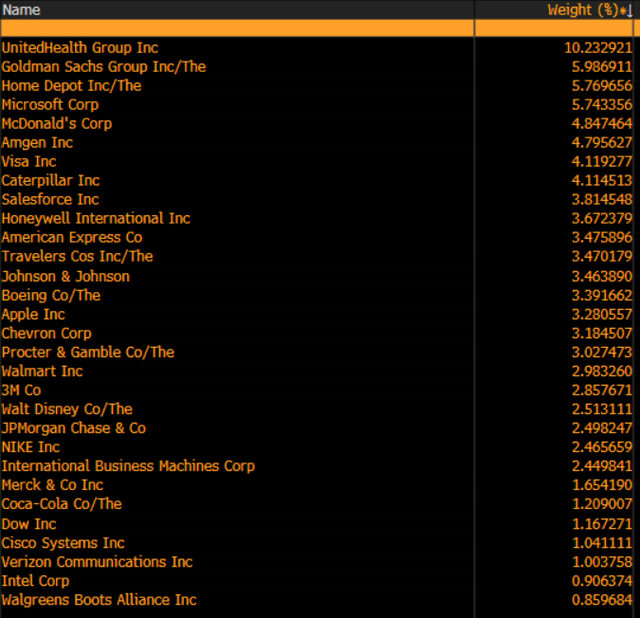
While Information Technology is still the largest sector at 21% of the index, it is closely followed by Health Care at 20%, while Financials make up a significant 15% share. The higher weighting of Financials and lower weighting of Tech stocks largely explains the higher dividend yield on the Dow Industrials relative to the S&P 500, which yield 1.9% and 1.4% respectively. However, the DIA ETF itself pays a slightly lower dividend yield than the underlying index it tracks, at just 1.7%.
Dow Theory Divergence Is A Necessary Condition For A Top In DIA
The key point to note is that a divergence in the Industrials and the Transports is a necessary but not sufficient conditions. In other words, it does not guarantee a major market top in the DIA, but a major market top in the DIA has almost never occurred in the absence of underperformance in the Transports sector. This can be seen in the chart below.
Dow Industrials Vs Dow Transports (Bloomberg)
Of course, there are a lot of false sell signals in this data, but if we tighten the criteria to periods where the Industrials are trading above their 200-day exponential moving average and the Transports are trading below theirs, as was the case at Friday’s close, we find that returns over the next 12 months have been significantly below average. Since 1946, such periods have periods have produced 12-month returns of 5.5% compared with over 8% during all other periods.
Valuations Remain Expensive
While this may not seem like much of a headwind given that 5.5% annual returns are still pretty good, and this does not include returns from dividend payments, this performance does not take into account valuations, which are an additional headwind to returns. While valuations have retreated somewhat since my previous article in June, the price/earnings ratio remains significantly above its long-term average. The chart below shows the price-to-peak earnings of the Dow Industrials, which helps to strip out periods when the market was trading at a high PE ratio due to temporary declines in earnings. This metric is 25% above its 30-year average.
Bloomberg, Author’s calculations
Also note that the current PE ratio is elevated even though profit margins are fully 60% above their 30-year average. Investors who assume that US corporations can maintain 13% profit margins over the long term are likely in for a rude awakening. As I have argued in a number of articles over recent years, investors should expect to see at least a partial mean reversion in margins over the coming years (see ‘SPX: Expect A Bear Market In Profit Margins’). While this may seem like a long-term problem rather than something to worry about today, if margins were to gradually mean revert to their 30-year average over the course of the next decade, this would reduce earnings by almost 5% per year, all else equal.
Dow Industrials Profit Margins (Bloomberg)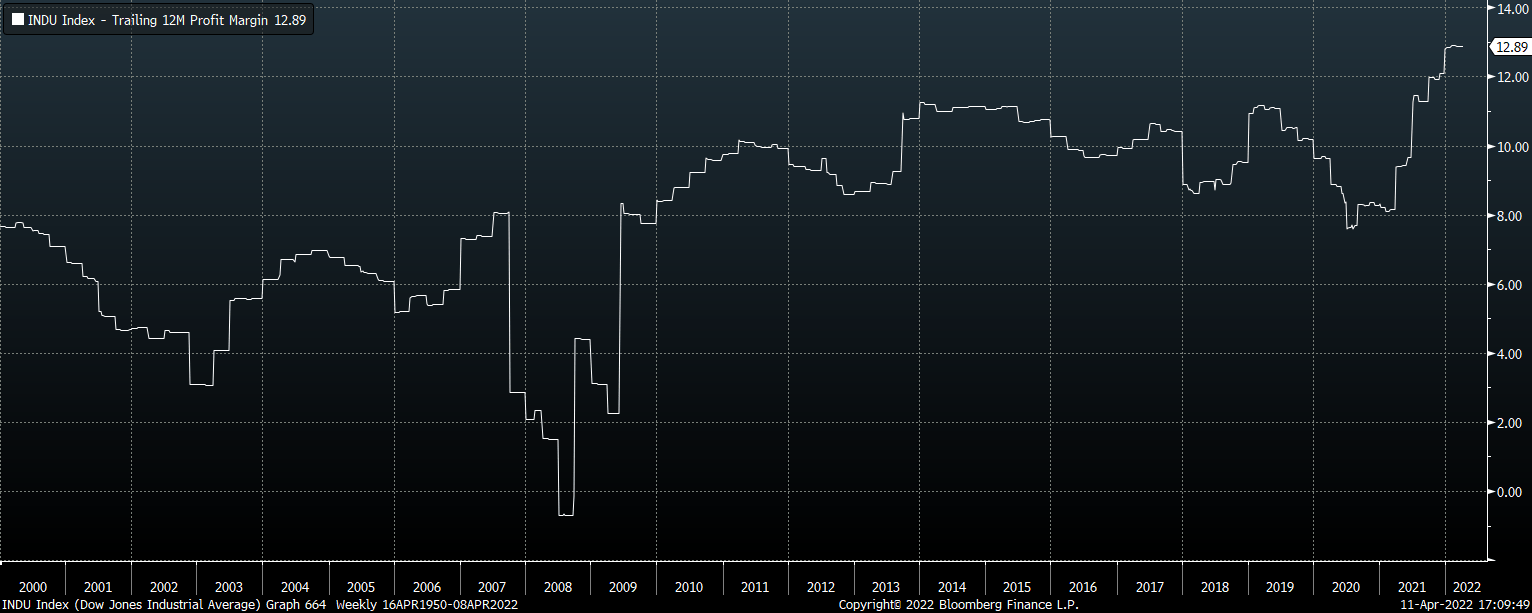
Summary
The recent underperformance in the Dow Transportation index is a potential warning sign for the DIA as weakness in the Transports sector is necessary condition for major market tops in the Dow Industrials. Further undermining the outlook for the DIA is its expensive valuations. Even after a slight retreat from its highs, the price-to-peak earnings ratio remains 25% above its 30-year average, even with profit margins at record highs.
Be the first to comment