

wildpixel/iStock via Getty Images
Investment thesis
Since the middle of October, it seems as if the stock market behaves differently than during the course of 2022 so far. Some analysts began to call for a bottom, but as I see it the majority still expects another leg down. In the current piece I tried to collect the most important pros and cons regarding a possible bottom from my perspective. I encourage readers to share their thoughts which one outweighs the other or share other arguments in favor or against a stock market bottom. I’ll start with the pros and get to the cons in the second part.
Macro: Slight tailwinds from inflation and growth prospects
Probably the most important piece in the puzzle of looking for a bottom is inflation (as it determines monetary policy as well), which seems to have peaked recently. Commodity prices – although still elevated – came down significantly from their summer highs and supply chain disruptions eased notably as well. With this, the annual headline U.S. CPI inflation came in at 7.7% in October showing another ~0.5%-point monthly decrease after the inflation print back in July. These readings tell me that we could have entered the phase, where a suddenly spiking inflation turns into a suddenly falling one as it has been the case in recent decades:
St. Louis Fed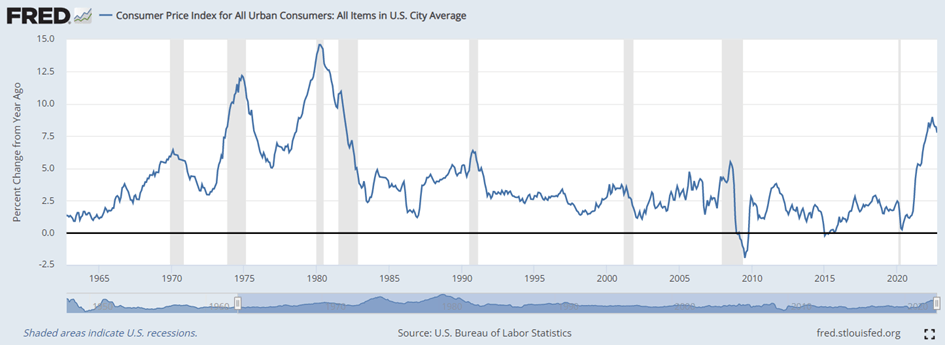
As one would expect the main driver behind this phenomenon is the high base from which inflation declines easily. However, if we look at monthly dynamics they show a similar pattern, which means that significantly above average inflation used to both appear and disappear rather quickly.
Beyond the classic model of price elasticity (price increases – demand decreases – price decreases -demand increases loop) central banks also play an important role during this process as they try to artificially decrease demand by hiking interest rates in order to speed up the effects of elasticity kicking in. Looking at the chart above we can see that this (together with other effects) usually resulted in recessions (grey shaded areas), which were already in place when the peak in inflation has been passed.
If we have passed peak inflation currently, the situation is different this time. Although the Fed pushes hard on the brakes it’s not sure that the U.S. will enter a recession next year, however, consensus says there will be one. But even if there will be one, most predict that it will be a mild one. This could be in line with the observation above that this time the economy managed to pass peak inflation without having to enter a recession, meaning the situation is not that bad. From the perspective of the stock market this could be welcoming news in my opinion, which makes me say, that the current macro-outlook favors a bottom: inflation, the main source of the 2022 stock market sell-off is showing evidence of cooling down, while the economy and company earnings still doesn’t show signs of cracking.
If one of these trends were to change significantly it would definitely overwrite the picture like some analysts predict. But until this doesn’t happen, I believe the combination of further cooling inflation and minimal economic growth could be a tailwind for stocks. However, it is important to add that there are several other factors that could influence the stock market in the coming months to a great extent as well.
Market sentiment has reached negative extremes
Another important factor that supports a stock market bottom in my opinion is the extremely pessimistic sentiment that has characterized the preceding months. Several sentiment indicators and surveys showed unusual levels of pessimism, which is usually a good sign that a rebound could be on the corner. If most investors get pessimistic there are not many stocks left to sell, but if a rebound occurs there could be many possible buyers from the large camp of pessimists.
One commonly referred survey tracking the mood of institutional investors is the monthly Global Fund Manager Survey of Bank of America. In November the survey showed that cash levels at fund managers were still very high at 6.2% after October’s 6.3% well above the 4.9% long -term average. Meanwhile fund managers were still extremely underweight equities meaning the pain trade for the stock market points still up:
Bank of America Fund Manager Survey – November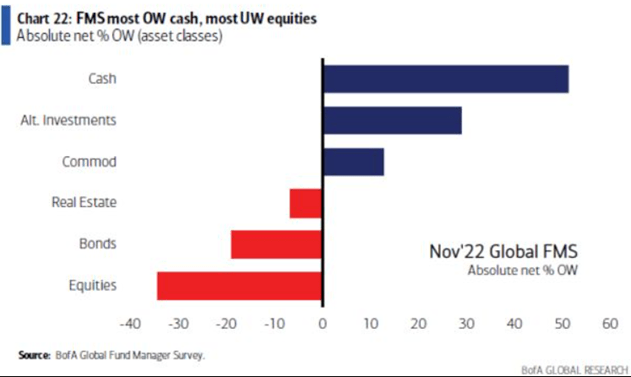
Another chart from the survey that supports the extremely bearish sentiment towards risk and stocks was the allocation to tech stocks:
Bank of America Fund Manager Survey – November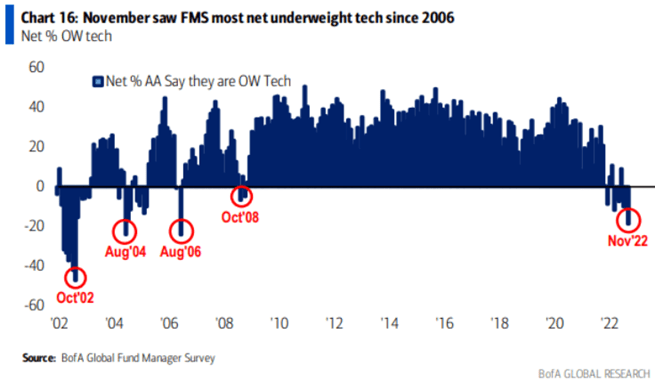
Fund managers haven’t been so pessimistic towards tech since 2006. If we look at the chart, we can see that this attitude didn’t last longer than a few months since the bursting of the dotcom bubble, which could be another sign that we have reached peak pessimism.
Another sentiment indicator I prefer is the weekly Investors Intelligence Advisor Sentiment survey, which summarizes the sentiment of hundreds of market newsletters. Yardeni Research makes a weekly sentiment update based on this data calculating the ratio of bulls to bears:
Yardeni Research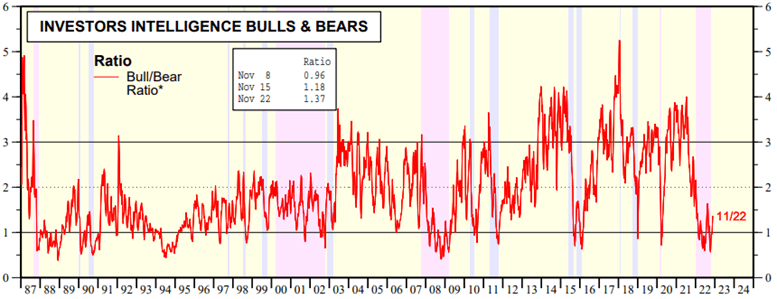
On the first week of November the ratio dropped below 1 again signaling that bears have outnumbered bulls, which is a rather rare constellation. It seems that in the following two weeks a rebound took place, which looking at past data could signal a lasting improvement in stock market sentiment.
Another chart from Yardeni Research shows that when the ratio has dropped below 1 in the past (green shaded areas) and rose subsequently above this threshold again it used to signal (only with few false signals) a local stock market bottom in the past decades:
Yardeni Research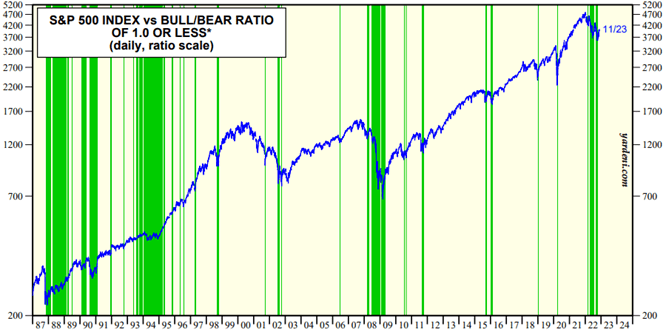
Beside the two surveys mentioned above there are some other popular ones as well, which show that we have already passed peak pessimism at the end of September. These include the NAAIM exposure index, the CNN Fear and Greed index or the AAII sentiment survey. Although I usually don’t attribute much predictive power to these three surveys as their results are strongly correlated with the S&P 500 index (SPX), two of them reached rarely observable lows in September that could be a sign of capitulation in my opinion.
Changing market behavior
Besides the possible change in the trend of inflation I have noticed a possible change in the reaction of the stock market to the publication of monthly inflation readings as well. In the following chart I have marked the publication date of the monthly CPI releases since the inflation report for May together with a few other important technical levels for the S&P 500:
www.investing.com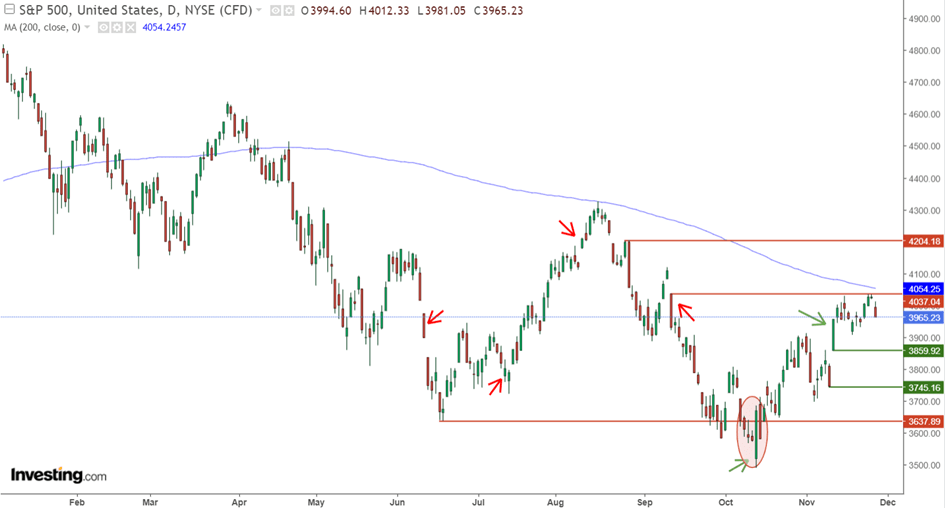
From the chart above we can see that the publication of the May inflation report that showed hotter than expected inflation (10th of June) was an important catalyst for the stock market to fall to a new YTD low a day later. Interestingly, the June CPI print that was worse than expected as well wasn’t received that badly (13th of July) and was followed by a summer rally in stocks. I think the main driver behind this rally was extreme bearish positioning and the stock market becoming quite oversold on the short run.
With the July CPI report (10th of August) we had a positive surprise after two months of surprisingly accelerating inflation, which gave a further boost to stock prices. However, this didn’t last too long as the 200-day moving average proved to be too much of an obstacle to overcome. The S&P500 continued its declining trend, which was amplified by the inflation print of August (13th of September) that showed faster than expected price increases again. This led to a new low at the end of September, which was coincided by extreme levels of pessimism by many sentiment indicators that I’ve covered earlier.
And here comes the interesting part as the publication of the September CPI report (13th of October) led to a remarkably different stock market reaction than we got used to in the preceding months. The report shoved hotter than expected inflation again leading the stock market to open at a massive new YTD low. However, this was followed by the 5th largest intraday reversal of the S&P500 in its history showing signs of a possible larger stock market bottom. The news have been obviously bad that day, but stocks have rallied at the end.
This upward trend continued into the coming weeks and was followed by the better-than-expected CPI print of October (10th of November) that sparked a rather unusual intraday spike in stocks with the Nasdaq Composite (IXIC) rallying 7% that day. I believe this showed a confirmation of the reversal in October signaling a stronger turnaround than any other during 2022.
With this, I believe I have exhausted the most important pros for a stock market bottom, it’s time to turn to the cons.
The stock market is still below key resistance levels
Looking at the chart of the S&P500 in the previous section we can see that the index is still below key resistance levels. The most important one is the 200-day moving average (currently at 4,054) in my opinion that has brought the summer stock market rally to an end. This resistance level is supported by a previous gap (4,037) that emerged after the August CPI print back in September making it even harder to break through. At the day of writing the index appears to run off steam at these technical levels strengthening their existence as a resistance. With this, it could currently seem that we are just witnessing another bear market rally from a technical perspective. If the support level at 3,860 were to break that could be a support for this theory.
Valuations are still not cheap
Looking at the valuation of the S&P500 we can see that even after this year’s sell-off the forward P/E ratio stands only at the average of the past 25 years:
J.P. Morgan – Guide to Markets Q4 2022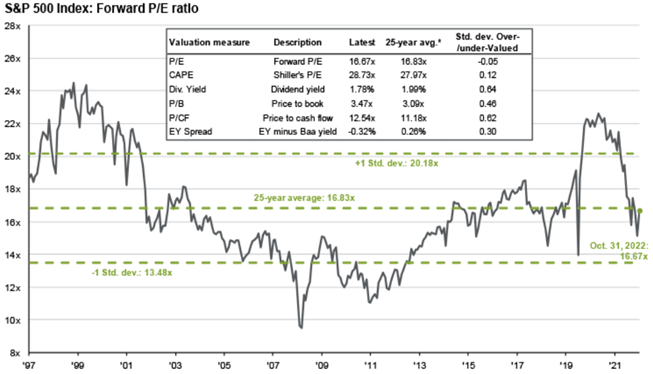
If earnings were to disappoint in the next few quarters as a result of a possible recession this could take the ratio even higher assuming constant share price. This tells me that currently we are far from those valuation levels that would scream for an instant long-term buy. However, if we won’t see the economic picture getting much worse perhaps these levels won’t materialize at all.
The Fed won’t blink
Probably the most important argument against a possible stock market bottom is the rock-solid communication of Fed members that they will keep on raising benchmark interest rates into next year and keep them at those relatively high levels for longer. It seems that inflation must cool substantially until central bank communication turns slightly less hawkish. This is obviously a strong headwind for the stock market, although I believe the market is getting used to this kind of communication.
After Powell’s latest press conference on the 2nd of November hopes for a slightly less hawkish Fed have been crushed again, which was followed by a sharp sell-off. Two weeks later this has been amplified by a presentation of James Bullard, the president of the St. Louis Fed who suggested that based on the Taylor rule the proper fed funds rate should be somewhere between 5-7%. After Fed Reserve board members and regional Fed presidents expected rates to peak somewhere between 4.4-4.9% after the September FOMC meeting this has been also quite a hawkish surprise. The knee-jerk stock market reaction was another initial sell-off, but this has been followed by an intraday turnaround. This tells me that hawkish Fed comments are not able to destabilize markets to the extent that we got used to during the previous months anymore.
In the top of that, beginning next year two of the most hawkish members (James Bullard and Loretta Mester) in the FOMC will be replaced resulting from the annual rotation of regional Fed presidents:
www.itcmarkets.com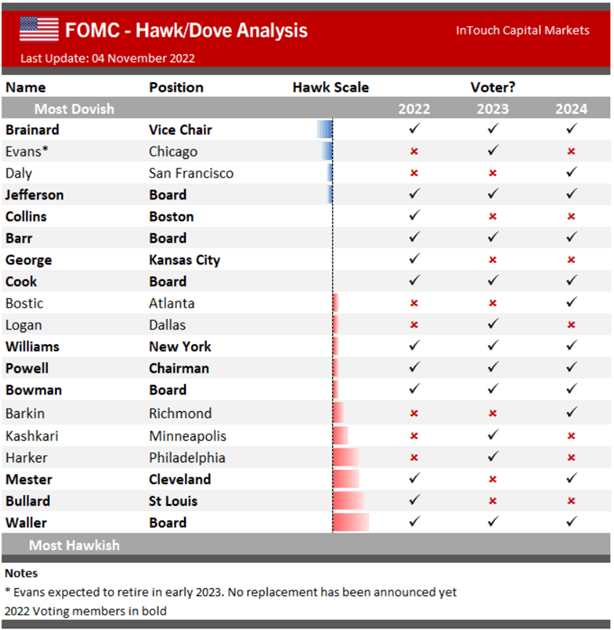
Although two new hawks will join the FOMC from 2023 they represent somewhat less of a hawkish extreme based on their public appearances.
So, the Fed is clearly a counterargument against a stock market bottom in my opinion, but not the sole decision maker on the topic anymore.
My conclusion
As described in the article I think there are several important factors that will influence the faith of the stock market in the coming months. Inflation seems to begin to cool down, but growth prospects are quite fragile. Meanwhile the Fed is still pushing hard on the brakes and shows no intent to back down. Still, stock market valuations are holding up quite well, making it impossible to call current levels a bargain.
However, the market seems to have digested the stubbornly aggressive stance of the Fed, which makes it hard to believe that there could be further significant downside catalysts from that front. Looking at historical trends, inflation could serve with rather positive surprises in the coming months in my opinion. These, coupled with previously extreme levels of pessimism from which the market is currently recovering make me tilt to camp of “bottom-callers”, even if it currently seems that I represent the minority with this opinion.
I believe the biggest risk to this is the possible worsening of growth prospects to an extent that could significantly decrease corporate profit expectations compared to current levels. I believe this could result in possible new lows, but if growth prospects were to change to such an extent it would probably move the other pieces of the puzzle as well.
I think this topic is currently one of the most debated ones in the market, so I invite everyone who made this far to join for a discussion in the comment section below.
Be the first to comment