

ZargonDesign
Most investors are on the edge of their seats looking for signs that the Fed may “pivot” to lower interest rates at some point in 2023. But they are ignoring a far more important fact: the U.S. and global economies have likely already entered into a recession.
Money Supply Growth Points Toward Recession
Money supply growth is the key driver of the boom and bust business cycle, as first explained by Austrian economists Ludwig von Mises and F.A. Hayek. Hayek was a student of Mises and won the 1974 Nobel Prize in economics for his pioneering work explaining the cause of the business cycle.
As Mises summarized:
True, governments can reduce the rate of interest in the short run. They can issue additional paper money. They can open the way to credit expansion by the banks. They can thus create an artificial boom and the appearance of prosperity. But such a boom is bound to collapse soon or late and to bring about a depression.
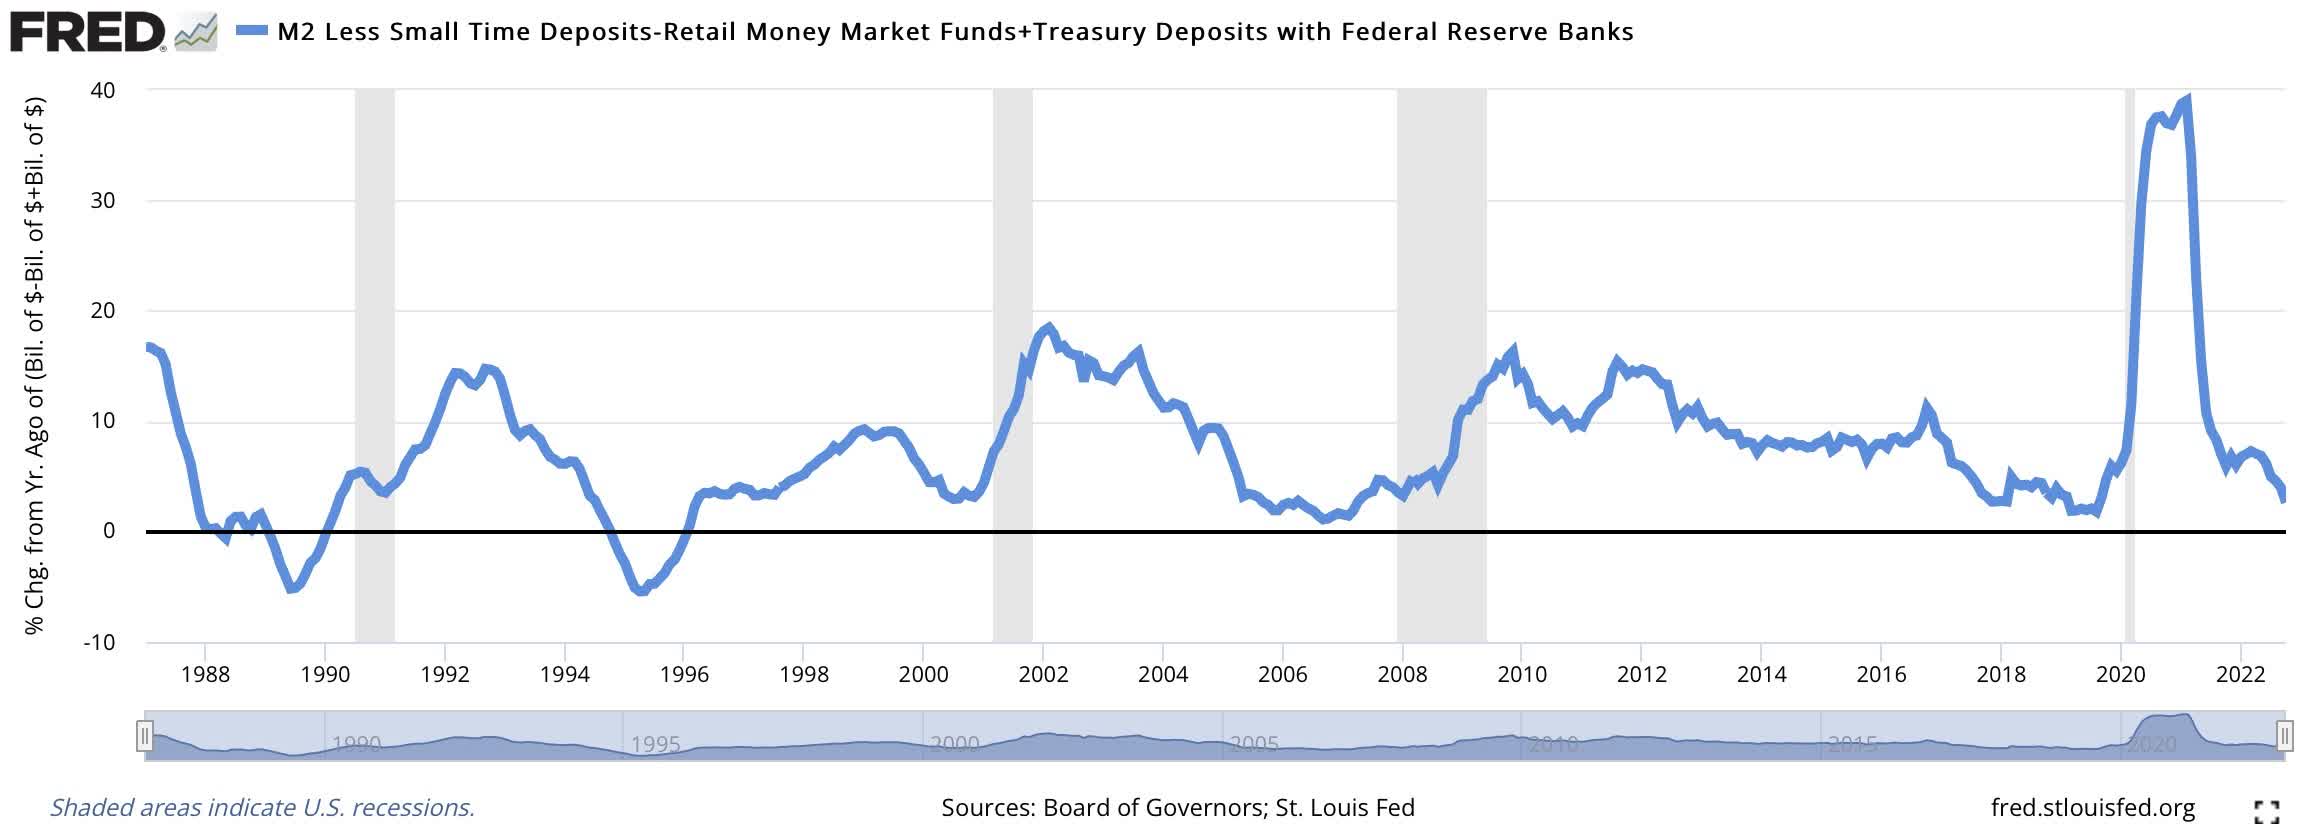
As shown below, money supply growth has slowed from a record-high 40% in 2021 to under 3% now. Typically, slowing money supply growth leads to a recession.
FRED
Housing Is In Recession
There are now numerous signs that a US recession has likely ALREADY started.
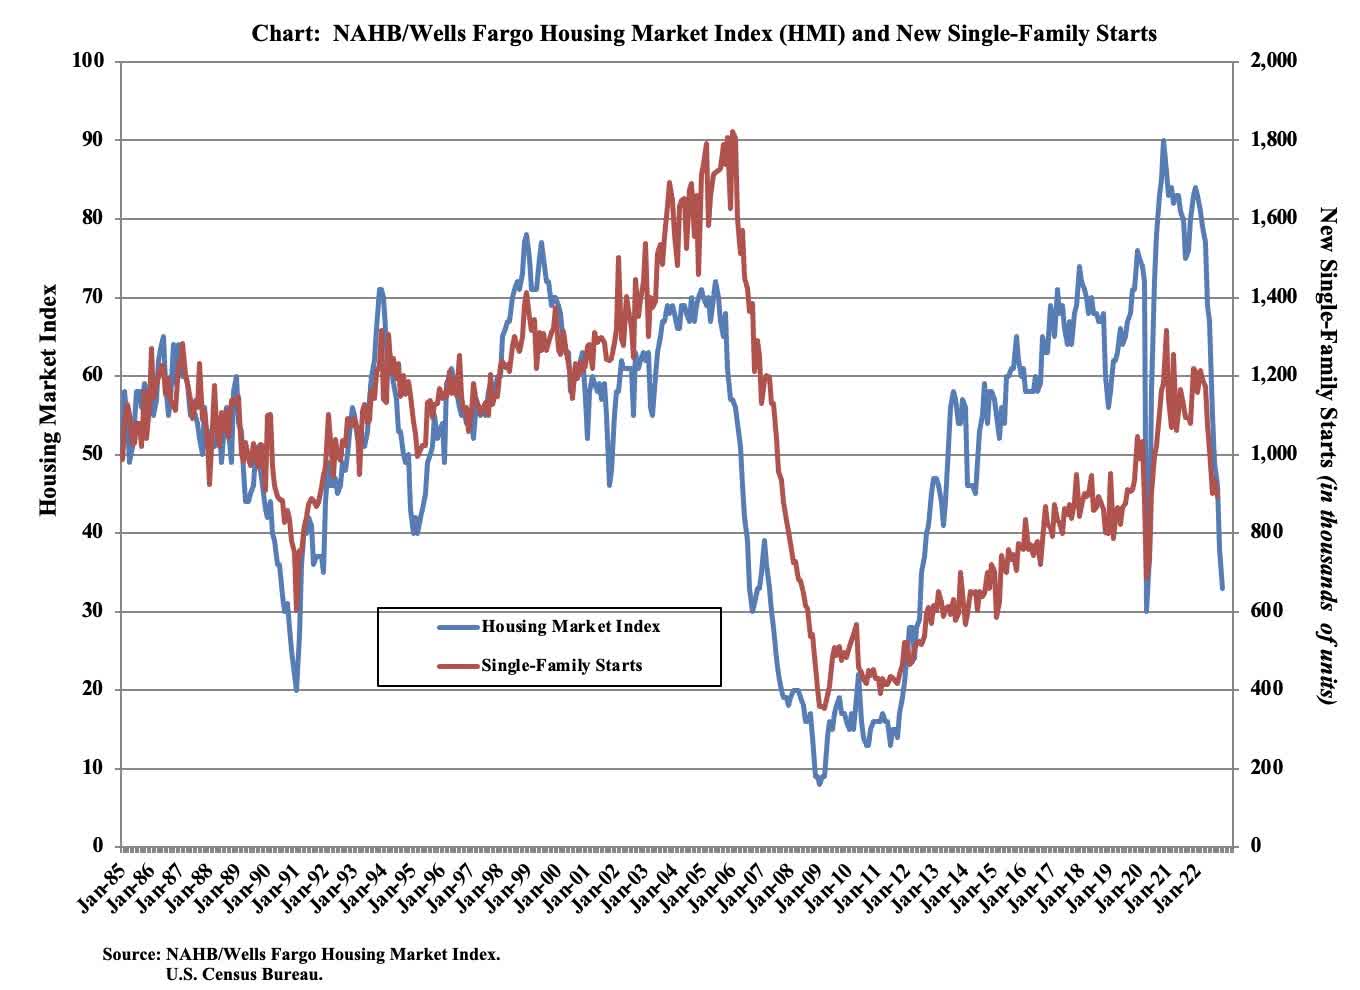
For example, the National Association of Home Builders (NAHB)/Wells Fargo Housing Market Index (HMI) has fallen for 11 straight months and is now at 33, well below the neutral 50 level of this indicator for housing demand. This is the lowest level since 2012, excluding the covid panic of 2020, as shown in the chart below. Housing demand is highly sensitive to money supply growth and interest rates, which makes it a very important leading economic indicator.
NAHB
According to NAHB Chairman Jerry Konte:
Higher interest rates have significantly weakened demand for new homes as buyer traffic is becoming increasingly scarce. With the housing sector in a recession, the Biden administration and new Congress must turn their focus to policies that lower the cost of building and allow the nation’s home builders to expand housing production.
Manufacturing Is In Recession
Manufacturing demand is another important leading economic indicator.
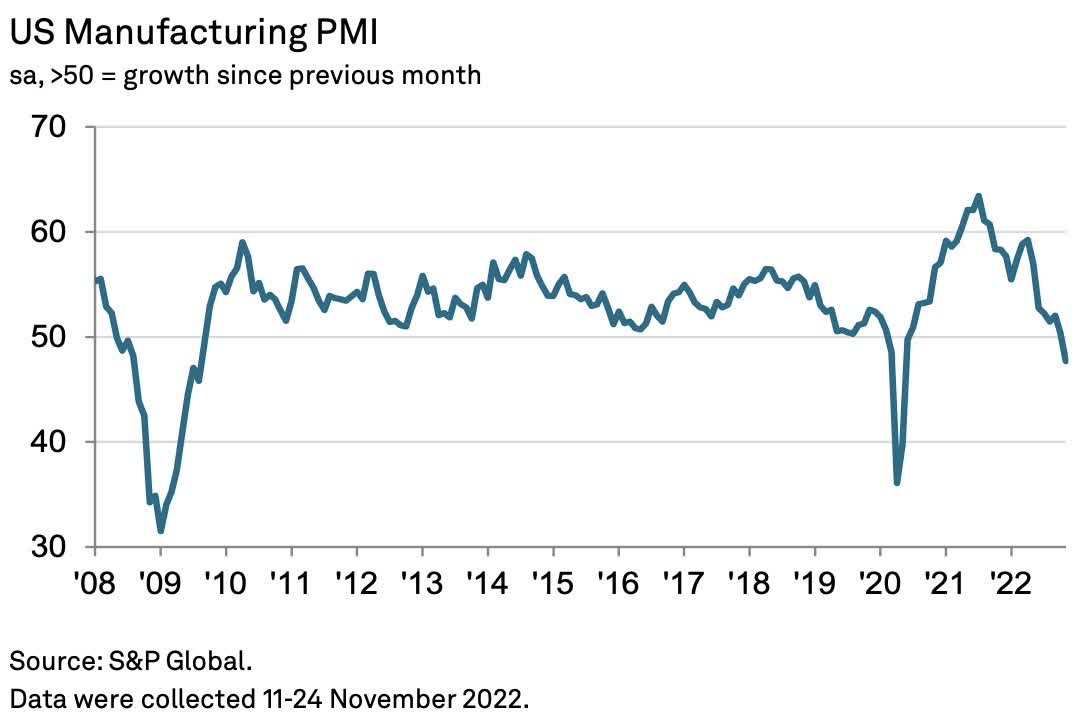
The S&P US Manufacturing PMI fell from 50.4 in October, which indicated modest growth as it is above the neutral 50 line, to 47.7 in November, indicating contraction. As shown below, this PMI generally only falls below 50 during recessions, such as the Great Recession of 2008-2009 and the covid panic of 2020.
S&P Global
Chief Business Economist at S&P Global Market Intelligence, Chris Williamson, provided detailed comments on the emerging U.S. recession:
A combination of the rising cost of living, higher interest rates and growing recession fears have led to slumping demand for goods in both the home-market and abroad. Companies are consequently cutting production at a rate not seen since the global financial crisis, if the initial pandemic lockdowns are excluded. However, even with the latest production cuts, the downturn in demand has still led to one of the largest increases in unsold stock recorded since survey data were first available 15 years ago, which suggests that companies will continue to reduce production in the coming months to bring these inventories down to more manageable levels.
Likewise, companies are slashing their purchases of inputs and raw materials at a rate not seen outside of the pandemic since the global financial crisis.
This slump in demand is increasingly manifesting itself in a shift from a sellers’- to a buyers’-market for a wide variety of goods, as evidenced by improving supply chains, meaning price pressures are now abating rapidly.
While supply chain worries persist, notably in relation to China’s lockdowns, companies’ concerns are increasingly moving away from the supply side to focusing on the darkening outlook for demand, meaning the business mood remains among the gloomiest seen over the past decade.
The JP Morgan Global Manufacturing PMI fell to a 29-month low of 48.8 in November. It has been below the neutral 50 level for three straight months, indicating that a global recession has likely already started. The Eurozone, Japan and China Manufacturing PMIs in November were 47.1, 49.0 and 49.4, respectively. With all below the neutral 50 levels, this shows that an economic recession is likely a reality now in every major economy in the world.
Leading Economic Indexes Are In Recession
The Conference Board’s Leading Economic Index (LEI) is highly respected for its ability to forecast recessions and recoveries. As shown in the following chart, the 6-month growth rate in this LEI has fallen below the 4% level that typically signals recession (red line).
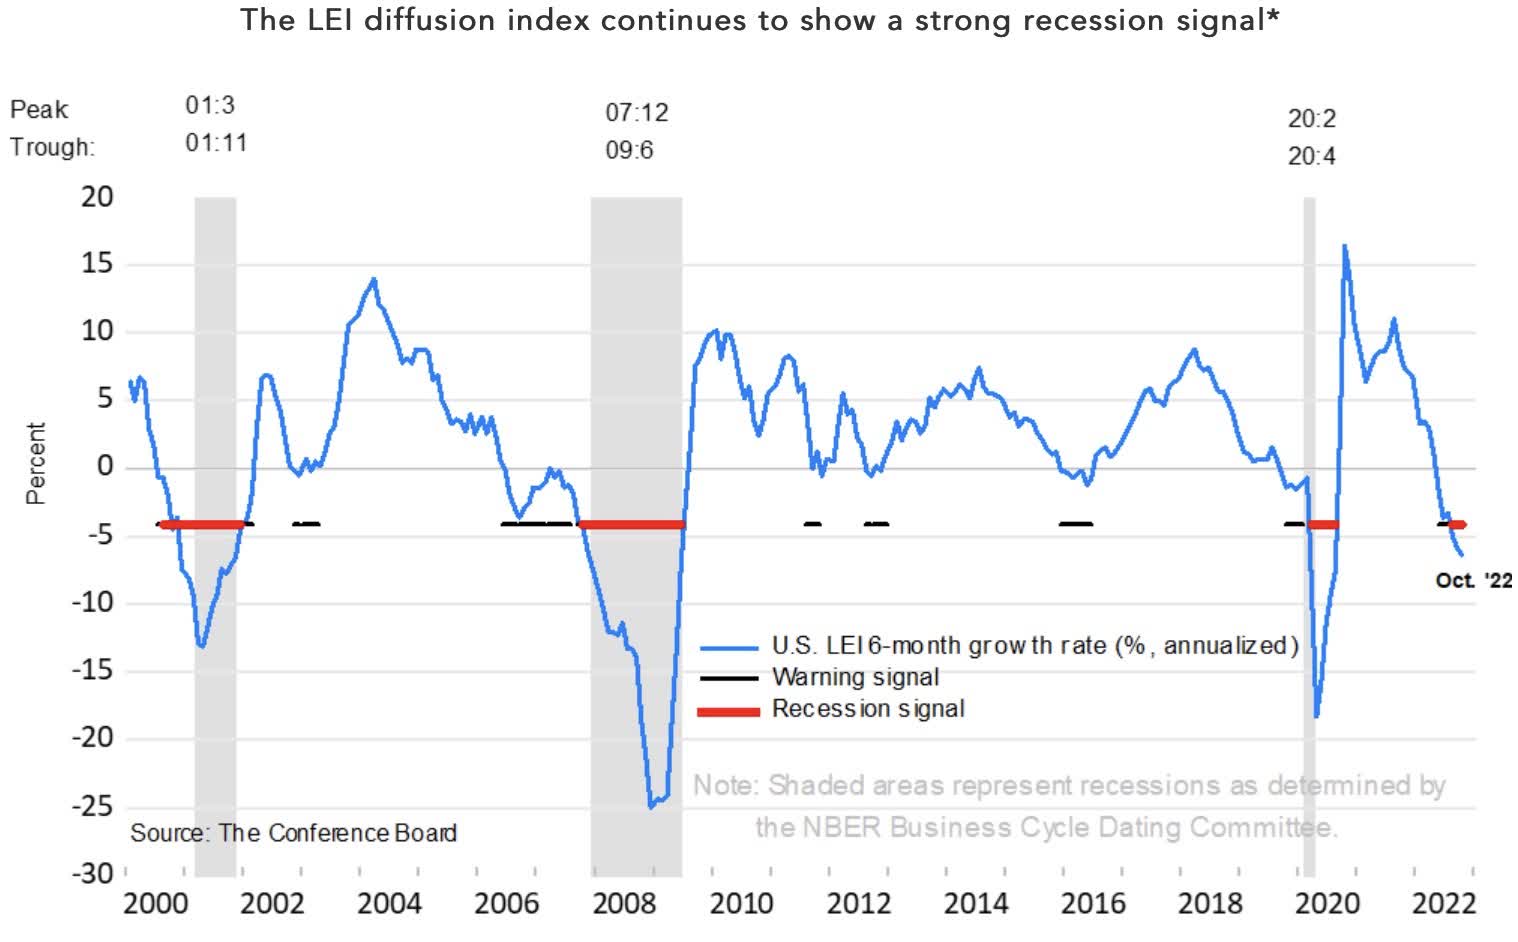
Conference Board
According to Ataman Ozyildirim, Senior Director of Economics at The Conference Board:
The US LEI fell for an eighth consecutive month, suggesting the economy is possibly in a recession. The downturn in the LEI reflects consumers’ worsening outlook amid high inflation and rising interest rates, as well as declining prospects for housing construction and manufacturing. The Conference Board forecasts real GDP growth will be 1.8 percent year-over-year in 2022, and a recession is likely to start around yearend and last through mid-2023.
The Economic Cycle Research Institute (ECRI) has one of the best track records in forecasting cyclical turning points in the economy.
ECRI forecasted a recession was coming earlier this year. They now say — given how deep their leading indexes have fallen into negative territory — that a recession is “almost a foregone conclusion.”
They recently gave a presentation titled “Cycle Risk Is Investment Risk” in which they provided charts of their key leading and coincident indexes. This chart below from their presentation shows their 21-Country Long Leading Index growth (top line) is similar to the levels seen in mid-2008. This suggests we are already in a global recession. And global recessions tend to be much more severe since there is no major economy in the world that can serve as a source of strength. The bottom line on the chart shows that we are currently in the highest level of central bank tightening in history, despite likely already being in a global recession.
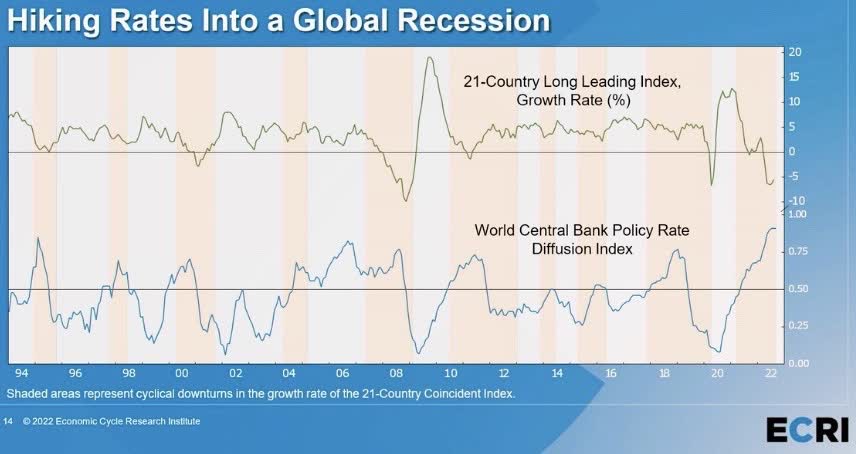
ECRI
As Lakshman Achuthan, head of ECRI, said: “I have not seen them [i.e., leading indicators] this bad” since he started his forecasting career in 1990 and “there is no bottom in sight on the global economy over the next few quarters.”
Yield Curve Points To Recession
This next chart shows the yield curve spread between the 2-Year and 10-Year Treasury yields. When this spread is “inverted” or negative, i.e., the 2-Year yield is higher than the 10-Year yield, a recession has followed every single time in recent decades. And note that the recessions (shaded gray) occurred after the Fed pivoted to lower rates, which caused the yield curve spread to turn positive. This spread is currently the most negative it has been in 40 years, which means a recession is likely already “baked in the cake.” Since the Fed has yet to pivot and the yield curve spread has yet to turn positive, the economic devastation of this inverted yield curve has yet to be seen.
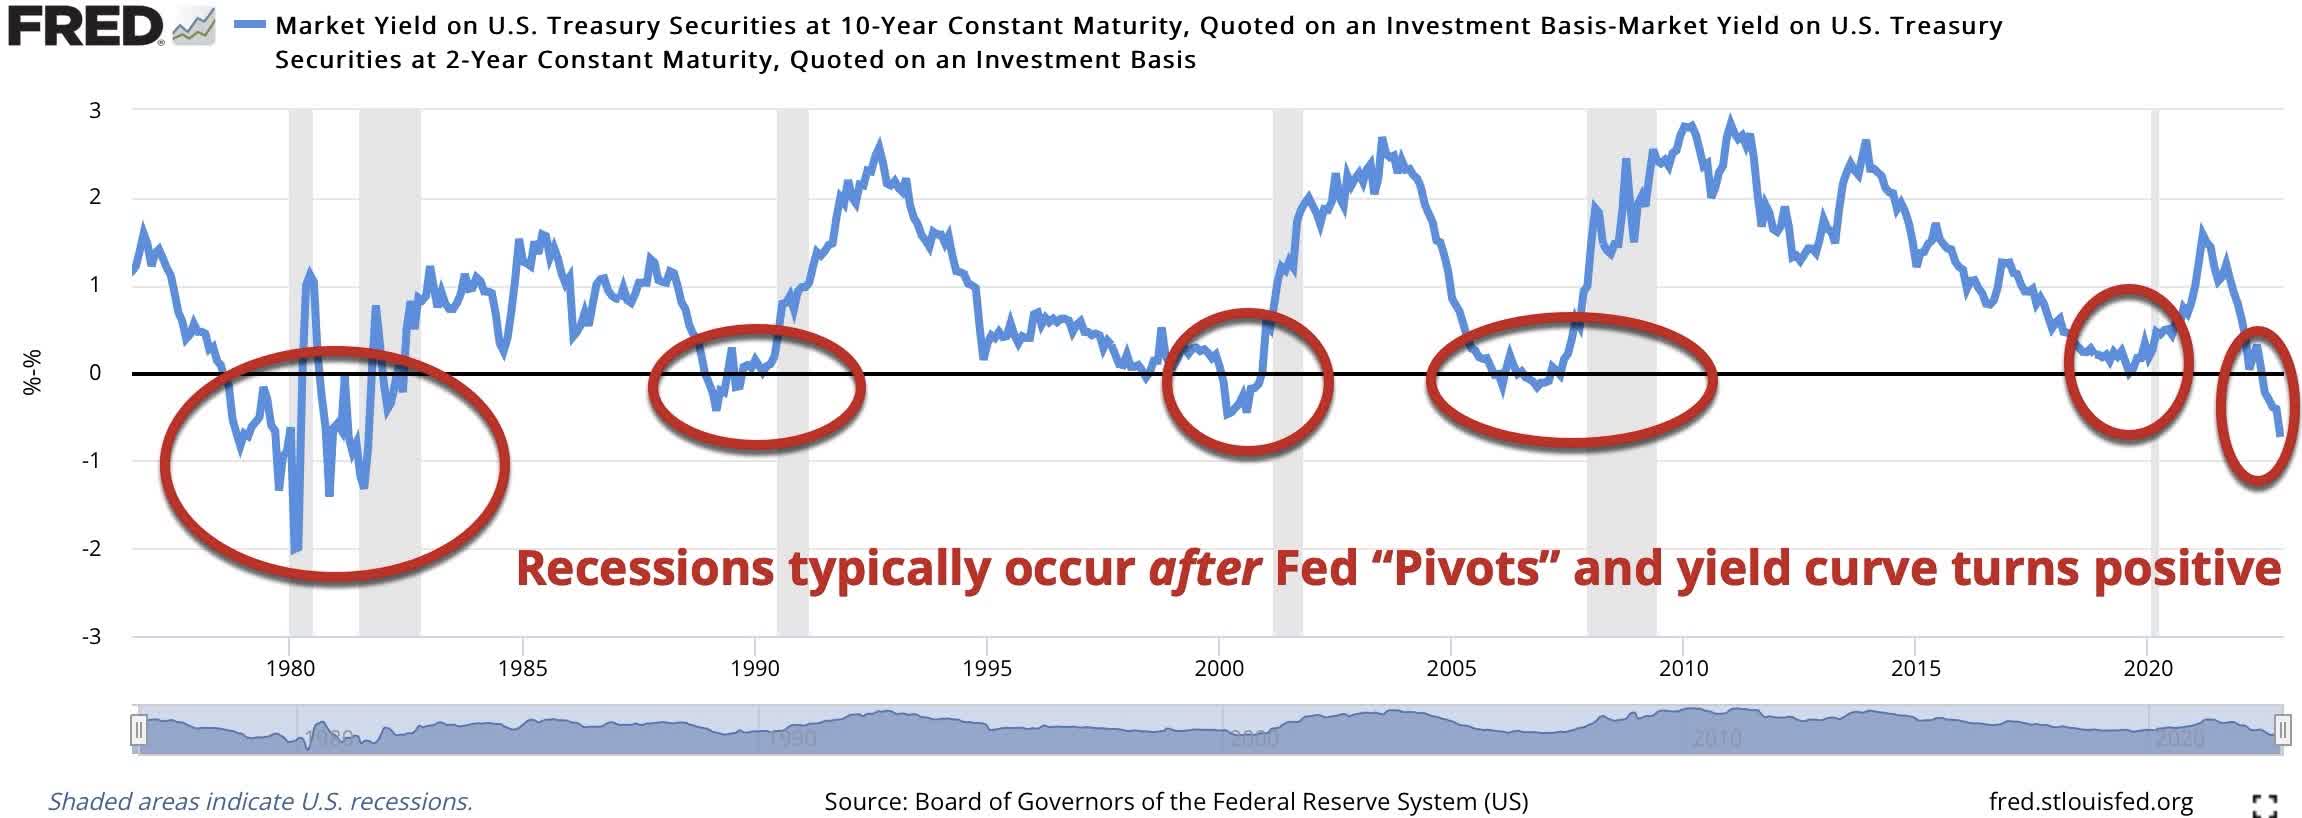
FRED
Bear Markets Don’t End With Investors Bullish About Rate Hikes
If the bear market is over, it would be the first time in modern history that a major bear market ended with the Fed still raising rates and before an inevitable recession clearly took hold.
As shown below, the Fed typically “pivots” before recessions and bear markets. The blue line is the Federal Funds rate, which the Fed targets, while the black line is the Wilshire 5000 broad stock market index. This chart clearly shows that all of these prior recessions (shaded gray) and the majority of these stock bear market declines (red circles with percentage stock market declines) occurred after the Fed pivoted to lower rates (vertical red lines).
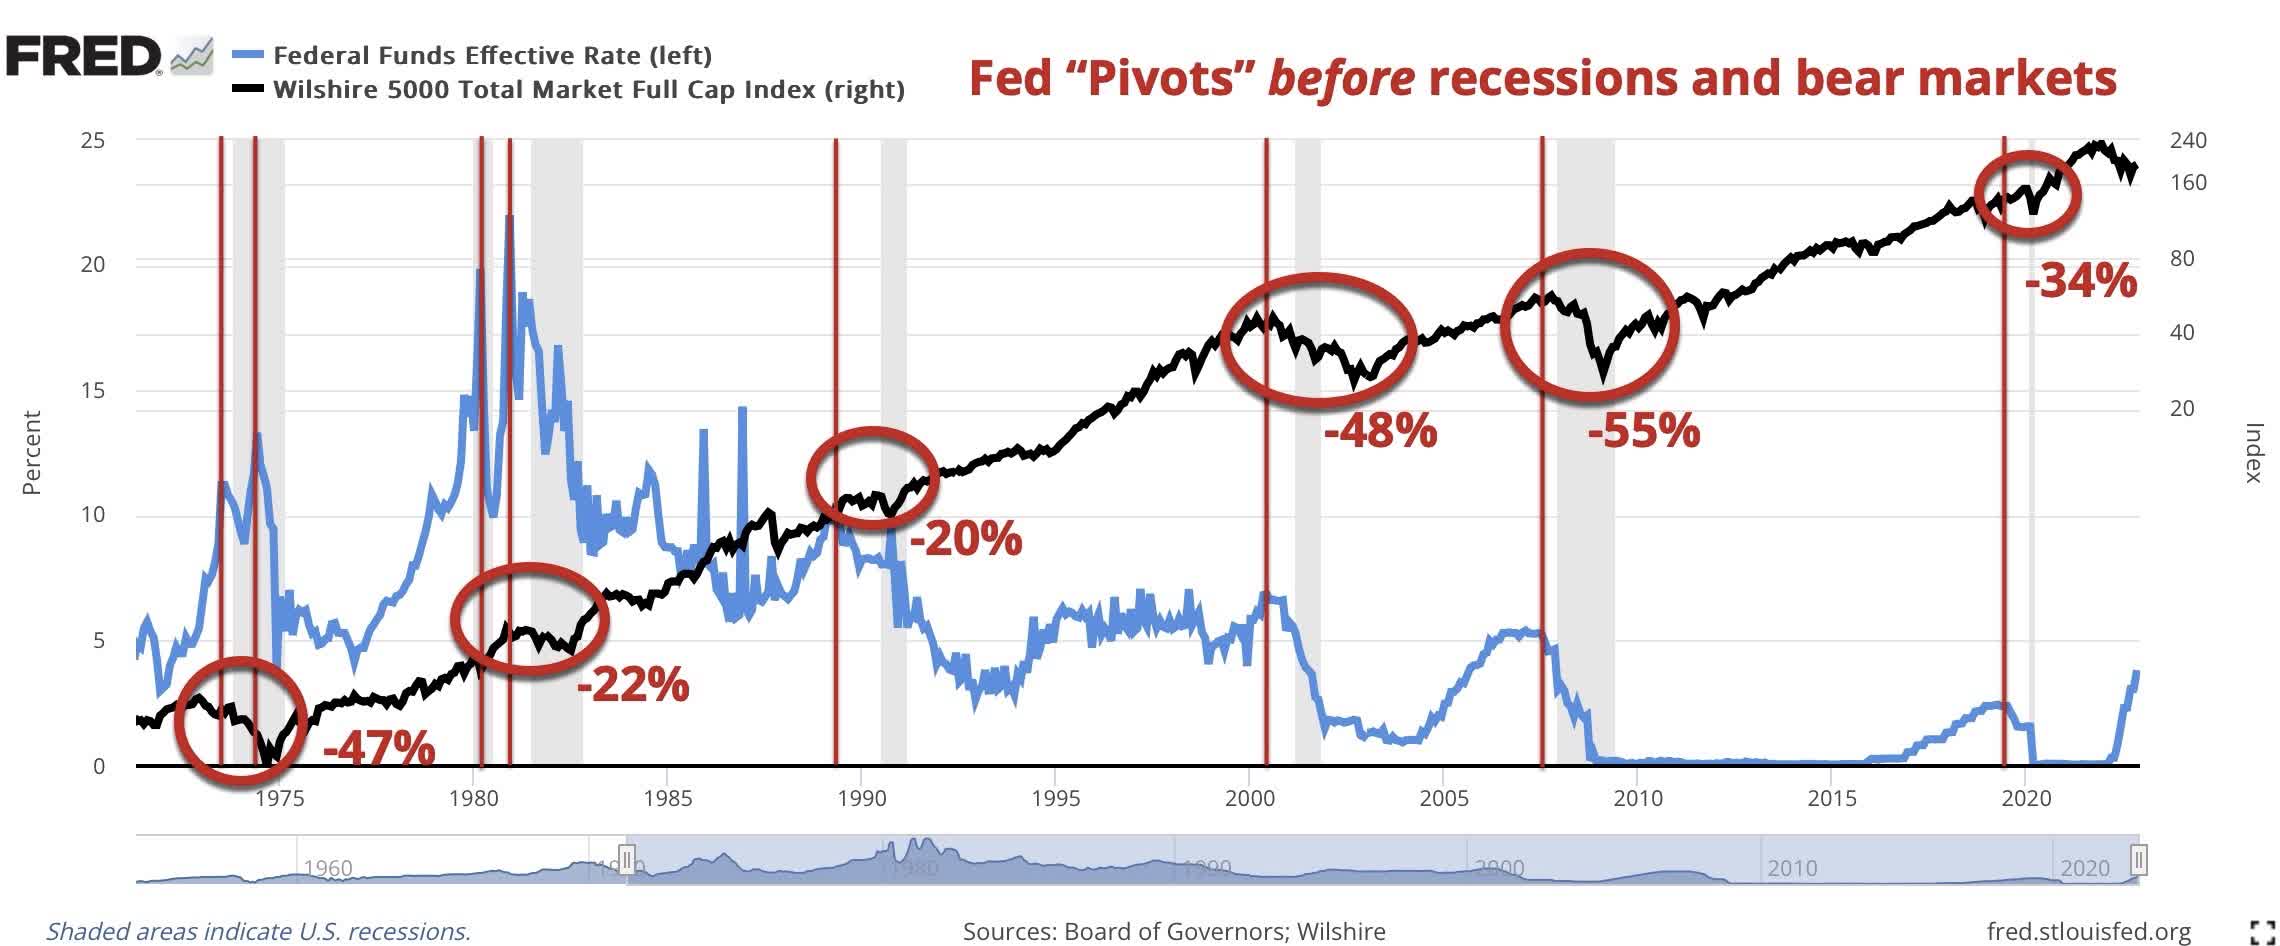
FRED
Despite All These Recessionary Signs, Investors Are Still Bullishly Positioned
With the Fed continuing to raise interest rates heading into a recession, it is amazing how bullish most investors remain. For example, the chart below shows the Rydex Asset Ratio, which is the ratio of assets held in Rydex bear and money market funds (bearish positioning) to Rydex bull funds (bullish positioning). Despite the bear market this year, this ratio remains are very low levels, which shows continued extremely bullish positioning by investors, which is contrarian bearish.

StockCharts.com
Next Bear Market Selloff Has Likely Started
The chart below shows the S&P 500 (top clip) has once again been rejected at its downtrend line and downward sloping 250-day moving average. Price momentum, based on the Percentage Price Oscillator (PPO; bottom clip), has turned negative. This suggests the market is starting another major selloff in this ongoing bear market.
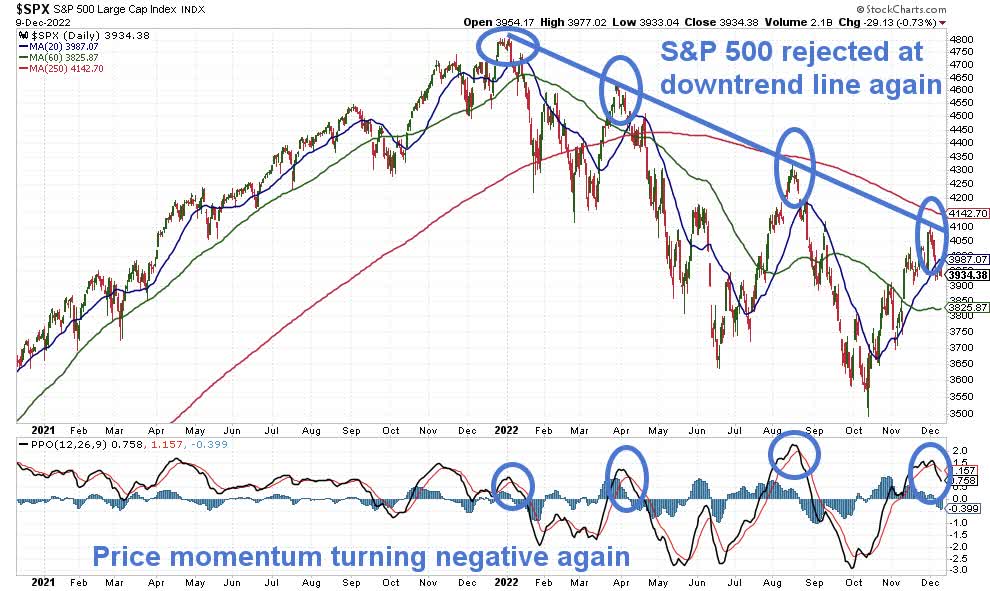
StockCharts.com
Implications For Investors
With investor sentiment bullish following the recent stock market rally and hopes for a Fed “pivot” at some point in 2023, the elephant in the room at that the U.S. and global economies may already be in a recession. Moreover, this is likely to be a severe global recession. And with inflation remaining well above the Fed’s 2% target and no signs of a significant slowdown in inflation anytime soon, the Fed is continuing to tighten into this recession, rather than ease monetary policy, as they did prior to recent recessions.
This suggests much more stock, commodity and crypto weakness to come, which investors should be prepared to profit from.
Be the first to comment