

Laurence Dutton/E+ via Getty Images
Introduction
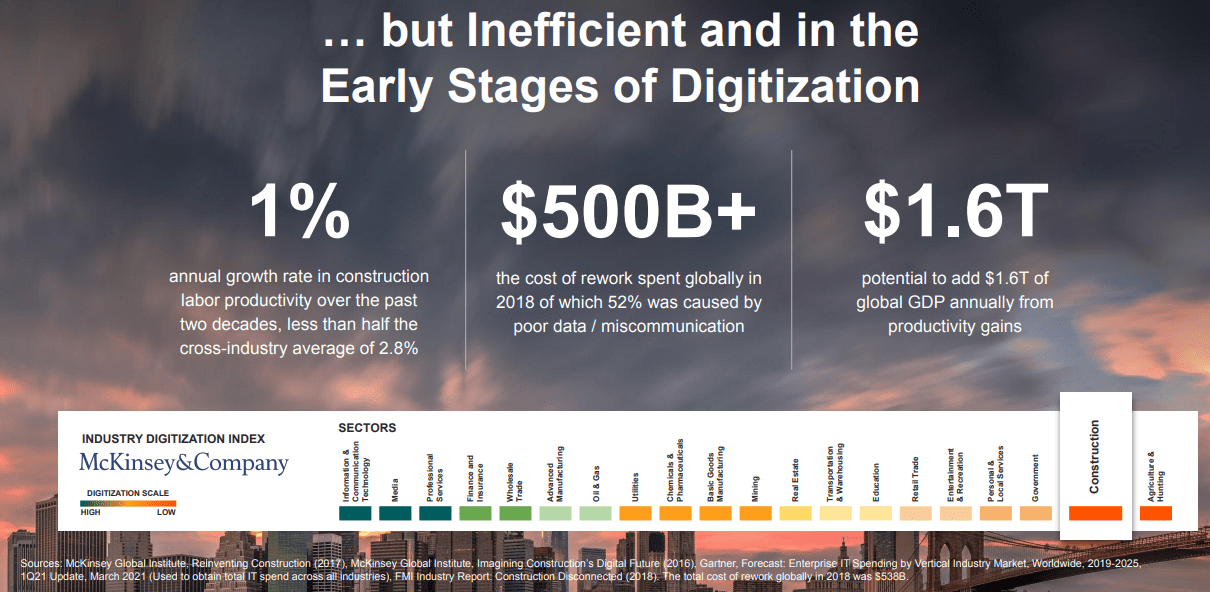
One relatively underserved industry in terms of software-based optimization is the construction industry. It is also an extremely complex industry with multiple parties all coming together for a single project and this often leads to delays and excess costs due to inefficiency. Procore (NYSE:PCOR) is one major new entrant into the field that provides a platform for all entrants in the industry to leverage and become more efficient. Considering the rapid growth over the past few years, I would say Procore has a strong platform.
As Procore takes the first mover advantage in the provision of construction management software, they have been able to drive growth over the past few years. Now, revenues have reached over $600 million per year (TTM), and the recent IPO has strengthened the balance sheet for longevity. The issue now is the ability to continue expanding into the industry at a profitable growth rate, as losses remain significantly negative. Investors must then balance that fact with the future potential as the industry leader, and consider it will be worth the wait by starting investments here in 2022. I hope this article conveys the opportunity effectively and helps you make your decision.
Procore Investor Presentation Procore Investor Presentation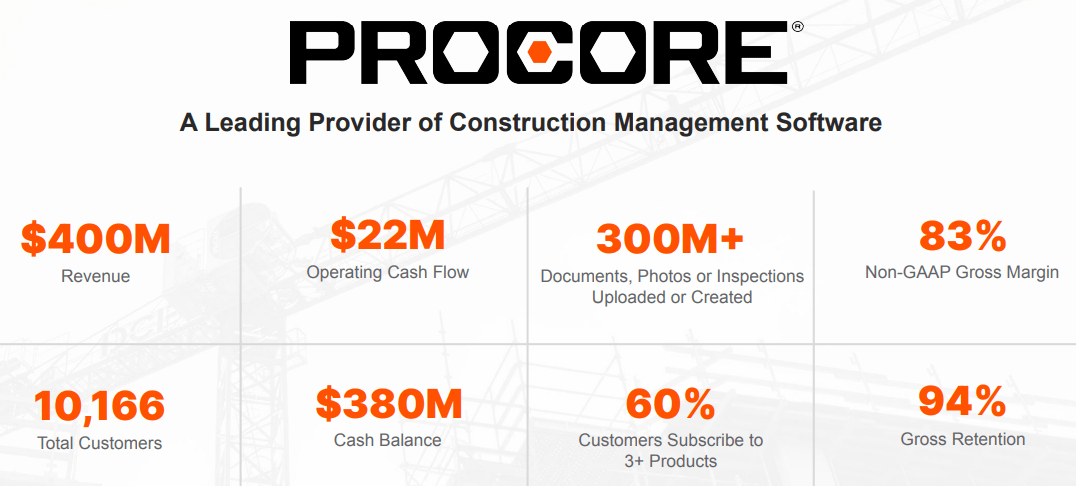
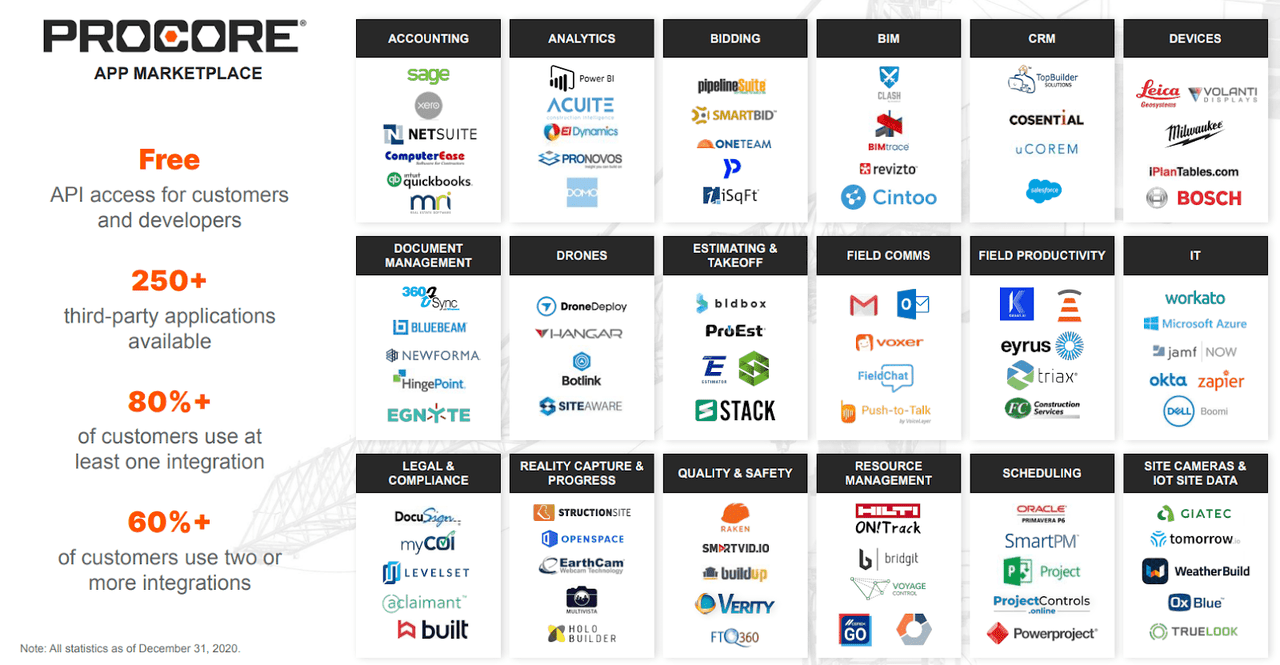
One may ask why legacy software providers such as Microsoft (MSFT), Google (GOOG) (GOOGL), Salesforce (CRM), or even Autodesk (ADSK), have yet to target the industry with the range of solutions that Procore provides. Finding a niche is always one key for success. Interestingly enough, all four of those software providers, and many more, are all able to be integrated into the Procore platform.
The closest major competitor, Autodesk, is primarily focused on architectural and engineering design and rendering, with their Construction Cloud platform only being released in 2019 (Procore was founded in 2002 and always has focused on construction management software). The two have also seemed to have put aside their prior animosity and the more friendly relationship will help drive success with both firms.
As the clear leader outside of CAD or creating blueprints, the focus on project resource management, procurement, safety, and communication are all areas with little competition. Sure, there are thousands of software companies that provide the individual components that are necessary, but Procore is the only platform that integrates all the services into one place with a target towards the construction industry.
While other competitors could rise that offer similar levels of integration capability, PCOR’s lead is quite significant and it will take some time and investment for them to reach equal scale. The two images below highlight the broad capabilities that are already established, whether it is allowing for 250+ software integrations or the processing of over 224 terabytes of data per month.
Procore Investor Presentation Procore Investor Presentation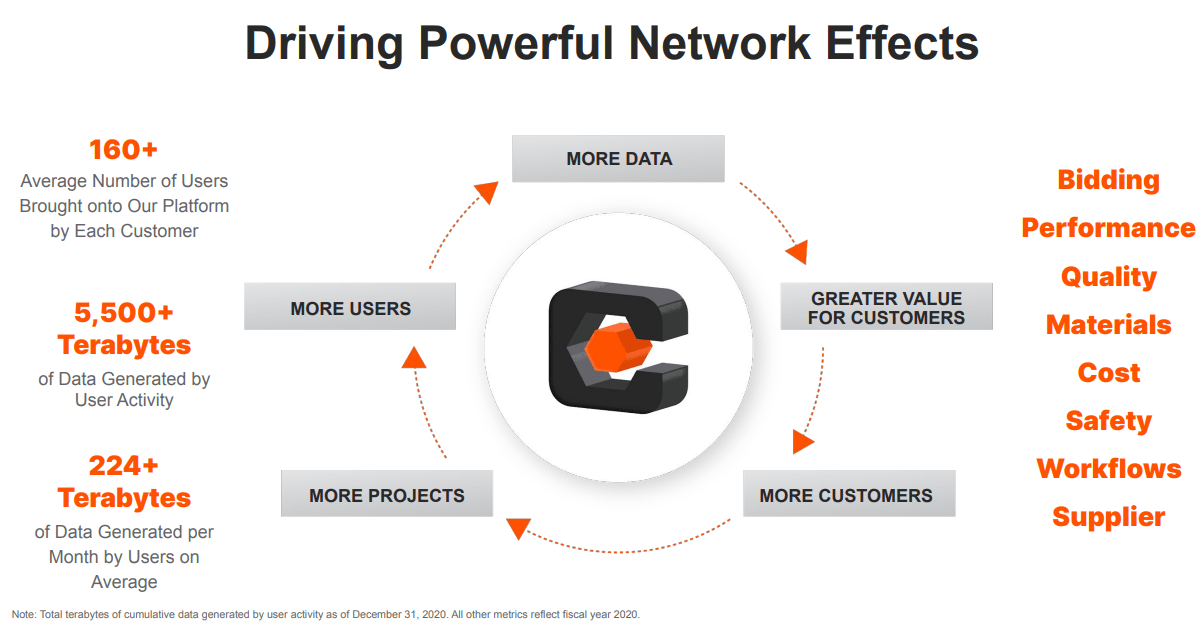
ABI Data
While it is clear that software penetration in the construction industry remains low and further organic growth remains certain, short-term macro difficulties remain a worry point for most (I assume based on the 50% value drop over the past year). Therefore, it is important to use some data to understand how the architectural industry is faring at the moment. One of the best ways to do so is with the data provided by the American Institute of Architects’ Architecture Billings Index, or ABI. The monthly data offers a cursory look at whether the industry is growing or slowing down, and is summarized as follows:
The Architecture Billings Index (ABI) is a diffusion index derived from the monthly Work-on-the-Boards survey, conducted by the AIA Economics & Market Research Group. The ABI serves as a leading economic indicator that leads nonresidential construction activity by approximately 9-12 months. The survey panel asks participants whether their billings increased, decreased, or stayed the same in the month that just ended. According to the proportion of respondents choosing each option, a score is generated, which represents an index value for each month. An index score of 50 represents no change in firm billings from the previous month, a score above 50 indicates an increase in firm billings from the previous month, and a score below 50 indicates a decline in firm billings from the previous month.
As so, how does the data look here for the most recent report of August 2022, even as interest rates are already climbing significantly? Well, the ABI has risen MoM to 53.3 from 51, a very positive indicator. This is because there typically is a slowdown in growth during the fall and winter, but an increase now highlights that firms around the world continue to develop new projects. However, the next few months will be important to keep an eye on as we enter into weaker economic conditions.
AIA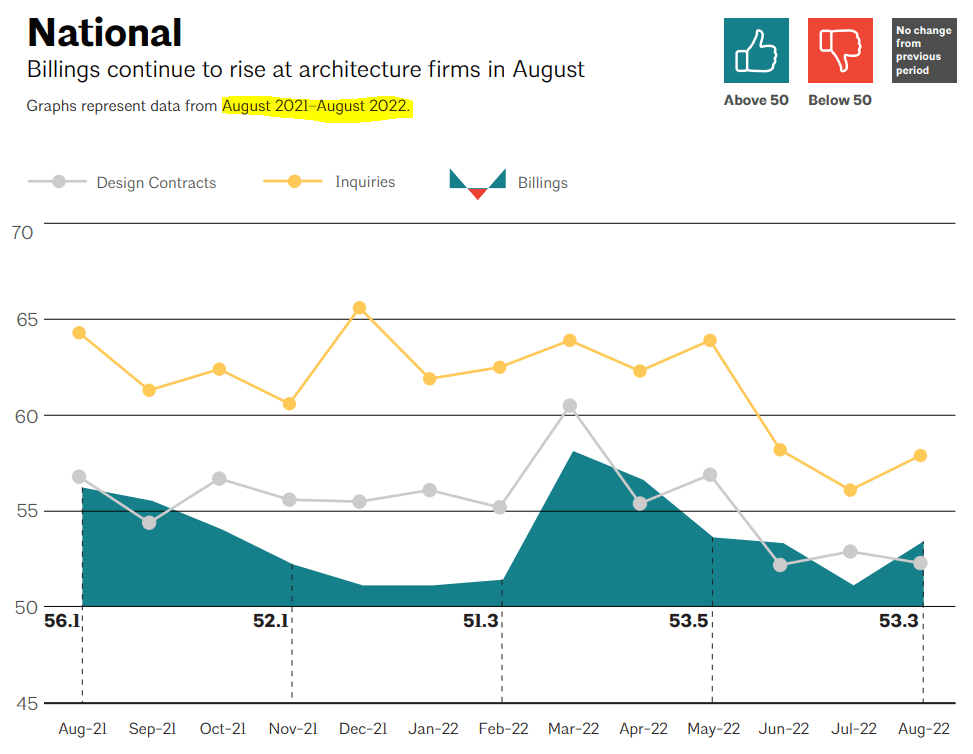
The ABI is a great tool to use because there is value in the historical data. As an example, the index turned below 50% to lows in the 30s just from the pandemic. It also took a whole year, from February 2020 to February 2021 for the index to return above 50% (or positive growth). As such, we can consider that economic weakness from inflation and high interest rates will be offset to a degree thanks to projects being moved forward from the pandemic era.
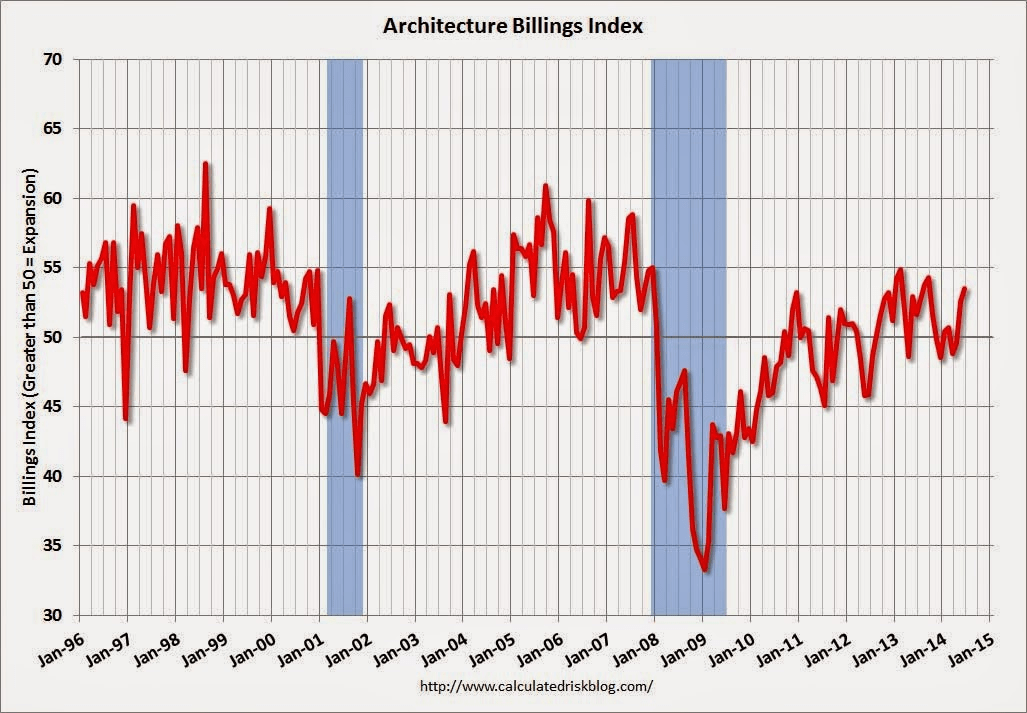
On the other hand, if the index turns negative over the next few months or quarters, then there may be a strong signal for a recession. Just look at the second chart below to see how the ABI fell sharply in 2000 and 2008 at the early stages of the recessions, rather than later on. Regardless, Procore will be more likely to succeed when the industry is in a growth phase rather than a bear market, and these indicators will help investors keep realistic expectations.
AIA Calculated Risk Blog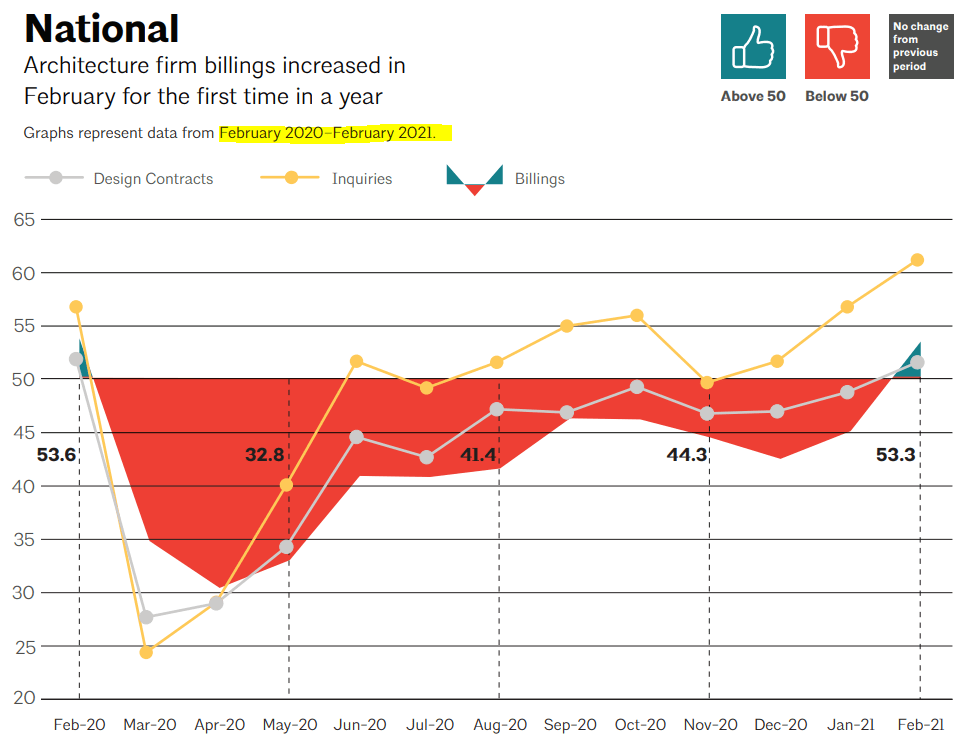
Financial Summary
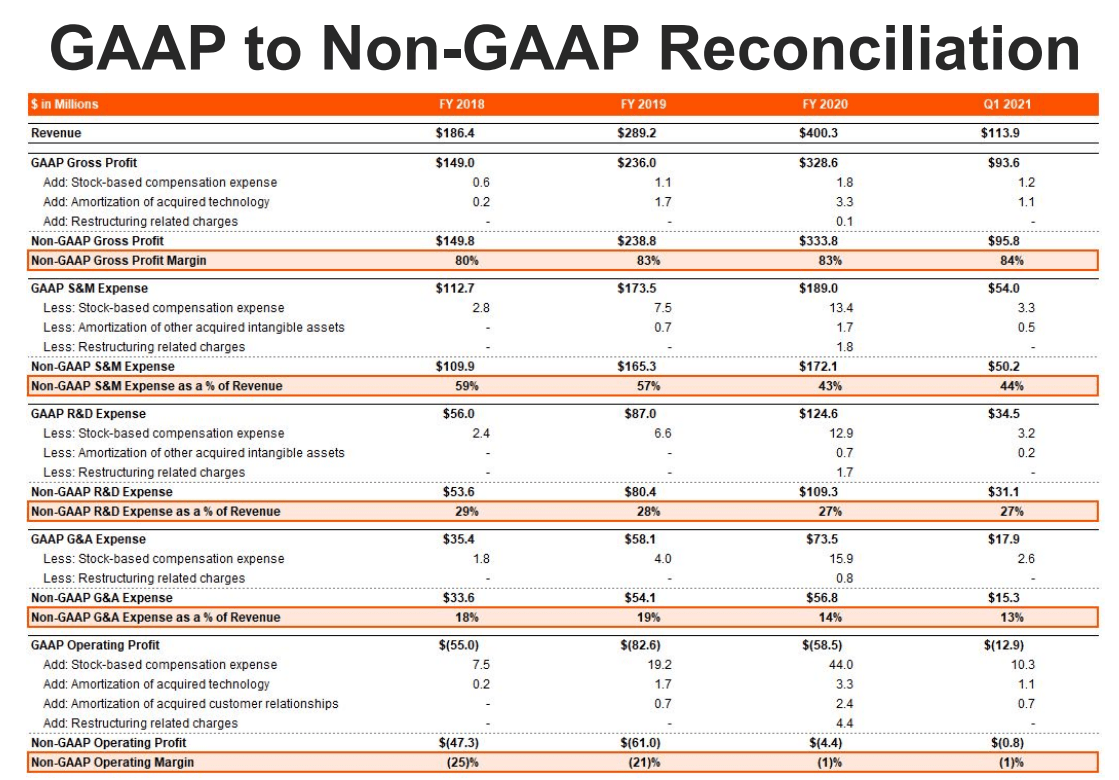
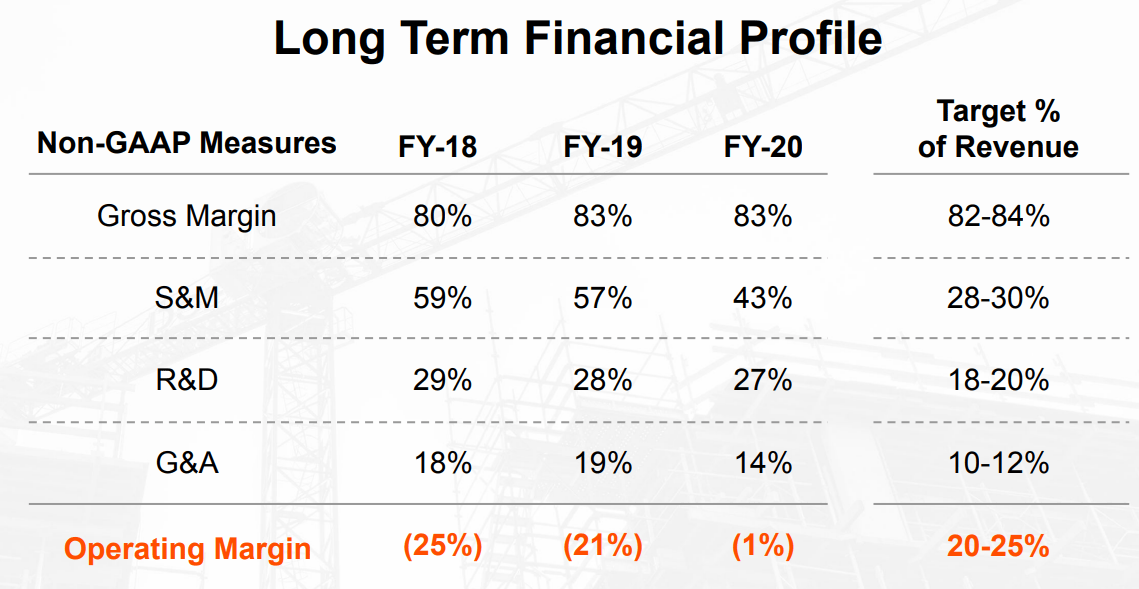
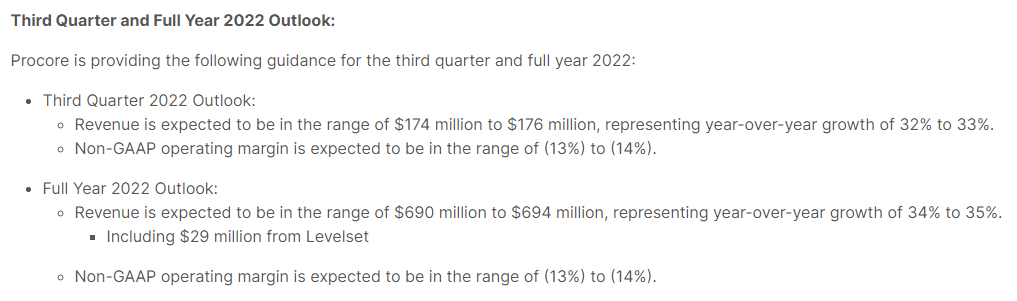
While qualitatively Procore seems to have many bullish indicators with first movers advantage, capabilities, and market environment, but those mean nothing if the financials are weak. However, the primary goal of growth is met, with revenues growing over 30% per quarter (YoY) on average. They have also been growing steadily over the past two decades since formation. However, with growth comes losses, and GAAP data shows that operating margins have been negative in FY 2018-2021.
Thankfully, expenses have been toned down starting in 2021, and if the trend continues, we should see net profitability within a few quarters if that is the goal. We also should be considerate of any investments relating to M&A or R&D and these help with the company’s longevity down the road.
Koyfin Procore Investor Presentation
While net losses remain negative, including free cash flows, the current cash on hand of over $550 million is more than enough to ride out a few more years of losses. As the IPO was less just over a year ago, dilution has not been a major issue (only for minor SBC). With the amount of cash on hand I do not expect major dilution for at least a year or more, if at all.
As more earnings reports come out, I would like to see management set an end in sight to the losses, as these will help keep the free-falling valuation in check. But based on the most recent reports, the goal for 20-25% operating margins remains pushed into the future. Make sure to tune into the first annual investor day on November 9th for more needed details.
Koyfin Procore Investor Presentation Procore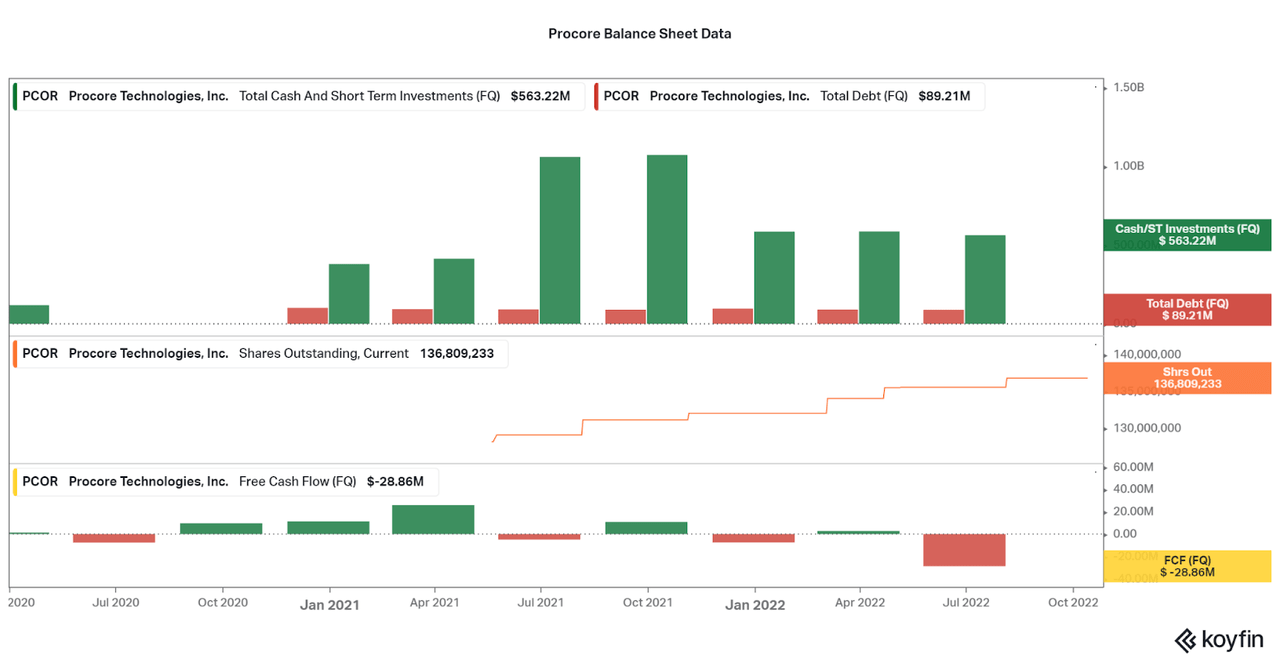
Conclusion
I believe that Procore will be one of the primary software companies on my watch list over the next year, but I would like to see losses improve (2022 is seeing an uptick in losses). Current guidance suggests revenue growth is strong despite rising interest rates and the ABI remaining positive, but things could change quickly in the coming months. Best to stay nimble on your feet and be prepared for weakness.
Koyfin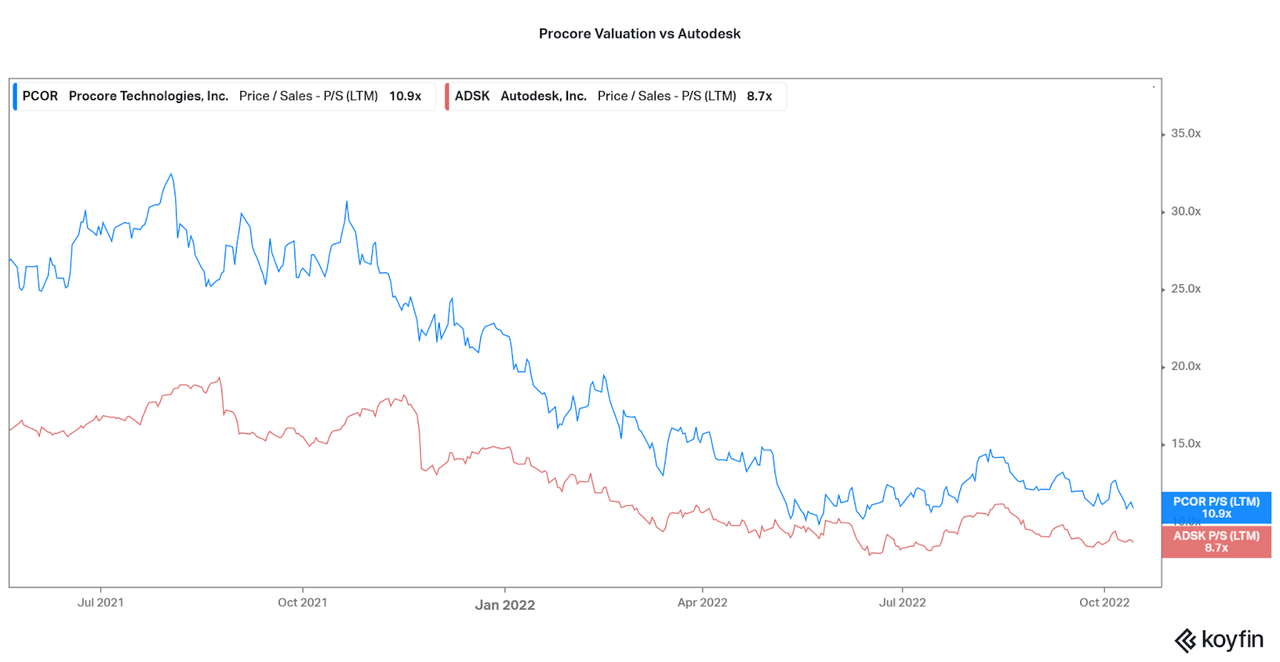
As the valuation chart suggests, Procore will soon be at a similar valuation to Autodesk, and I would consider that a stunning opportunity to buy as Procore is growing faster. As with many contrasting investments, it will be a battle of growth and profitability long term. Investors who have a long-term mindset and are willing to invest on a recurring investment should be looking to initiate a position over the coming months. The annual presentation in November may be quite insightful, so I will be waiting until then.
Thanks for reading. Feel free to share your thoughts below.
Be the first to comment