

10’000 Hours/DigitalVision via Getty Images
Oxford Lane Capital (NASDAQ:OXLC) is a closed-end fund (“CEF”) specializing in both debt and equity tranches of CLOs (collateralized loan obligations) collateralized primarily by senior loans. This is a significant point of departure from the other large closed-end fund focused on CLOs, Eagle Point Credit Company Inc. (NYSE:ECC), which focuses on equity CLOs but also focuses on senior loans.
OXLC states that a focus on leveraged loans is ideal because they are paid first in the event of a default or restructuring and because they are usually tied to specific assets from an issuer. This theoretically helps create a floor for how low the value of the senior loans can go, in turn limiting the decline in value of a CLO collateralized by said senior loans.
Oxford Lane Capital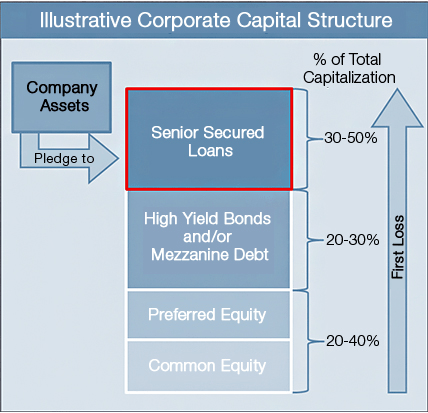
A deeper look into how OXLM works, what it invests in, its costs to investors, and its past performance gives us a clear indication of whether you should buy OXLM or not and, if you do, what risks you are taking on.
OXLC Past Performance
Both OXLC and ECC believe that investing in CLOs over senior loans directly provides superior returns, and it is hard to disagree. On a NAV basis, both firms have outperformed the senior loan market, as evidenced by the SPDR Blackstone Senior Loan ETF (SRLN), and other senior loan funds like the Invesco Senior Loan ETF (BKLN).
Ycharts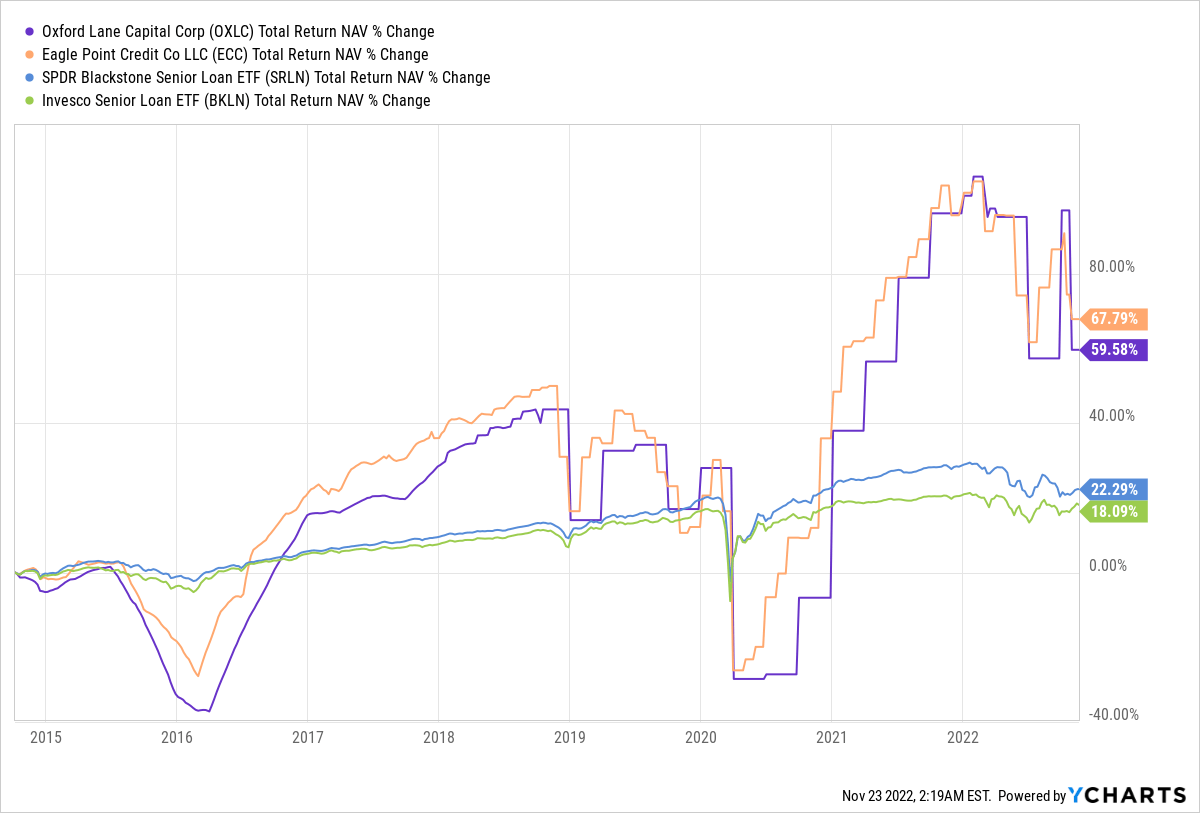
Selectivity and leverage are both important components of this outperformance, as both firms take on significantly higher risk than the broader market both by choosing which CLOs to buy and by employing leverage to augment returns. In Q3 2022, ECC had $245.78m in liabilities and a debt: asset ratio of 33%. OXLC’s $491m in liabilities in August 2022 were 39% of assets, similar if slightly higher than ECC.
The higher debt load has not resulted in a higher total NAV return, nor a higher total price return than ECC. More worryingly, both have massively underperformed the S&P 500, indicating that CLOs are an asset to be picked up in times of extreme stress (dip-buyers in 2020 were rewarded handsomely, a result I did not anticipate that has led me to dig much deeper into the CLO world):
Ycharts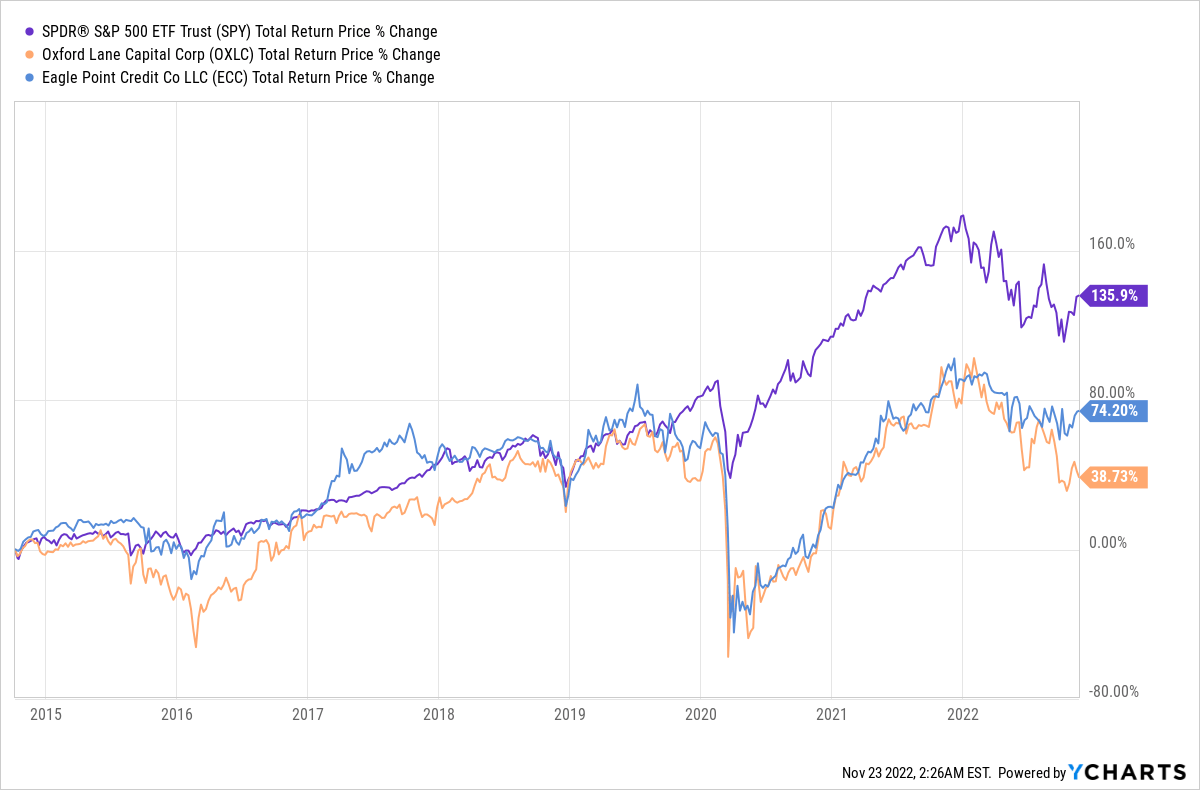
The question now for both OXLC and ECC is whether now is the time to buy into the CLO market and whether these are the right vehicles to do so. Upon addressing these points, we can then start to set a price target for OXLC and a strategy around timing these funds.
What OXLC Does: Explaining CLOs
Collateralized loan obligations are a form of collateralized debt obligation not unlike mortgage-backed securities (MBSs), perhaps the most famous securitized asset thanks to Michael Lewis’s The Big Short.
These are often painted as very complex and hard-to-understand derivatives, and it is absolutely true that a due diligence-heavy in-depth analysis of these derivatives is necessary to price them correctly (failure to do so, as we saw in 2008, leads to very bad things). However, a surface understanding of what they are and how they work is actually not that hard.
Let’s start with a pile of leaves.
Terminix
Everyone has their favorite kind of leaf–green, yellow, orange, black, and they have different reasons for their preference–some want leaves to look at, others to make a fire, others to jump into or walk on to hear that satisfying “crunch” sound. A pile of leaves has enough to satisfy all consumers of different styles and tastes.
That pile of leaves has a value, especially for people seeking out leaves who can’t find them elsewhere. So after raking up the leaves, the gardener can bundle them all together into one bag and choose to sell that bag to someone else who really wants leaves.
But let’s say that I want just the black crunchy leaves. So I tell the gardener I want to buy 5% of the gardener’s bag of leaves, because my in-depth analysis tells me just 5% are the kind I want. I estimate a similar ratio in 20 other bags, and so I buy 5% of those 20 other bags.
If leaves are senior loans in this analogy, CLOs, in this analogy, are the fractional ownership of the bundles of senior loans put together by the banker (gardener). The CLO is giving an investor exposure to 20 different bundles of loans instead of just one, and it is also giving the investor the ability to select what they want within that bundle of loans. Portfolio construction is one of the valuable aspects of the art of the CLO asset manager, and it is something investors pay handsomely for.
Fees and Management
I have not made friends pointing out the obscenely high fees that CLO fund managers charge. These fees remain high in good and bad times, and since the cost of investing in CLOs is high, the costs that involves results in performance erosion.
In April 2020, I took ECC management to task for its massive fees, about 8% of assets under management (“AUM”) on average per year from inception; in 2021, fees rose to 8.75% in 2021. That meant about $28m in costs in 2021 in a year when ECC earned about $131.7m in profit, a gain of about 36%. In one of ECC’s best years ever, massive fees still meant that investors saw profits much lower than the 43.6% pre-fee profits ECC earned in 2021.
OXLC’s fees are worse. With a 10.5% total annual expenses in 2021, OXLC cost investors more despite
OXLC does have a larger portfolio and more AUM (about $900m), but the higher fees on a percentage basis suggest that the firm does not offer economies of scale. Typically, larger funds charge less fees than smaller funds in the same asset class; OXLC is the opposite and should be discounted accordingly.
This is doubly the case when we look at OXLC’s underperformance (see chart above), indicating that it is not a long-term hold and should only be bought at a hefty discount at a time when it is underpriced relative to ECC. That latter part of the equation is crucial; in May 2020, when these funds bottomed out, OXLC still underperformed ECC (albeit by a small margin).
Ycharts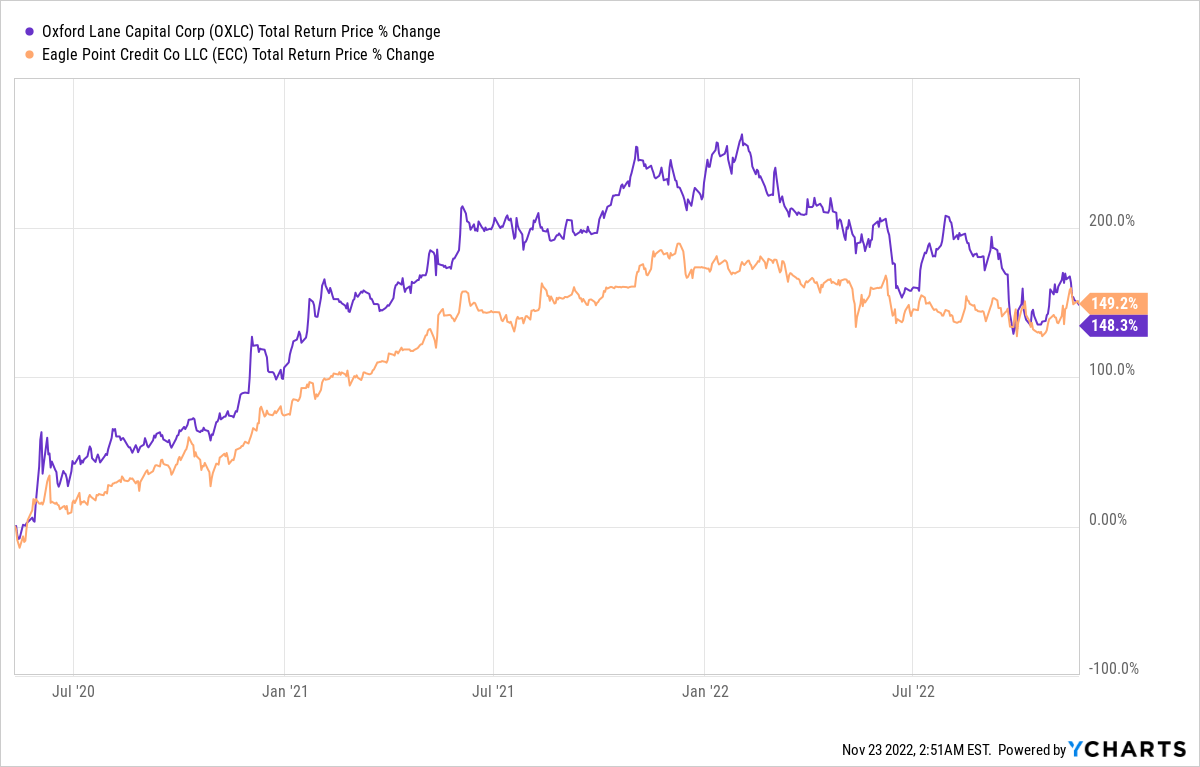
At OXLC’s current NAV of $4.79 at the midway point, OXLC’s 6.7% premium is unacceptable, especially vis-à-vis ECC’s current 9.9% premium; while neither is worth paying given the high fees and crummy performance, surprisingly OXLC is not really a buy when it is heavily discounted, either.
Ycharts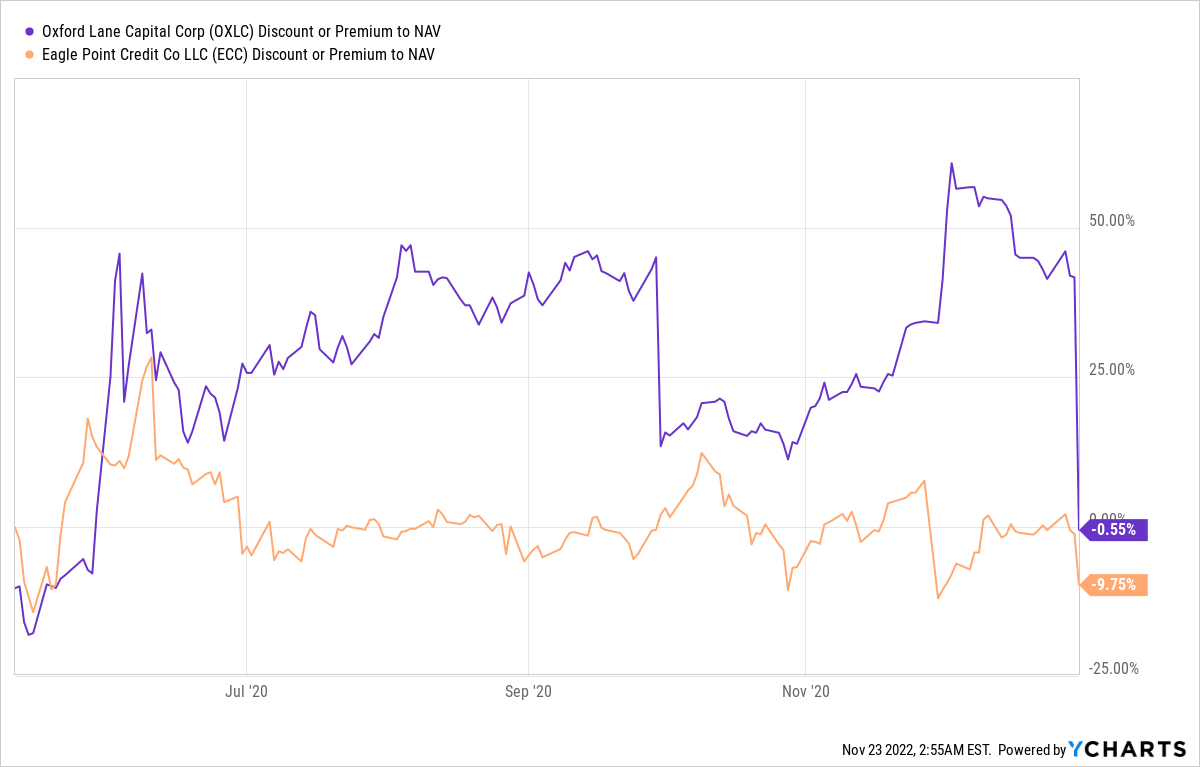
Although OXLC delivered a near-150% return from its pandemic low, when it traded at a 18% discount (ECC was around 15%), ECC’s similar returns at similar levels for lower costs indicate that OXLC needs to be significantly discounted beyond peers to be a relative buy, given the risks of those higher fees eating away at returns over the long haul.
CLOs and Interest Rates
To explain why ECC and OXLC outperformed the market from its lows in 2020, we need to look beyond the discount and fees and towards why CLOs have won so big. And the answer is simple: they were significantly oversold during the initial panic of the pandemic.
Ycharts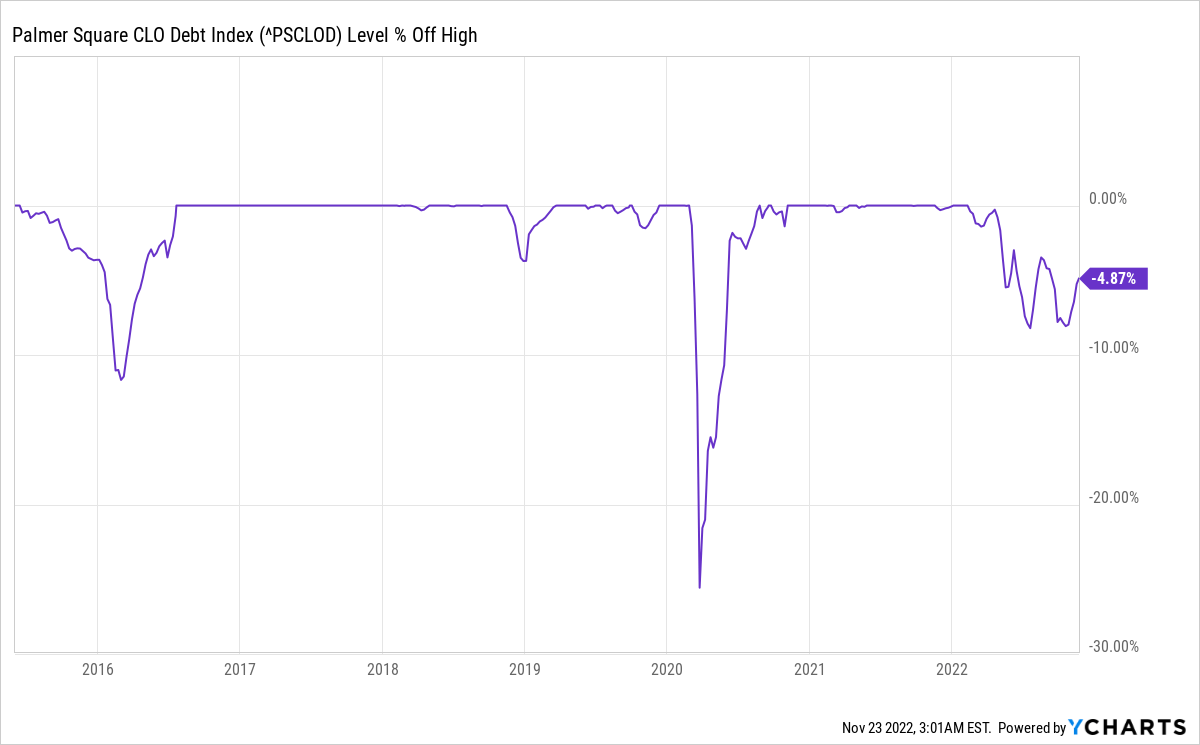
If we look at the CDO world more broadly, we see that it is extremely stable except in times of market panic.
Ycharts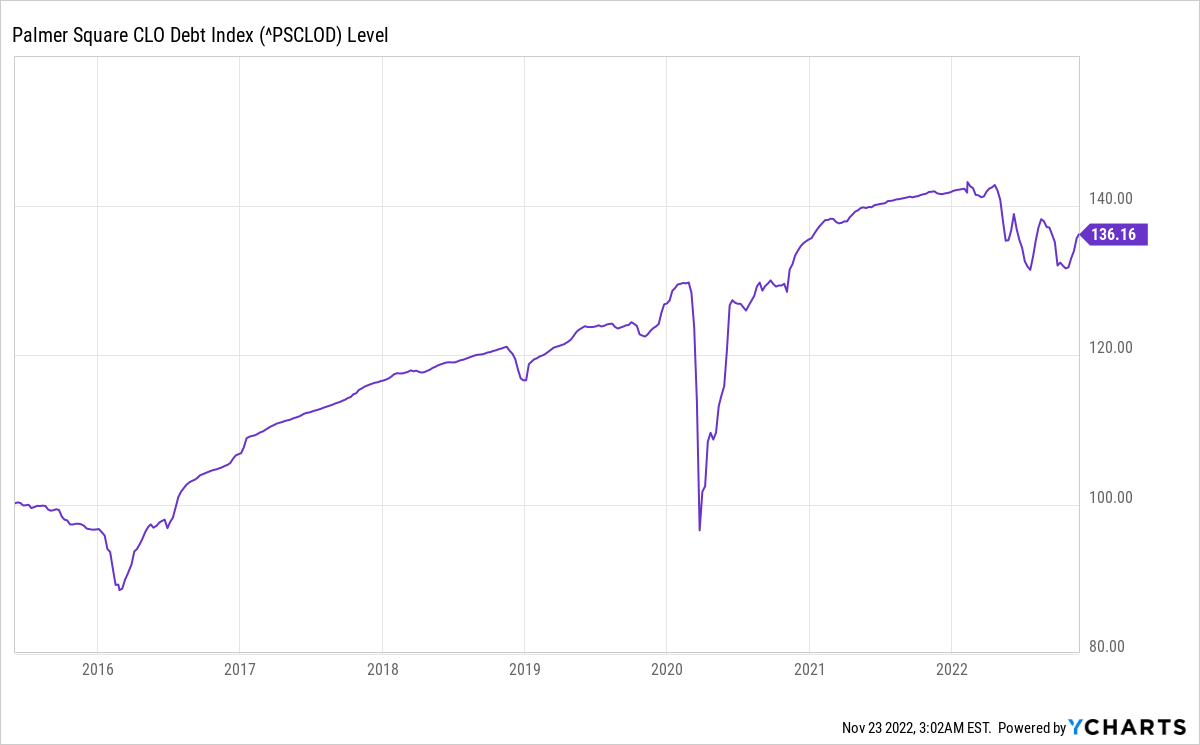
In early 2016, rising interest rates were a devastating blow to CLOs on the logic that investors would move to better performing income yielding alternatives as their yields rose. In 2018, fears of an oncoming recession causing lower creditworthiness (and thus higher default risks) hit CLOs again. But in both times they bounced back quickly – and since neither was anywhere near the devastation of early 2020, there was significantly more upside for contrarians who bought in when they were oversold and bet that they would spring back to normal as quickly as they did.
These three dips are crucial, because they demonstrate a massive and crucial gap between theory and reality. In theory, senior loans should go up in value when interest rates rise; when rates started to rise in early 2016, however, they did not, and performance during that rate-hike cycle does not exceed the performance during the rate-cutting cycle of late 2019 to the present, even if we ignore the big dip in early 2020.
However, OXLC’s performance during the NIRP/ZIRP/QE days of the 2010s indicates that a regime of stable, low rates is very bad for OXLC, despite its dependence on leverage. This also tells us that CLOs do not necessarily benefit from periods of monetary easing, despite the popular myth that QE = easy money = big gains in all sorts of asset classes (if this is true, it does not apply to CLOs).
Ycharts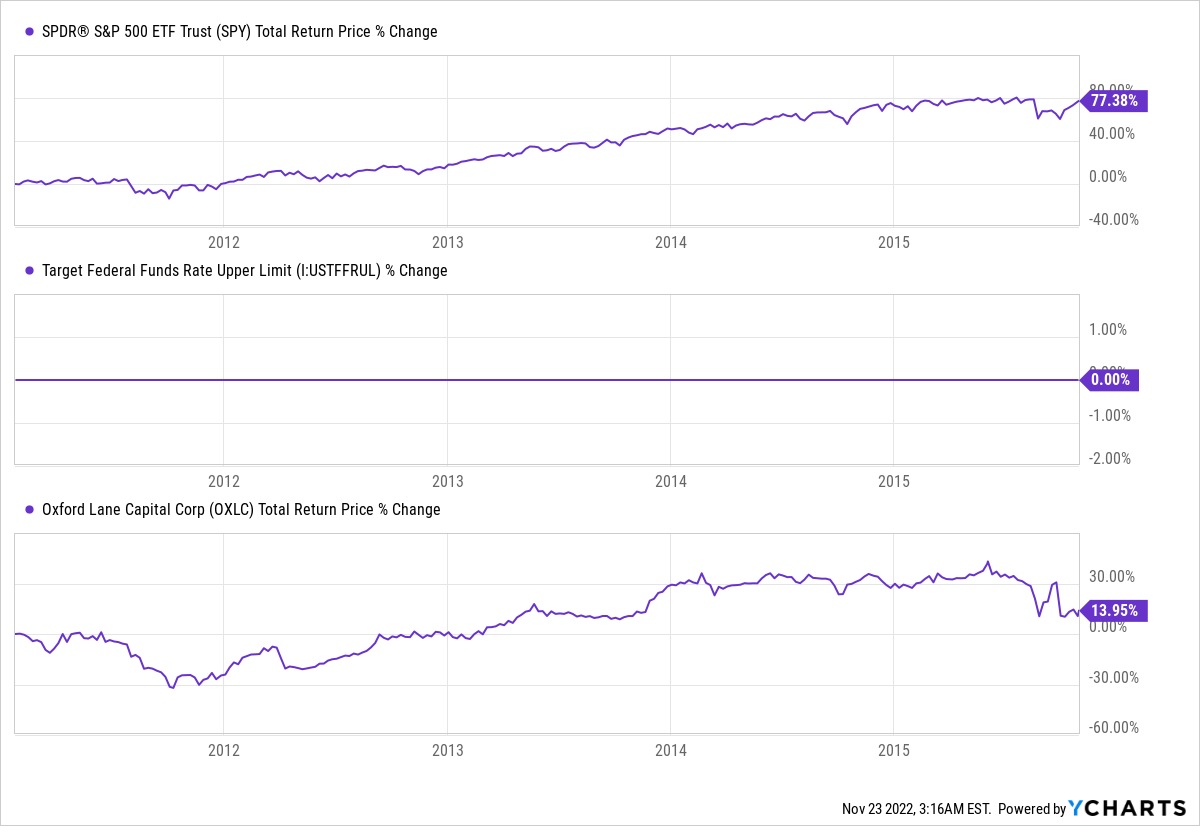
This makes sense, as low rates would also imply low rates for the assets OXLC acquires, providing stable but low returns as it pays its cost of debt and receives others’ cost of debt as income. And while OXLC’s performance improved when rates rose, it still ended up just matching the S&P 500.
Ycharts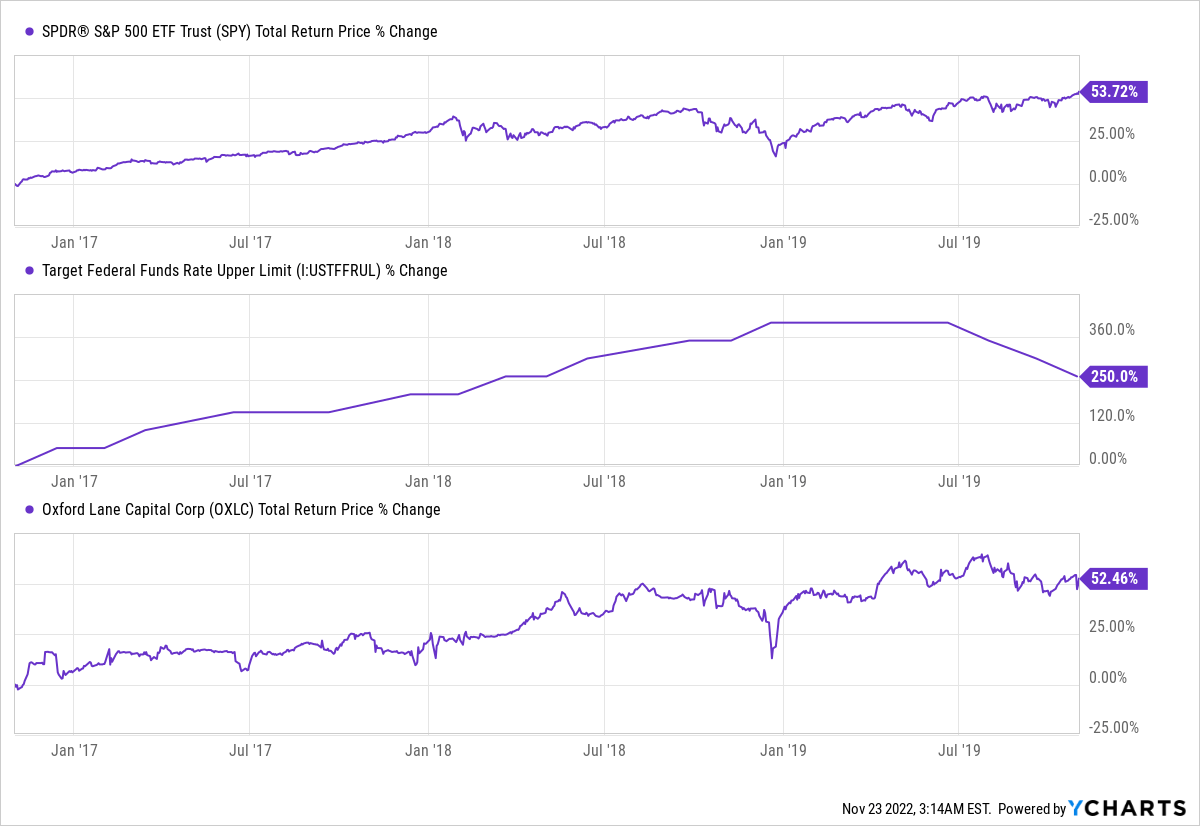
At this point, a simple heuristic becomes apparent, limiting the need to dig too deep into CLO funds:
-
If interest rates are rising and the economy is doing well, CLOs may match the market (so there’s no reason to buy them).
-
If interest rates are falling or the Federal Reserve is easing monetary policy and the economy is broadly seen as doing poorly, CLOs are a good medium-term buy (but expect massive short-term volatility!) when they are heavily discounted and the market is fearful (but OXLC’s discount needs to be significantly larger than ECC’s)
-
If interest rates are falling and the economy is perceived as doing not poorly, CLOs may be impacted in the short term, especially if they are not heavily discounted.
According to this heuristic, we are currently in scenario 2 or 3 given your outlook on the broader economy. But since #2 is our only buy scenario, and since there are many who believe the economy is doing poorly, we can establish a price target for OXLC given its current valuation, past performance, and CLO market appetite on the backdrop of an oncoming currently not fully priced in recession.
OXLC Price Target
If that is one’s market view, OXLC’s massive short-term profits in 2020/2021 could be repeated if a panic selloff causes the fund to be oversold. Obviously, when OXLC is priced at a premium it is not eligible according to this thesis, so we need to buy OXLC only at a discount–and a steep one.
Ycharts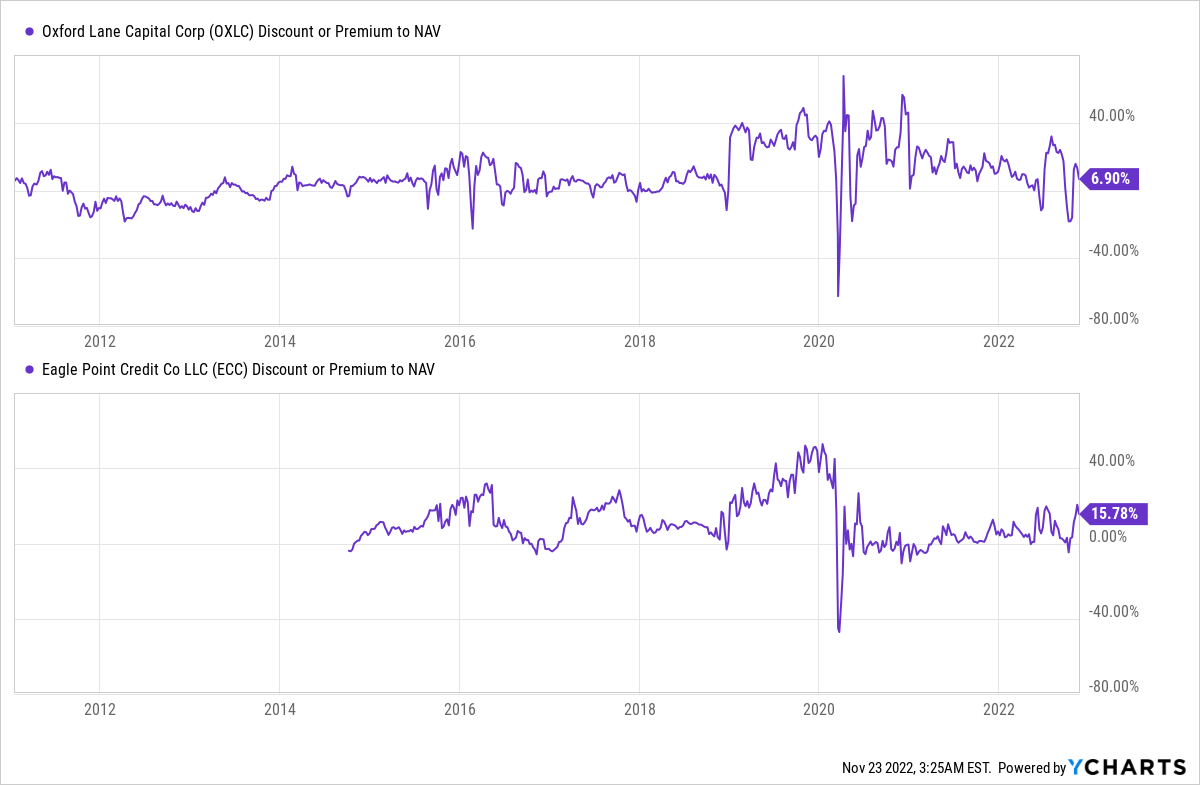
Throughout their histories, OXLC and ECC have traded mostly at premiums in recent years; in the early 2010s, OXLC saw a discount from late 2011 until May 2013, and holding during this period resulted in a significant outperformance despite the market’s very strong showing over this period.
Ycharts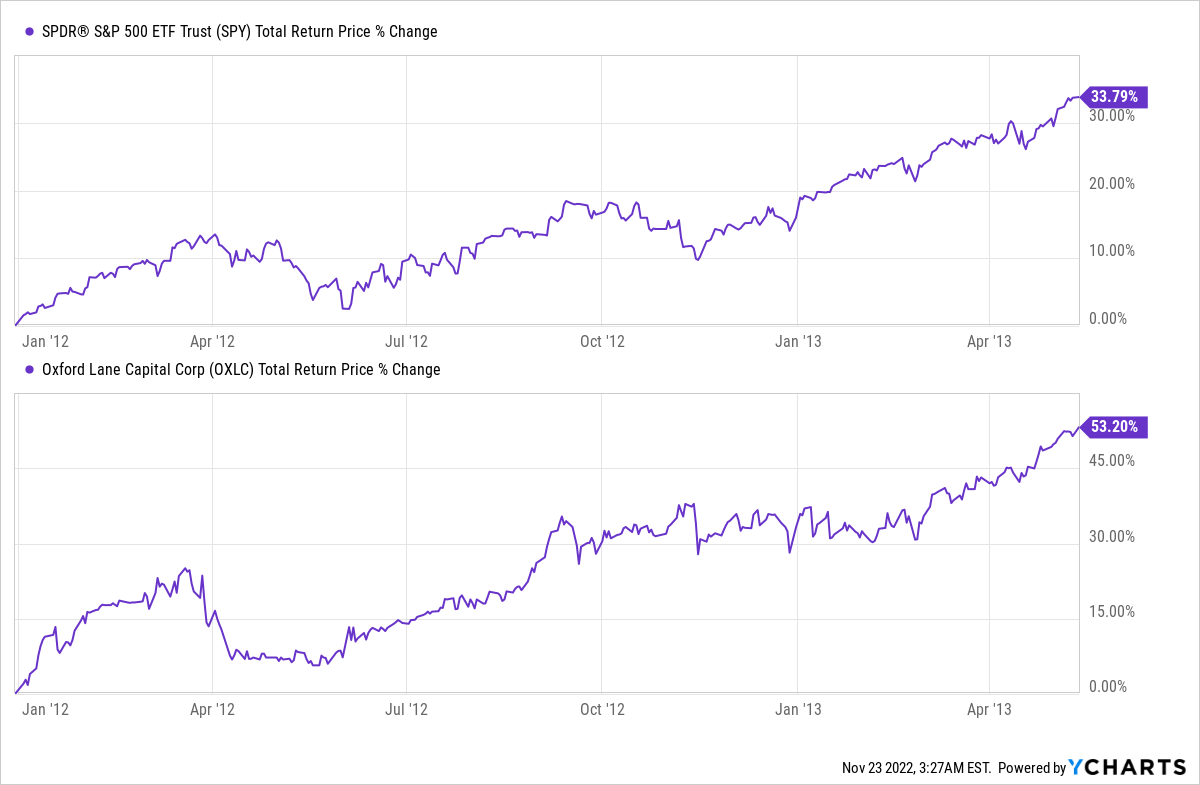
It should be noted, this outperformance was really thanks to new rounds of QE that squelched fears of another Great Recession, and that OXLC’s strong showing really only began when that round of QE began. Extremely low economic expectations in late 2011 (if you are old enough to remember, this is when America lost its AAA debt rating and flirted with defaulting on its debt and the European Union was on the brink of a civil war due to the sovereign debt crisis) and an aggressive Fed meant a setup similar to #2 above, so it is no surprise that OXLC did well.
We cannot compare ECC as it didn’t exist at the time, but it’s worth noting OXLC’s discount of 12% in December 2011 (and 18% in April 2012) would not repeat again until 2020.
Our price target for OXLC needs to be variable, however, and based on current NAV rather than future cash flows and established within the context of broader market attitudes, which, as we all know, have not been great lately.
However, they are significantly improving. The CNN Fear & Greed index indicates that fears of an incoming recession are fading at least in the short term.
CNN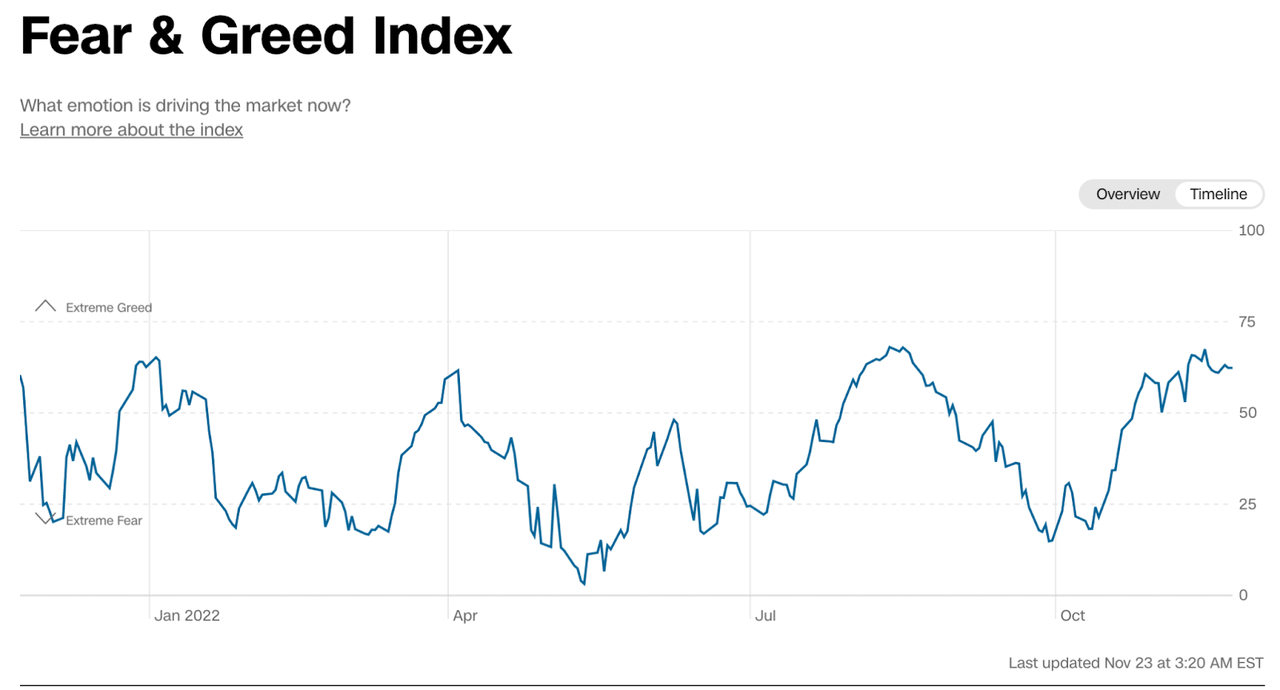
We’re also seeing market capitulation among Wall Street. Current expectations of near-zero GDP growth for 4Q22 are significantly below the Atlanta Fed’s GDPNow estimate, indicating rock-bottom expectations of the last few weeks are likely to be revised upwards towards more optimism for growth:
Atlanta Federal Reserve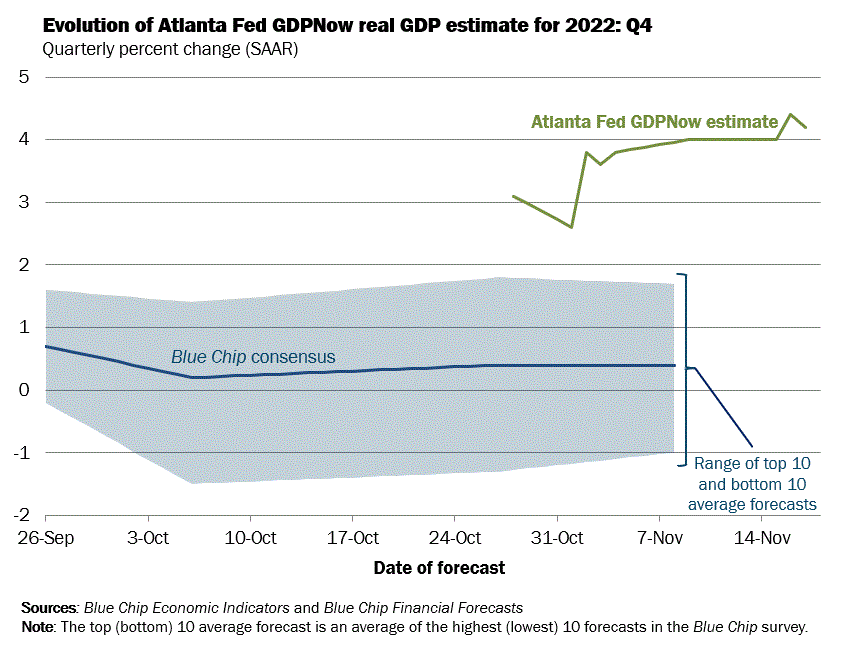
If these trends continue, we will continue to slide away from Scenario #2 above to Scenario #3, making CLOs uninvestable. If they reverse, however, we would need to see OXLC hit a discount to NAV of 15% before it becomes a buy on the assumption that ECC hits a discount of no more than 10% at the same time; in those conditions, however, ECC could be a buy if its discount exceeds OXLC’s by less than 500bps and if both see a dip in their pricing to a discount.
That would suggest OXLC is a buy up to $4.35 as long as ECC does not fall to below $8.74 at their current NAV levels, and neither is a buy until then.
Be the first to comment