

undefined undefined
Thesis
Now is a challenging time for investors, especially if you are exposed to the tech sector. To wit, the Invesco QQQ ETF (NASDAQ:QQQ) has lost 19.5% YTD. And it is about 29% off its peak level, borderlining on a technical recession. Its 3x leverage fund, the ProShares UltraPro QQQ ETF (NASDAQ:TQQQ), has lost 59.5% YTD. And a 59.5% decline requires a 247% rally to break even. As mentioned in our newly launched market service, at times like this, it is especially important to stay disciplined and stay with simple and proven methods that you truly understand.
The thesis of this article is twofold. First, it will analyze the differences between TQQQ and QQQ, so investors can pick the right one to gain exposure to the tech sector tailored to their own risk profile. And second, it will demonstrate how we pursue aggressive growth in our real-money portfolio using TQQQ. We feel to urge our readers at times such as this to use a systematic method, especially with leverage funds such as TQQQ. Based on decades of our own investment experiences, a disciplined way is the best mechanism to help you manage the risks, both downside and upside risks, amid turbulent times. We will show an algorithm to adjust leverage adaptatively based on market volatility that has generated reliable alpha in the long term for us. Hope it can help you take the excitement or fear out of your investment decisions and put in consistent profit instead.
Source: Seeking Alpha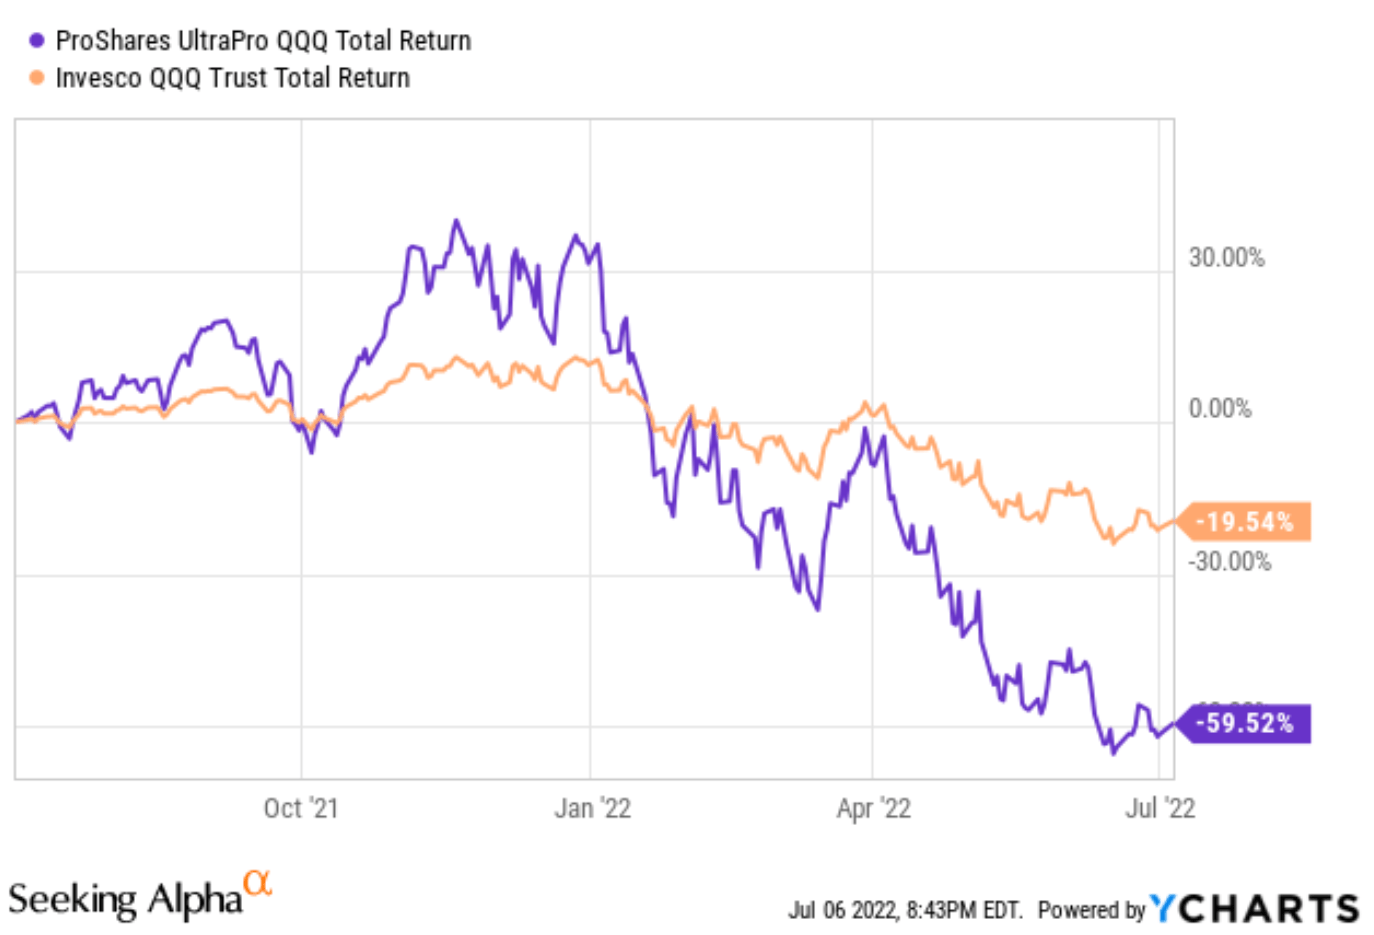
Basic information
These two funds probably need little introduction. They are popular funds for investors to gain exposure to the tech sector. QQQ, with an AUM of $153B, is one of the largest and most actively traded ETFs based on the NASDAQ 100 index. TQQQ is smaller with an AUM of $10.9B. However, it is the largest and most traded leveraged ETF that I can find.
You will notice that QQQ charges a much lower expense ratio of 0.2%, compared to TQQQ’s 0.95%. So the first thing you should consider is if your investment method can generate enough alpha to overcome the fee hurdle (more on this later).
Besides the fee hurdle (which is the most obvious factor), there are a few other less obvious but also important factors to consider, as detailed next immediately.
Source: ETF.com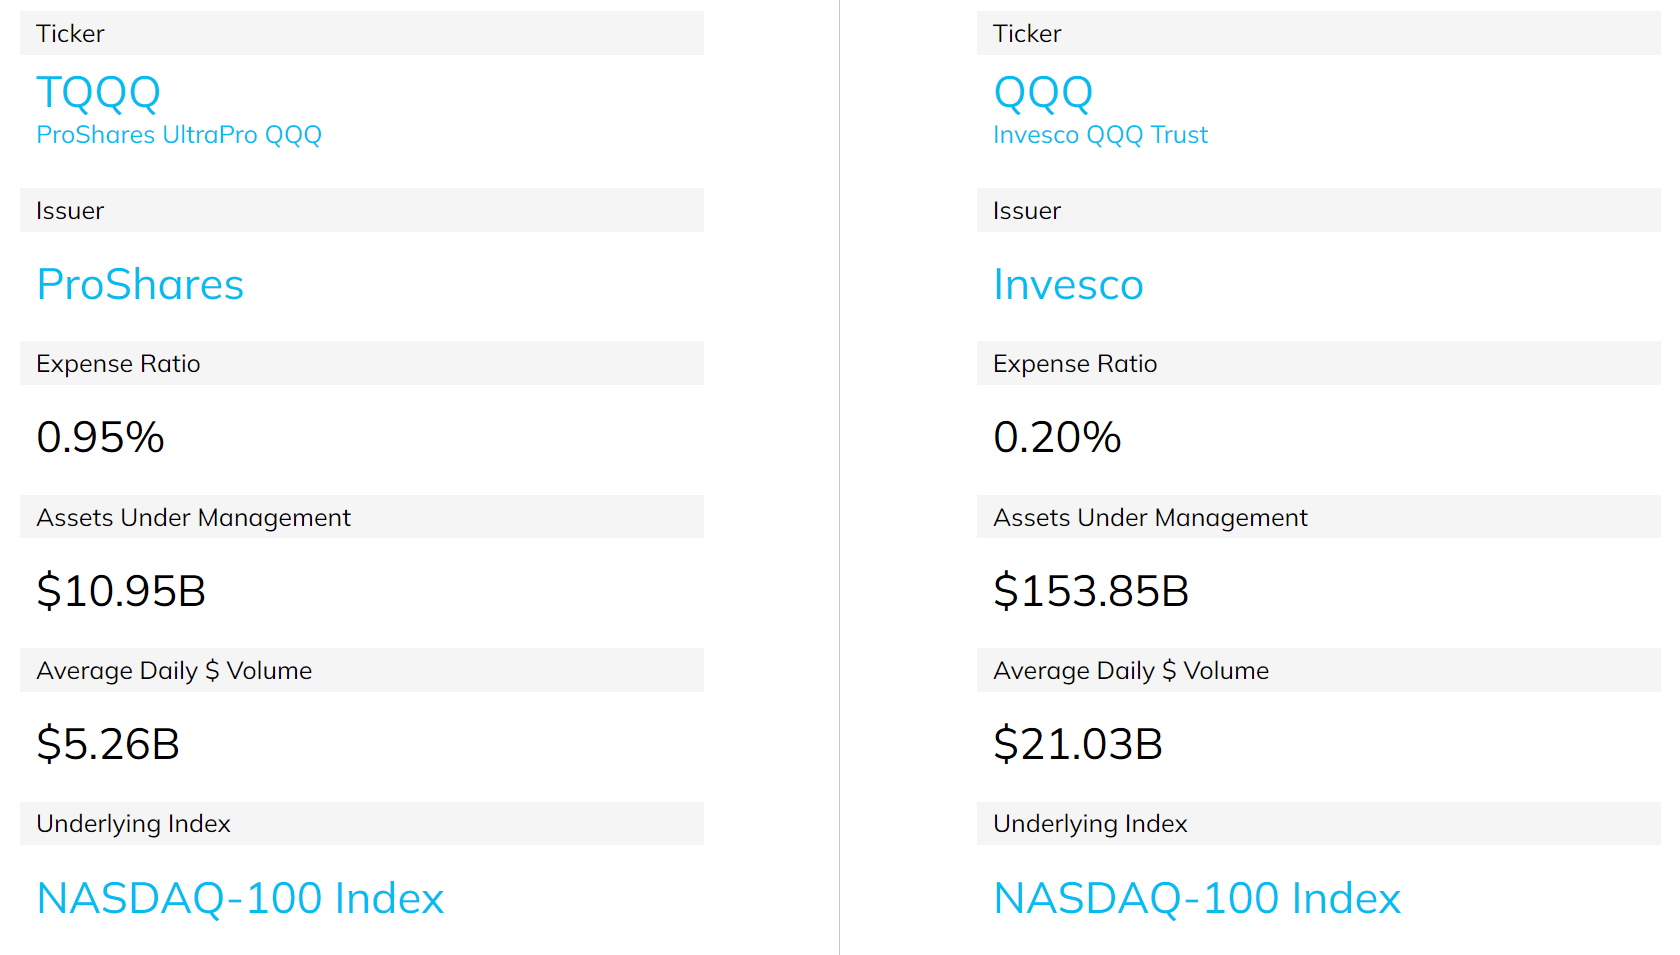
TQQQ, QQQ, and volatility decay
Besides the fee, the other most important aspect in the use of TQQQ to me involves the volatility decay, as pointed out by the fund description itself as an important consideration:
This leveraged ProShares ETF seeks a return that is 3x the return of its underlying benchmark (target) for a single day, as measured from one NAV calculation to the next.
Due to the compounding of daily returns, holding periods of greater than one day can result in returns that are significantly different than the target return, and ProShares’ returns over periods other than one day will likely differ in amount and possibly direction from the target return for the same period. These effects may be more pronounced in funds with larger or inverse multiples and in funds with volatile benchmarks.
The operative word is that its 3x tracking is only on a single-day basis (and the highlights above were in the original quote). For readers new to the concept of volatility decay, a simple example will illustrate the essential points immediately.
First, all securities suffer volatility including the “unleveraged” funds such as QQQ. I put “unleveraged” in quotation marks because an unleveraged fund is really a fund with a leverage ratio of 1x. Suppose the price of QQQ goes up 2% on day 1 and goes down 2% on day 2. At the end of day 2, QQQ’s price would NOT return to its original price. It would go down by 0.04%. It is purely math – because (1+2%)*(1-2%) is less than 1 by 0.04%. And 0.04% is the volatility decay.
Second, leverage ETFs suffer volatility decay more severely. Following the above example, the 3x leveraged TQQQ would go up 6% on day 1 and go down 6% on day 2. As a result, its price at the end of day 2 would be 0.36% lower than its original price. Because (1+6%)*(1-6%) is less than 1 by 0.36%. Now that 0.36% is not only larger than 0.04%, it is larger by 9x, not 3x.
And chart 1 above provides a real-time example of such more pronounced volatility decay in action. Recall that QQQ has lost 19.5% YTD and TQQQ has lost 59.5% YTD. You can see that 59.5% is more than 3x of 19.5% because of the volatility decay during a choppy market (together with the fee hurdle mentioned above).
Volatility boost
Now you must begin to wonder, then why on earth would I ever want to consider TQQQ?
The reason is that volatility works both ways in a fair way (math is fair after all). In a range-bound or a declining market, volatility will cause decay. But in a market that enjoys a one-way rally, volatility will provide a boost. You can use a simple hypothetical example similar to those used above to verify this.
Here I will use the chart below to show a real example during the past five years (2017 Jan to 2021 Dec) before the market went through its recent correction. As you can see from this chart, QQQ went up 248.7% during this period, and TQQQ went up more than 1470%. You can see that TQQQ went up more than 3x than QQQ even without a calculator – thanks to the volatility boost.
By this time, it should have become clear that the trick with using leverage ETF is all about striking an optimal balance between controlling the risk of volatility decay and reaping the benefits of volatility boost. And we will discuss our method immediately below.
Seeking Alpha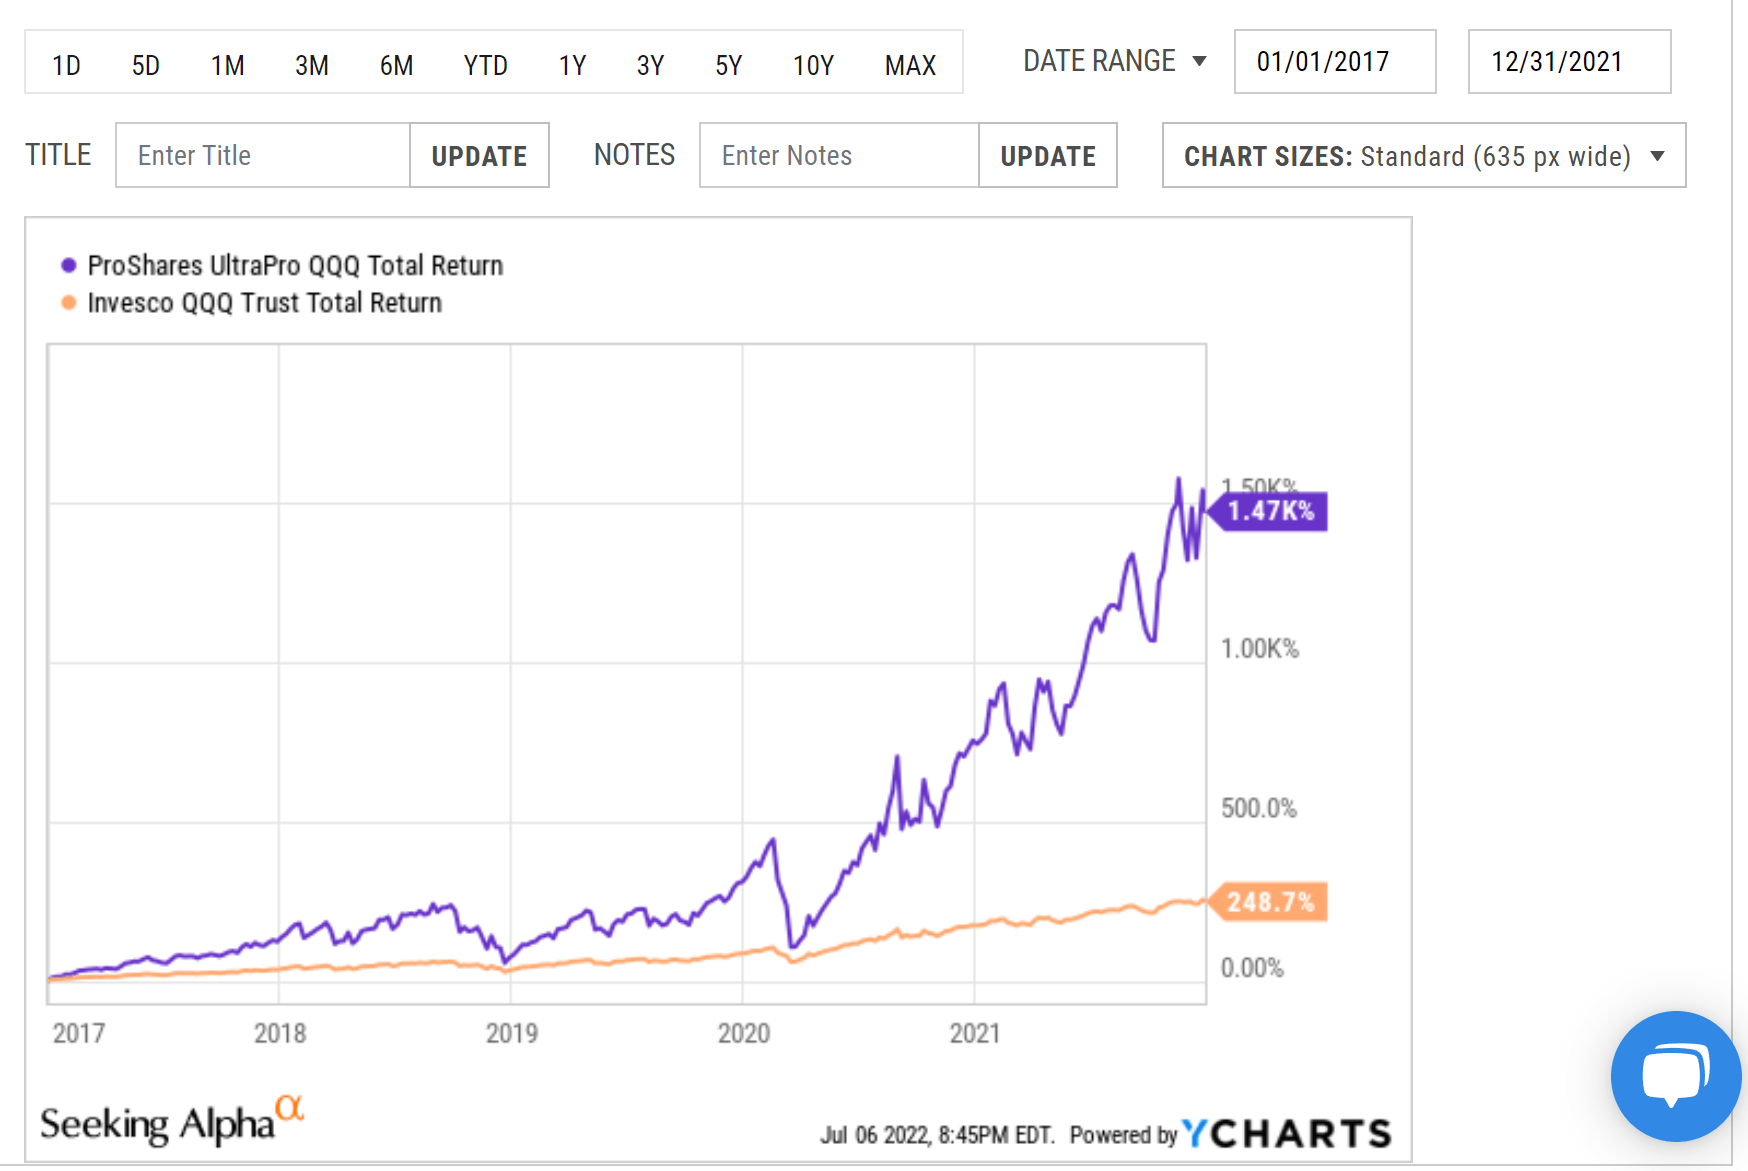
How to use QQQ and TQQQ in a disciplined way?
To strike that optimal balance, we adjust leverage dynamically based on market volatility. The concept is explained in the paper by Tony Cooper and the key is:
It is difficult to predict stock market returns but relatively easy to predict market volatility. But volatility predictions do not easily translate into return predictions since the two are largely uncorrelated. We put forward a framework that produces a formula in which returns become a function of volatility and therefore become somewhat more predictable. We show that this strategy produces excess returns giving us the upside of leverage without the downside.
The key results from Cooper’s paper are shown in the Figure below. It shows 135 years’ worth of daily US index prices going all the way back to when stock index data were available in the US market. The orange circles show leverage factors of 1x (e.g., QQQ), 2x, and 3 (e.g., TQQQ). As you can clearly see, the annualized return first rises when the leverage is increased beyond 1x. For instance, raising the leverage to 2x would result in a roughly 5% average yearly return (and 1% alpha compounded over 50 years, the typical investment timeframe for most retirement accounts, is a lot). But you can’t go overboard because performance will start to suffer if the leverage is increased more. For example, 3x leverage will drag the performance below 4%. This figure clearly shows the need to strike an optimal balance.
Of course, these results do not mean that you could not use a 3x leveraged fund. The leverage ratio shown in the following chart is the effective leverage ratio for the entire portfolio. So in practice, you can use a 3x leverage fund such as TQQQ. You just need to control its location so that the effective leverage for your entire portfolio is below 3x. And as to be detailed next, we actually cap our leverage to 1.25x in our portfolio (which is already sufficient to generate the aggressive growth we need as you can see in the 2nd chart).
Source: Alpha Generation and Risk Smoothing using Managed Volatility by Tony Cooper. Source: author.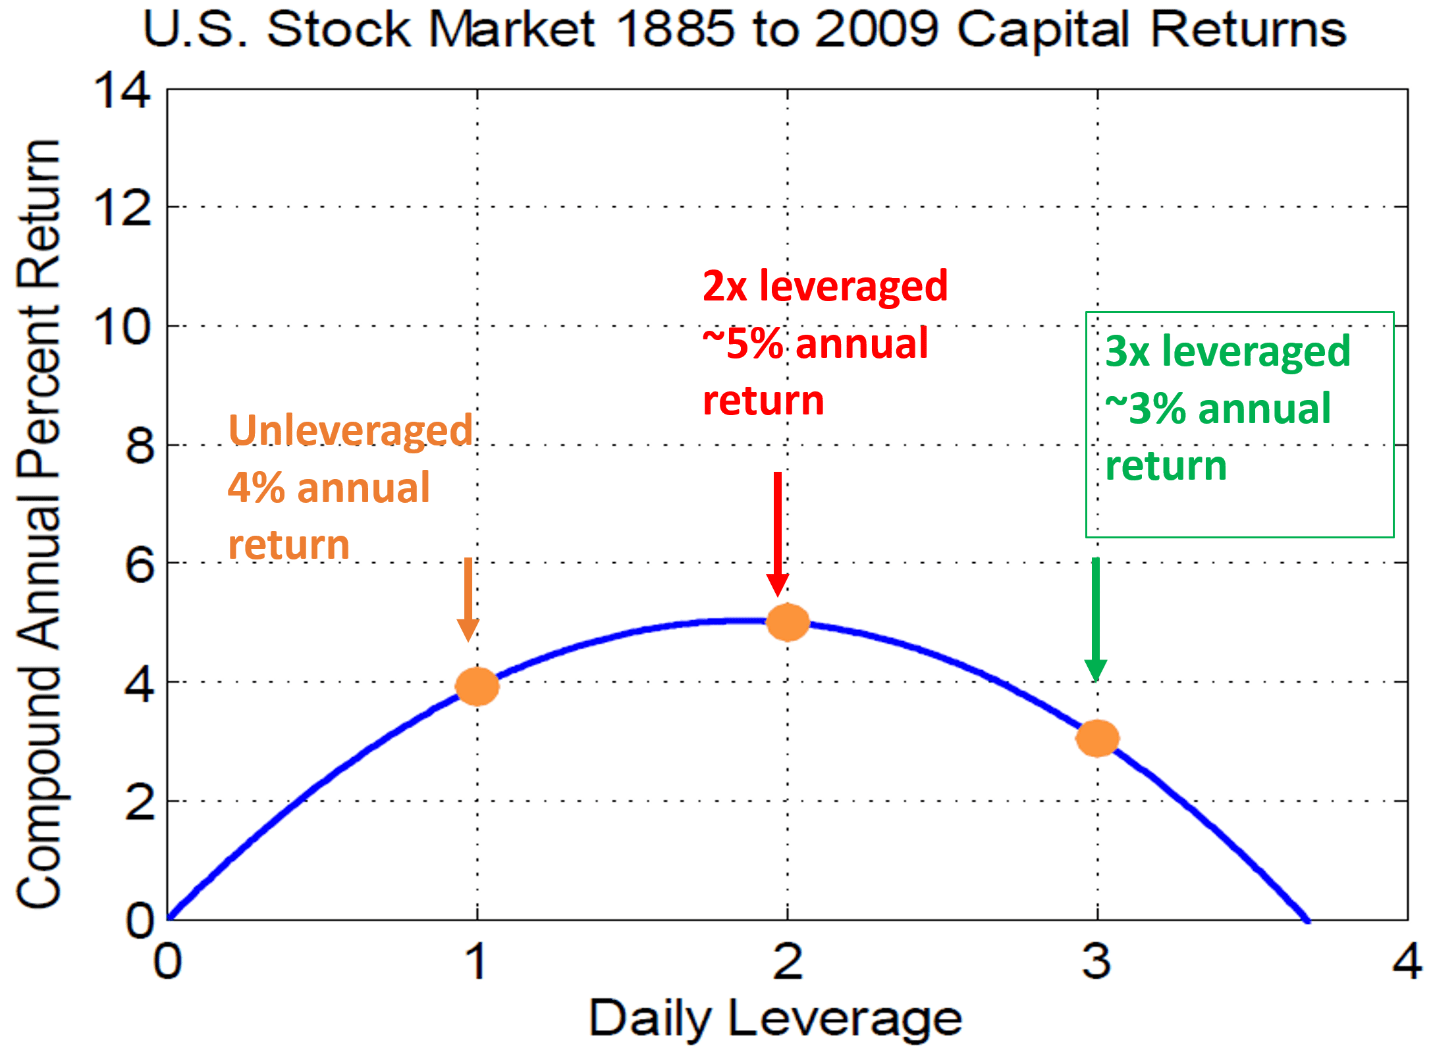
Our aggressive growth portfolio
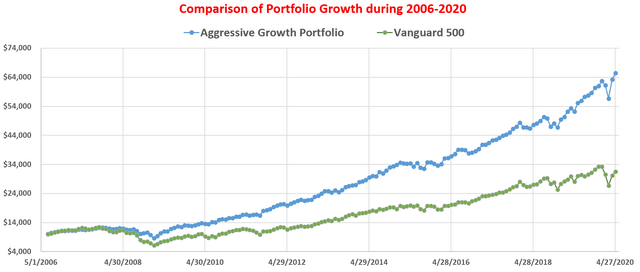
We have been implementing the above strategy in our real-money account for more than a decade (and the long-term results are shown above). Many details of our implementation are different from Cooper’s original methods and these differences are elaborated in our earlier article. A few key points are summarized here to facilitate reference:
- Our key allocation curve for TQQQ is shown in the chart below. We use the VIX index to measure the volatility of the market and adjust our leverage. We leverage less when VIX increases and more when the VIX decreases according to the blue curve.
- For the use of a 3x leverage fund such as TQQQ, we also cap my maximum leverage at 25% as shown by the green line.
- More specifically, the blueline follows a 1.5th power-law relationship in the form of Leverage ~ 16/VIX^1.5. So that when VIX = 16, the leverage is 25%, i.e., the maximum is reached and 25% of our equity exposure will be leveraged. The central idea is to adjust leverage by A/VIX^B. We tailor (and you should too) A and B considering the different leverages provided by the given fund and also the sensitivity you desire.
Source: author.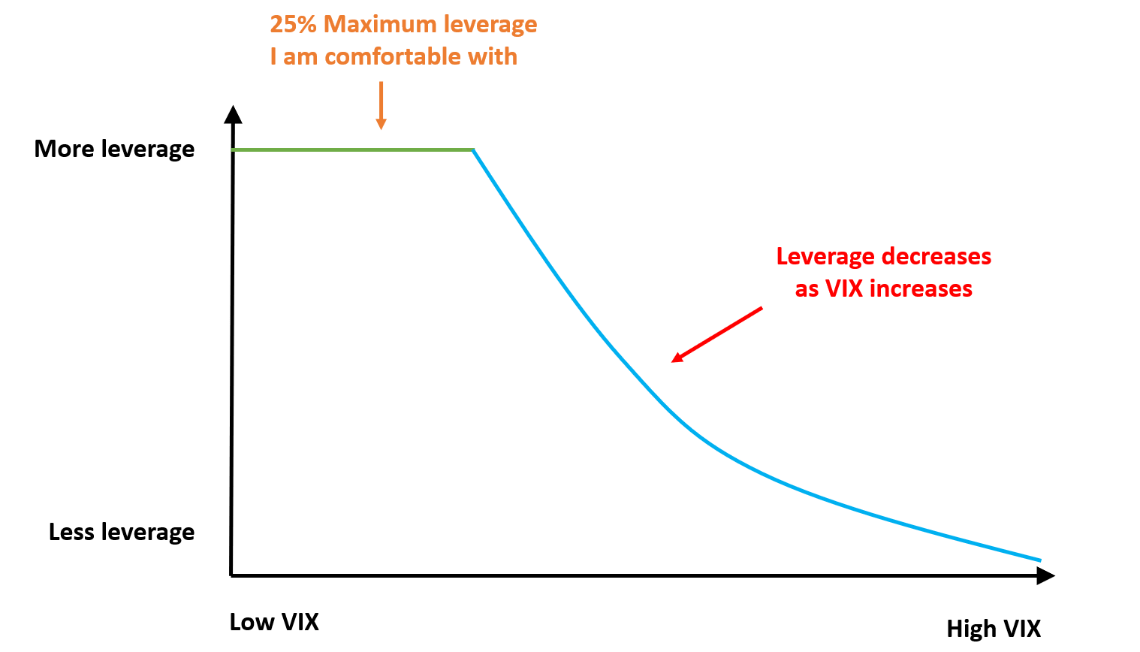
Our leveraged aggressive growth portfolio (“AGP”)
Now, let’s see the details of our aggressive growth portfolio. Our free blog article here provides more details about the AGP. The first chart below provides a snapshot of our detailed holdings for July. We perform our adjustment at the end of each month and update our readers of the allocations for the next month immediately. As you can see from the second chart below, as of our last account adjustment, the overall market lost about 17.0% since Feb 1 after adjusting for dividends. And our AGP lost about 14.6% again after adjusting for dividends, resulting in a relative lead of about 2.4% this month.
Note that even though we have been holding this portfolio for more than a decade, we are using Feb 1, 2022, as the starting date for performance tracking of our marketplace service since this is the day our service is launched. The goal is to provide verifiable and transparent performance tracking for our readers.
Source: author. Source: author.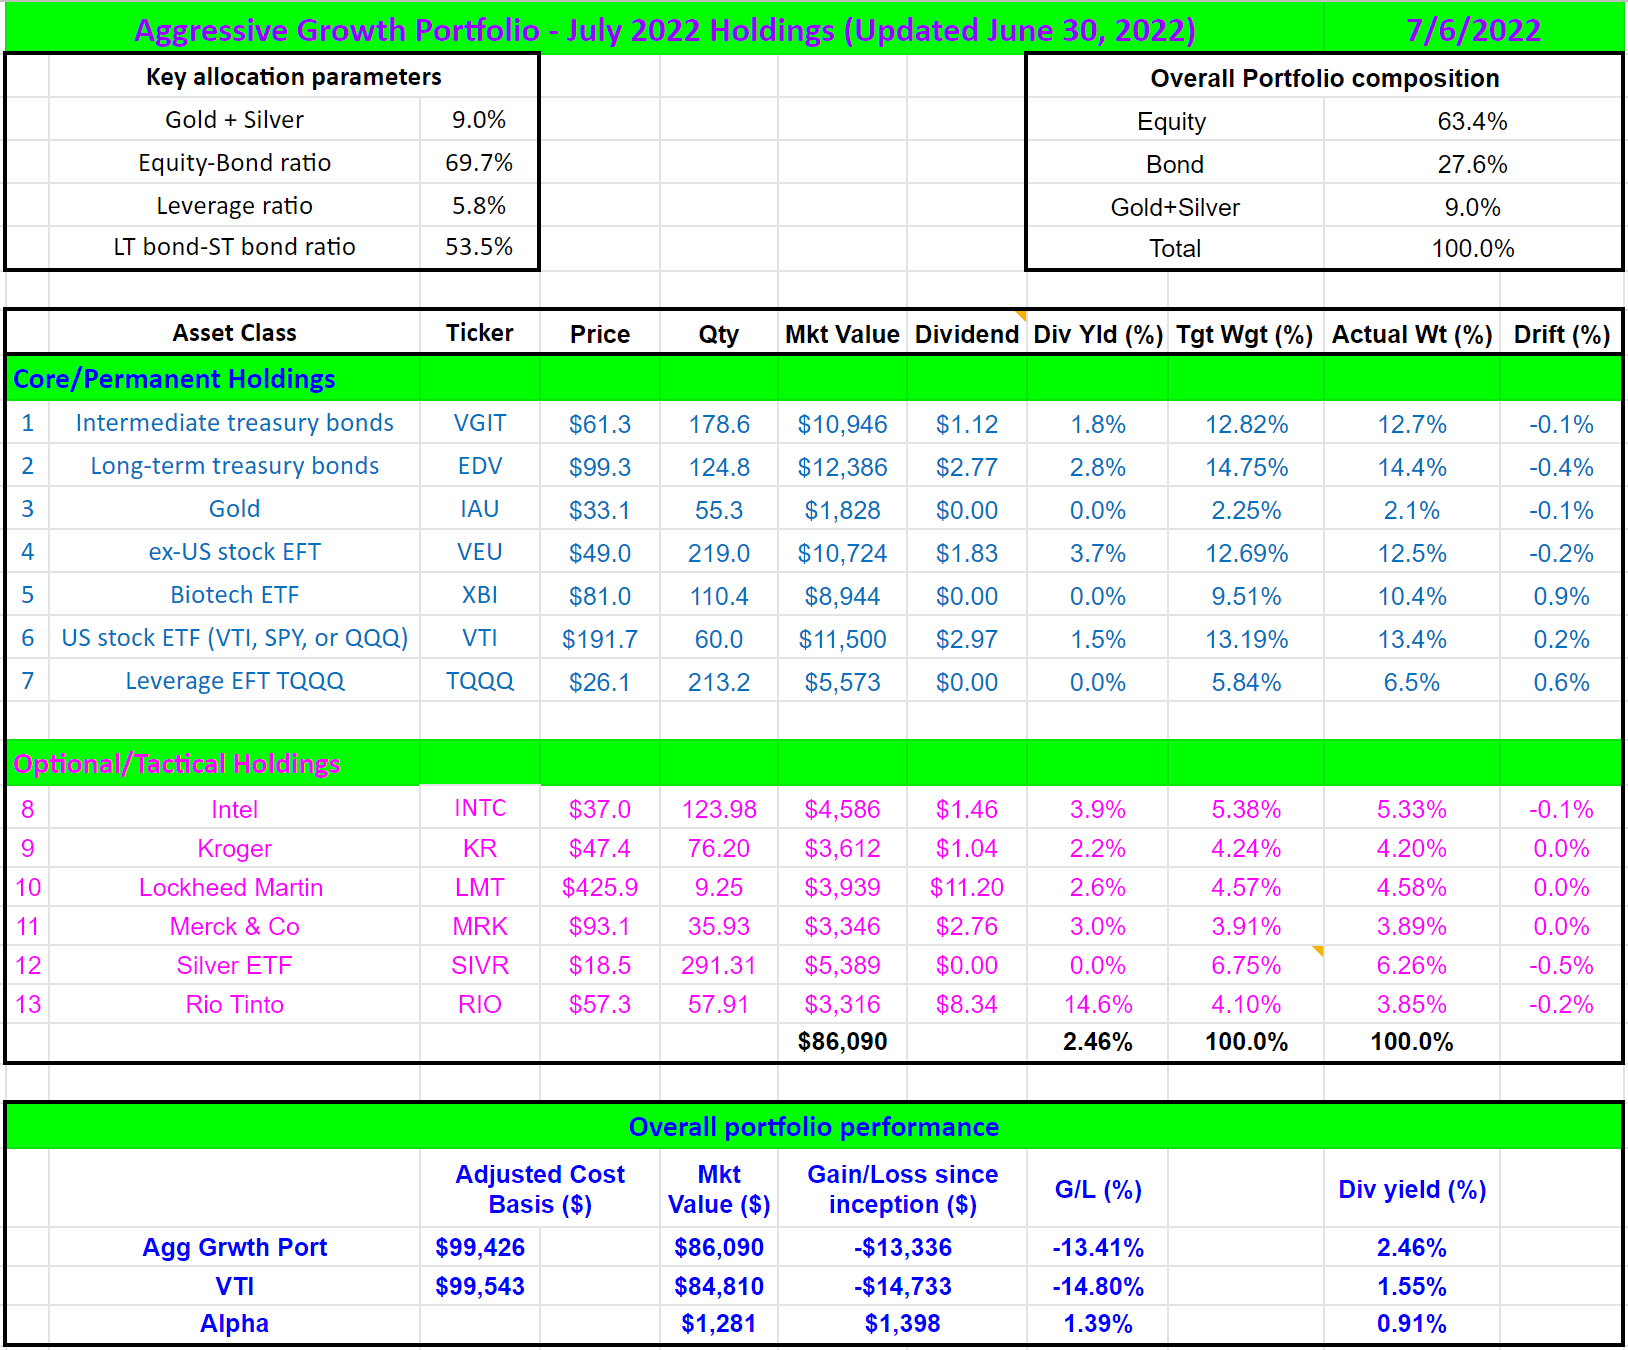
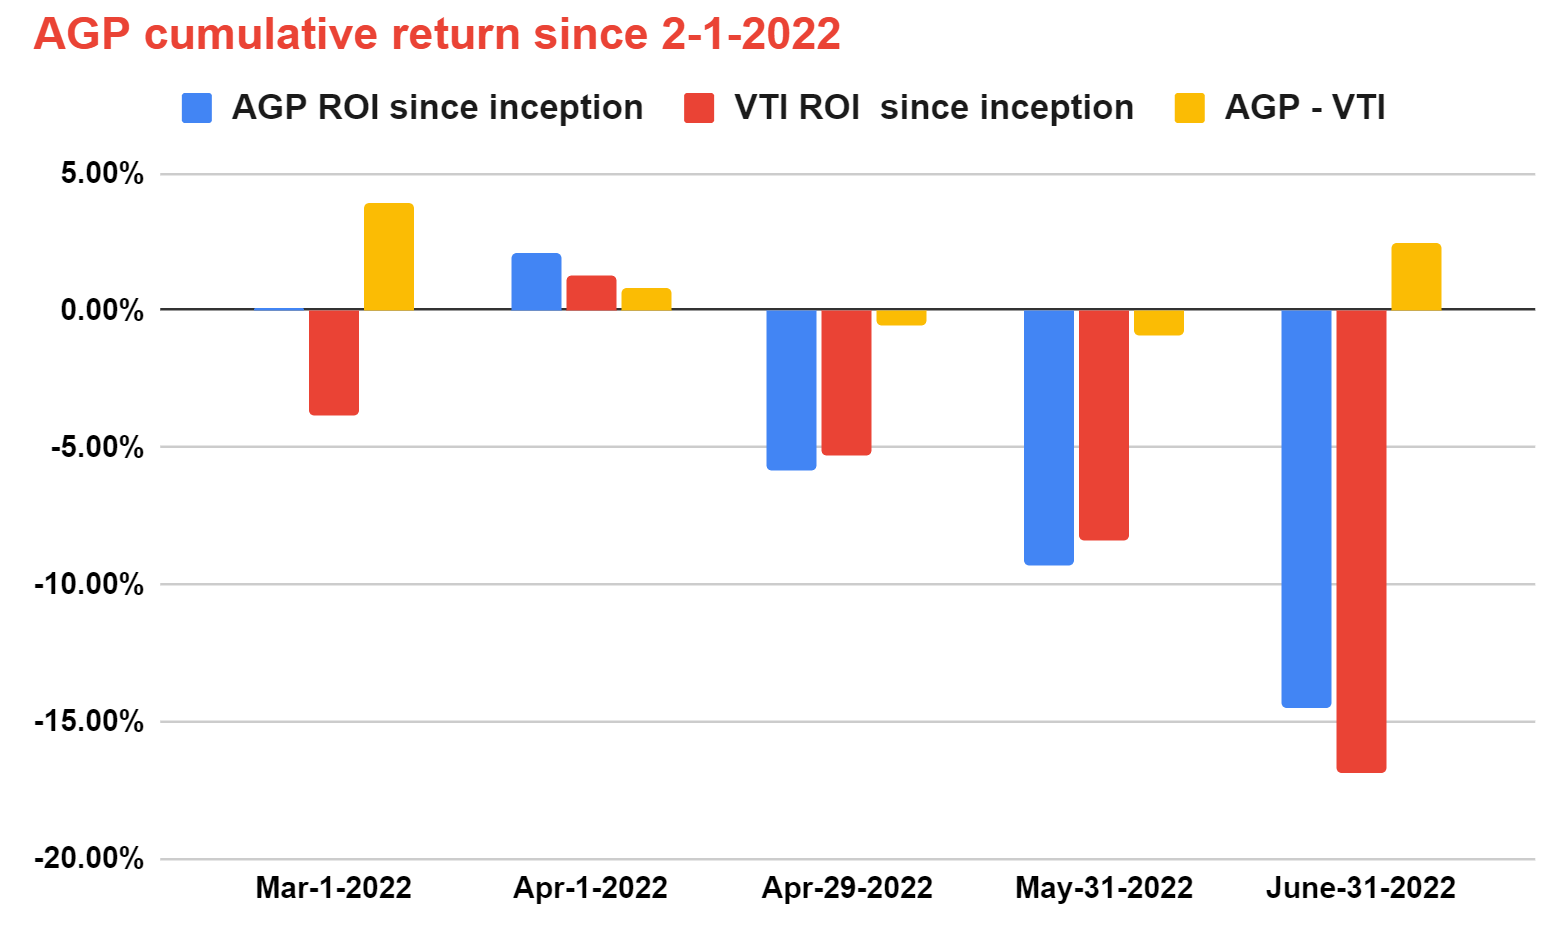
Here I want to draw your attention to the use of TQQQ in our portfolio. In our March adjustment, we wrote to our readers that we substantially decreased our leverage. As you can see from the following chart, we’ve decreased the allocation of TQQQ from 8.3% in March to 5.0% now due to the higher volatilities following the allocation curve shown above. The VIX index was about 30 at the time of our adjustment (about 90% percentile historically), compared to about 20 back in March (about 65% percentile historically).
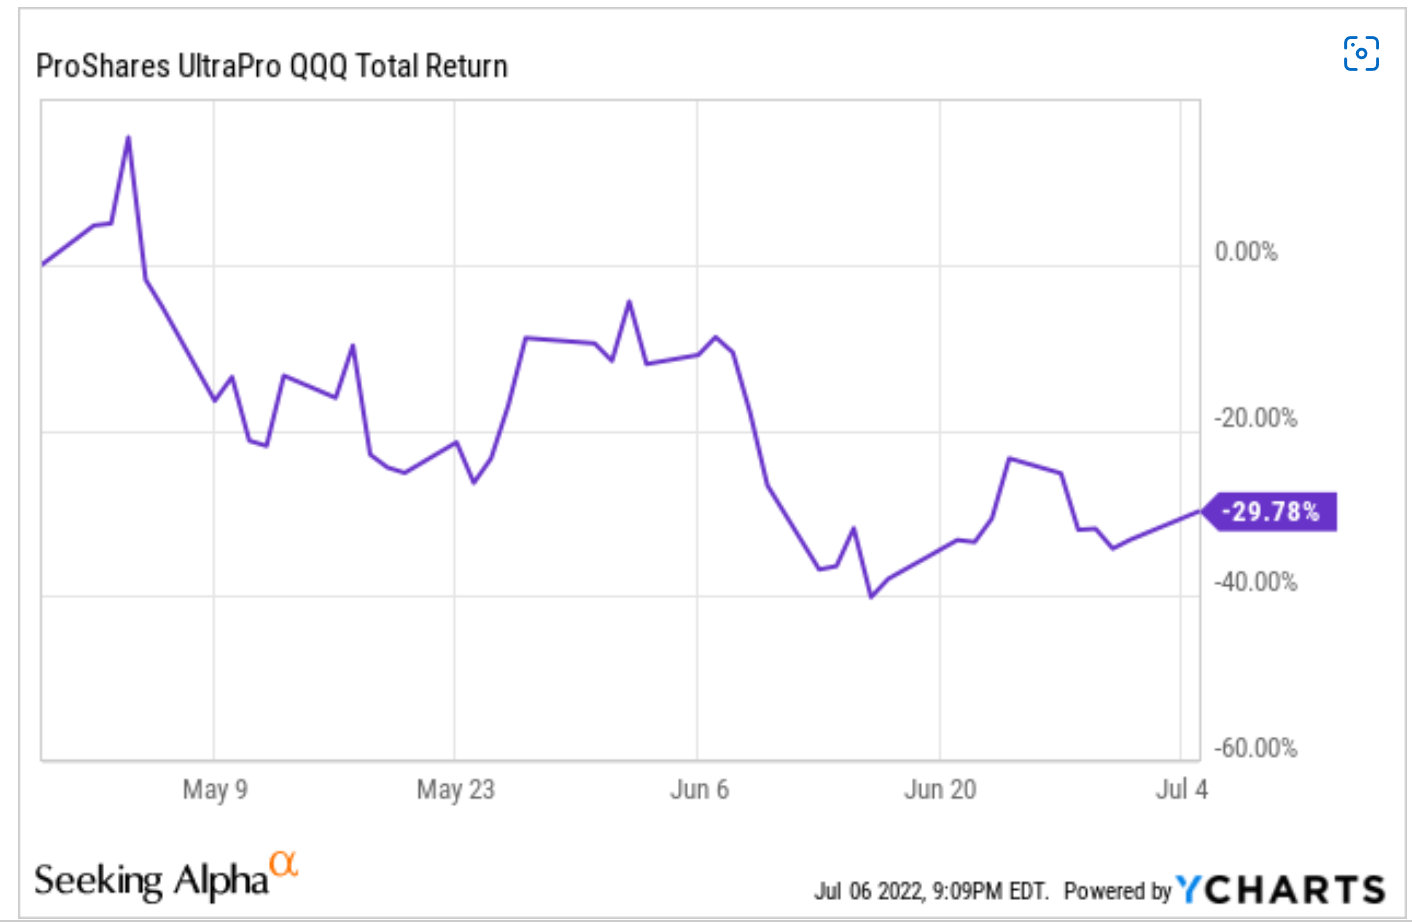
And the chart below shows the price action of TQQQ after that decrease. As you can see, the TQQQ price plunged by as much as 40% since we reduced our exposure, and is still 29.7% below as of this writing. I hope this recent example from our real account illustrates the importance of sticking to a disciplined approach, especially during turbulent times.
Source: author. Source: author.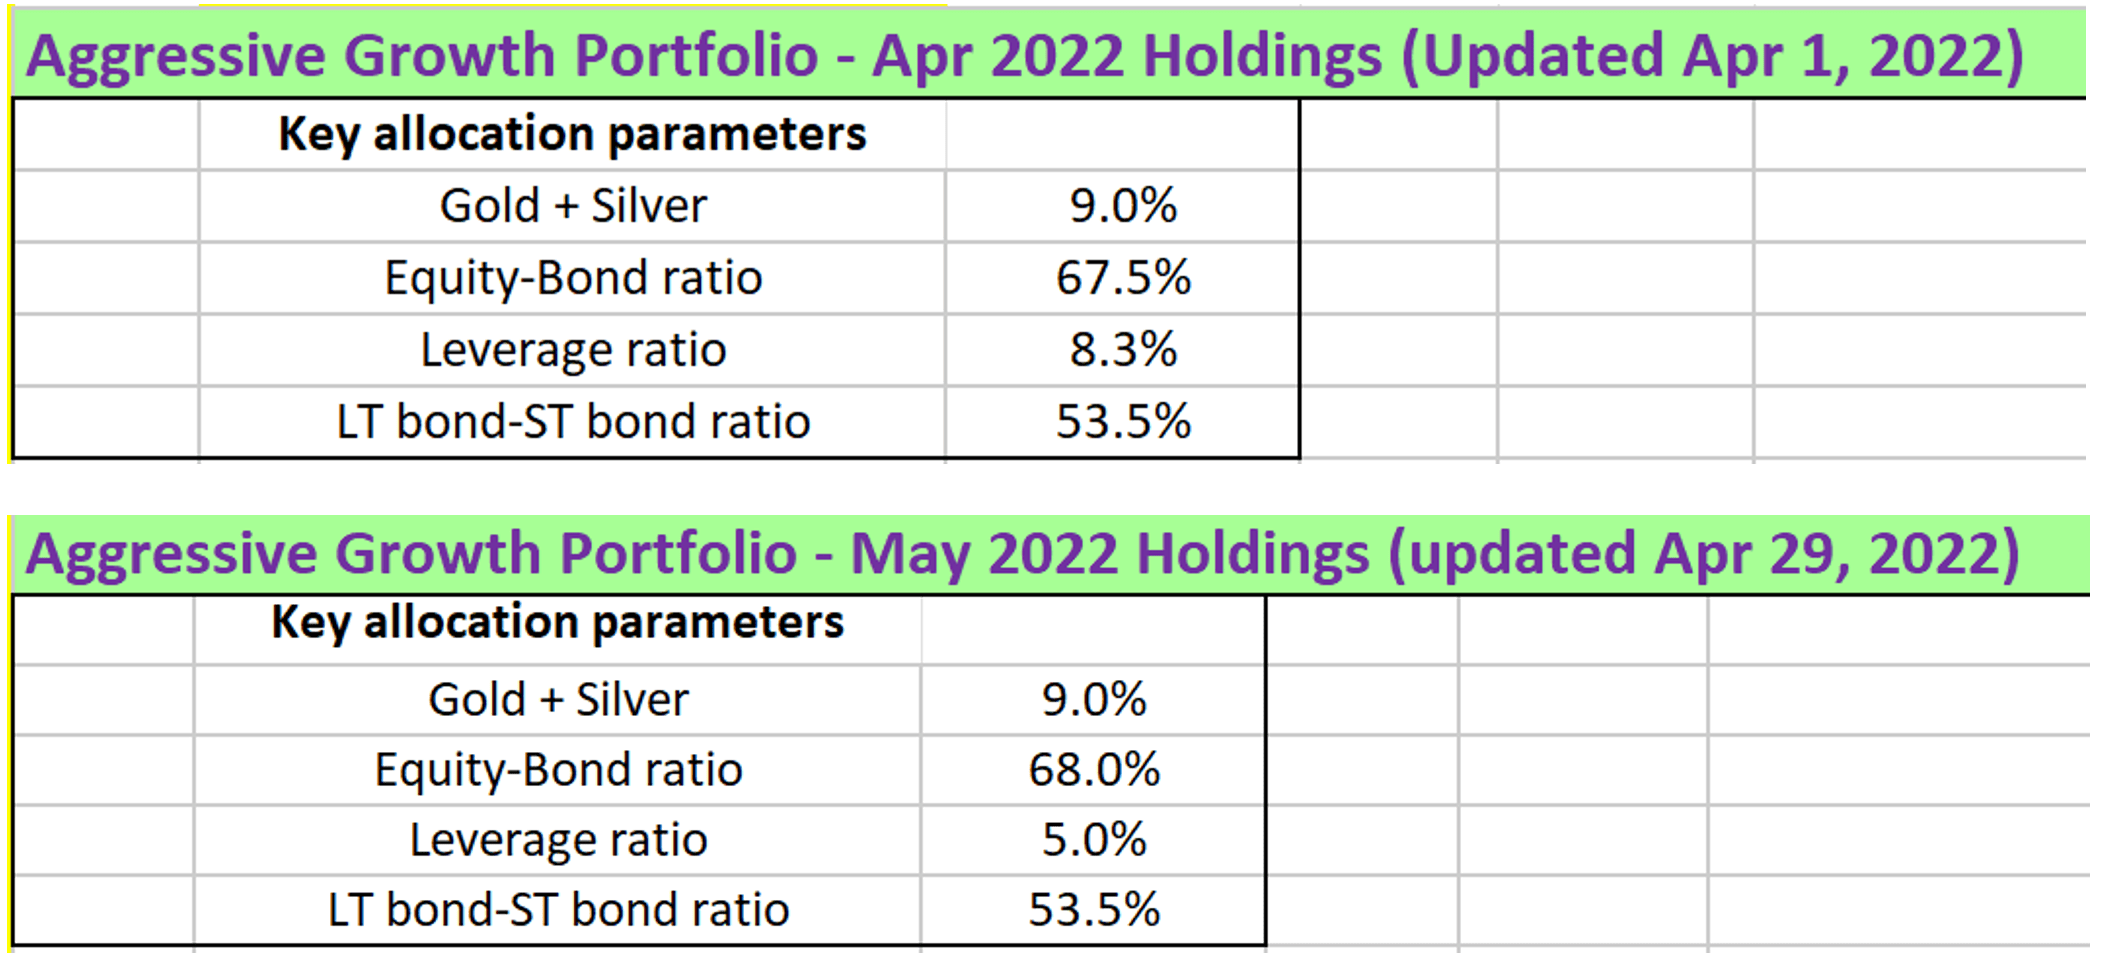
Final thoughts and risks
Finally, two quick notes. Firstly, you may have noticed that we actually hold VTI in our portfolio instead of QQQ. These funds are really interchangeable in our view given that VTI is also dominated by the mega-cap tech stocks. The reasons we hold VTI are for its lower fees than QQQ and the fact that we are not active traders. We adjust our portfolio once a month and do not really need the extra liquidity provided by QQQ.
Secondly, going forward, we are seeing volatility quieting down and equity becoming more attractively valued. Extreme volatility, just like extreme excitement, cannot last long. As a matter of fact, you might notice from our free blog article that we actually increased our TQQQ allocation slightly (from 5% back in May to 5.8% in July).
And also a few final words about the risks associated with TQQQ. Besides its higher fee and larger volatility decay than QQQ as aforementioned, TQQQ also creates a dividend drag and suffers larger trading friction than QQQ. QQQ currently pays a 0.65% dividend but TQQQ does not pay a dividend. Also, due to its smaller size, TQQQ trades with a larger spread than QQQ. According to ETF.com, TQQQ trades with an average spread of 0.03%, about 3x larger than the 0.01% spread for QQQ.
Be the first to comment