

Hang Seng Index, US-China Trade Deal, COVID-19 – Talking Points:
- Hang Seng Index outlook pessimistic on protest and political risks
- US-China trade war potential to come back into focus
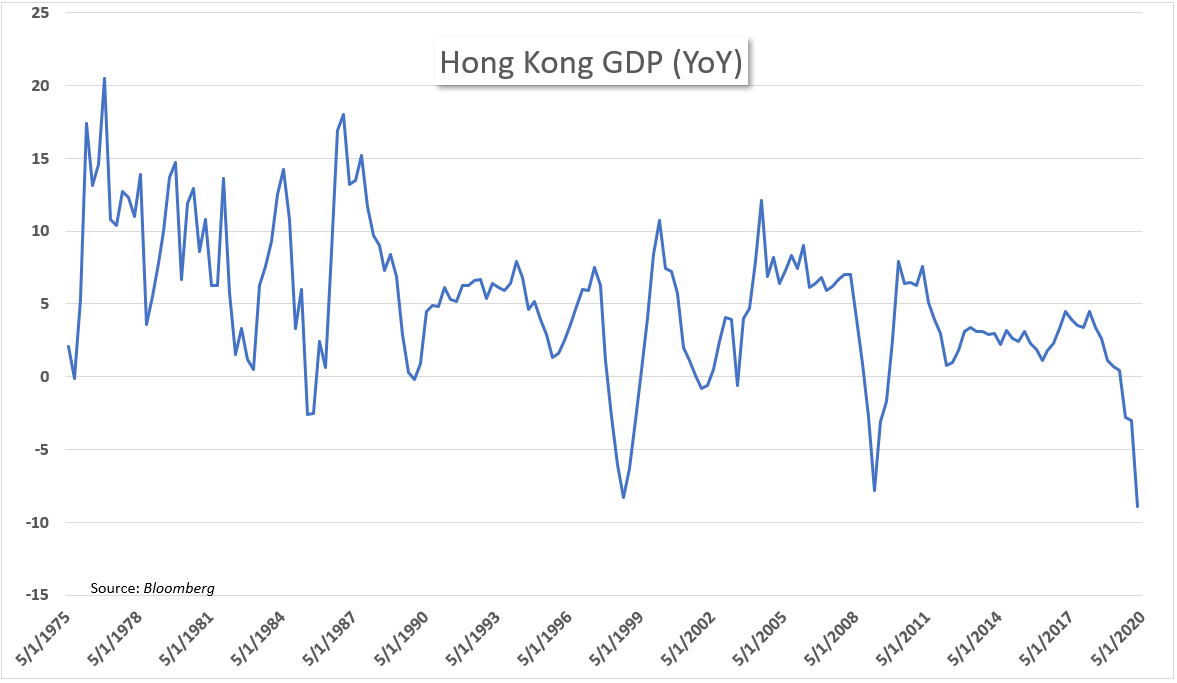
- Q1 GDP reflects tremendous effect on Hong Kong GDP from COVID-19
Pressure on Hong Kong’s Hang Seng Index appears likely to continue, despite the easing of social distancing restrictions in the country as COVID-19 infections remain low. The Asian financial hub’s economy recorded a significant decline in activity on Monday, with the advance reading of Q1 GDP showing an 8.9% drop, the worst on record. While the virus-induced impacts appear responsible – as a sharp pullback in consumer spending, exports, and investments crushed economic activity – Hong Kong’s economy will remain under pressure as protests may continue once virus fears ebb.
Hong Kong GDP – YoY
The relatively heavy pressure on the Hang Seng is illustrated in comparison to the S&P 500 index, with the indexes down on a year-to-date basis by 10.66%, and 14.49% respectively, despite the United States’ virus count remaining exponentially higher than Hong Kong’s in recent weeks. However, a recent reawakening in the US-China trade war picture may cap upside movement for US stocks. Granted, the Hang Seng would likely suffer negative repercussions itself should another escalation between the US and China play out.
Hang Seng Index vs S&P 500 Index (Daily Chart)
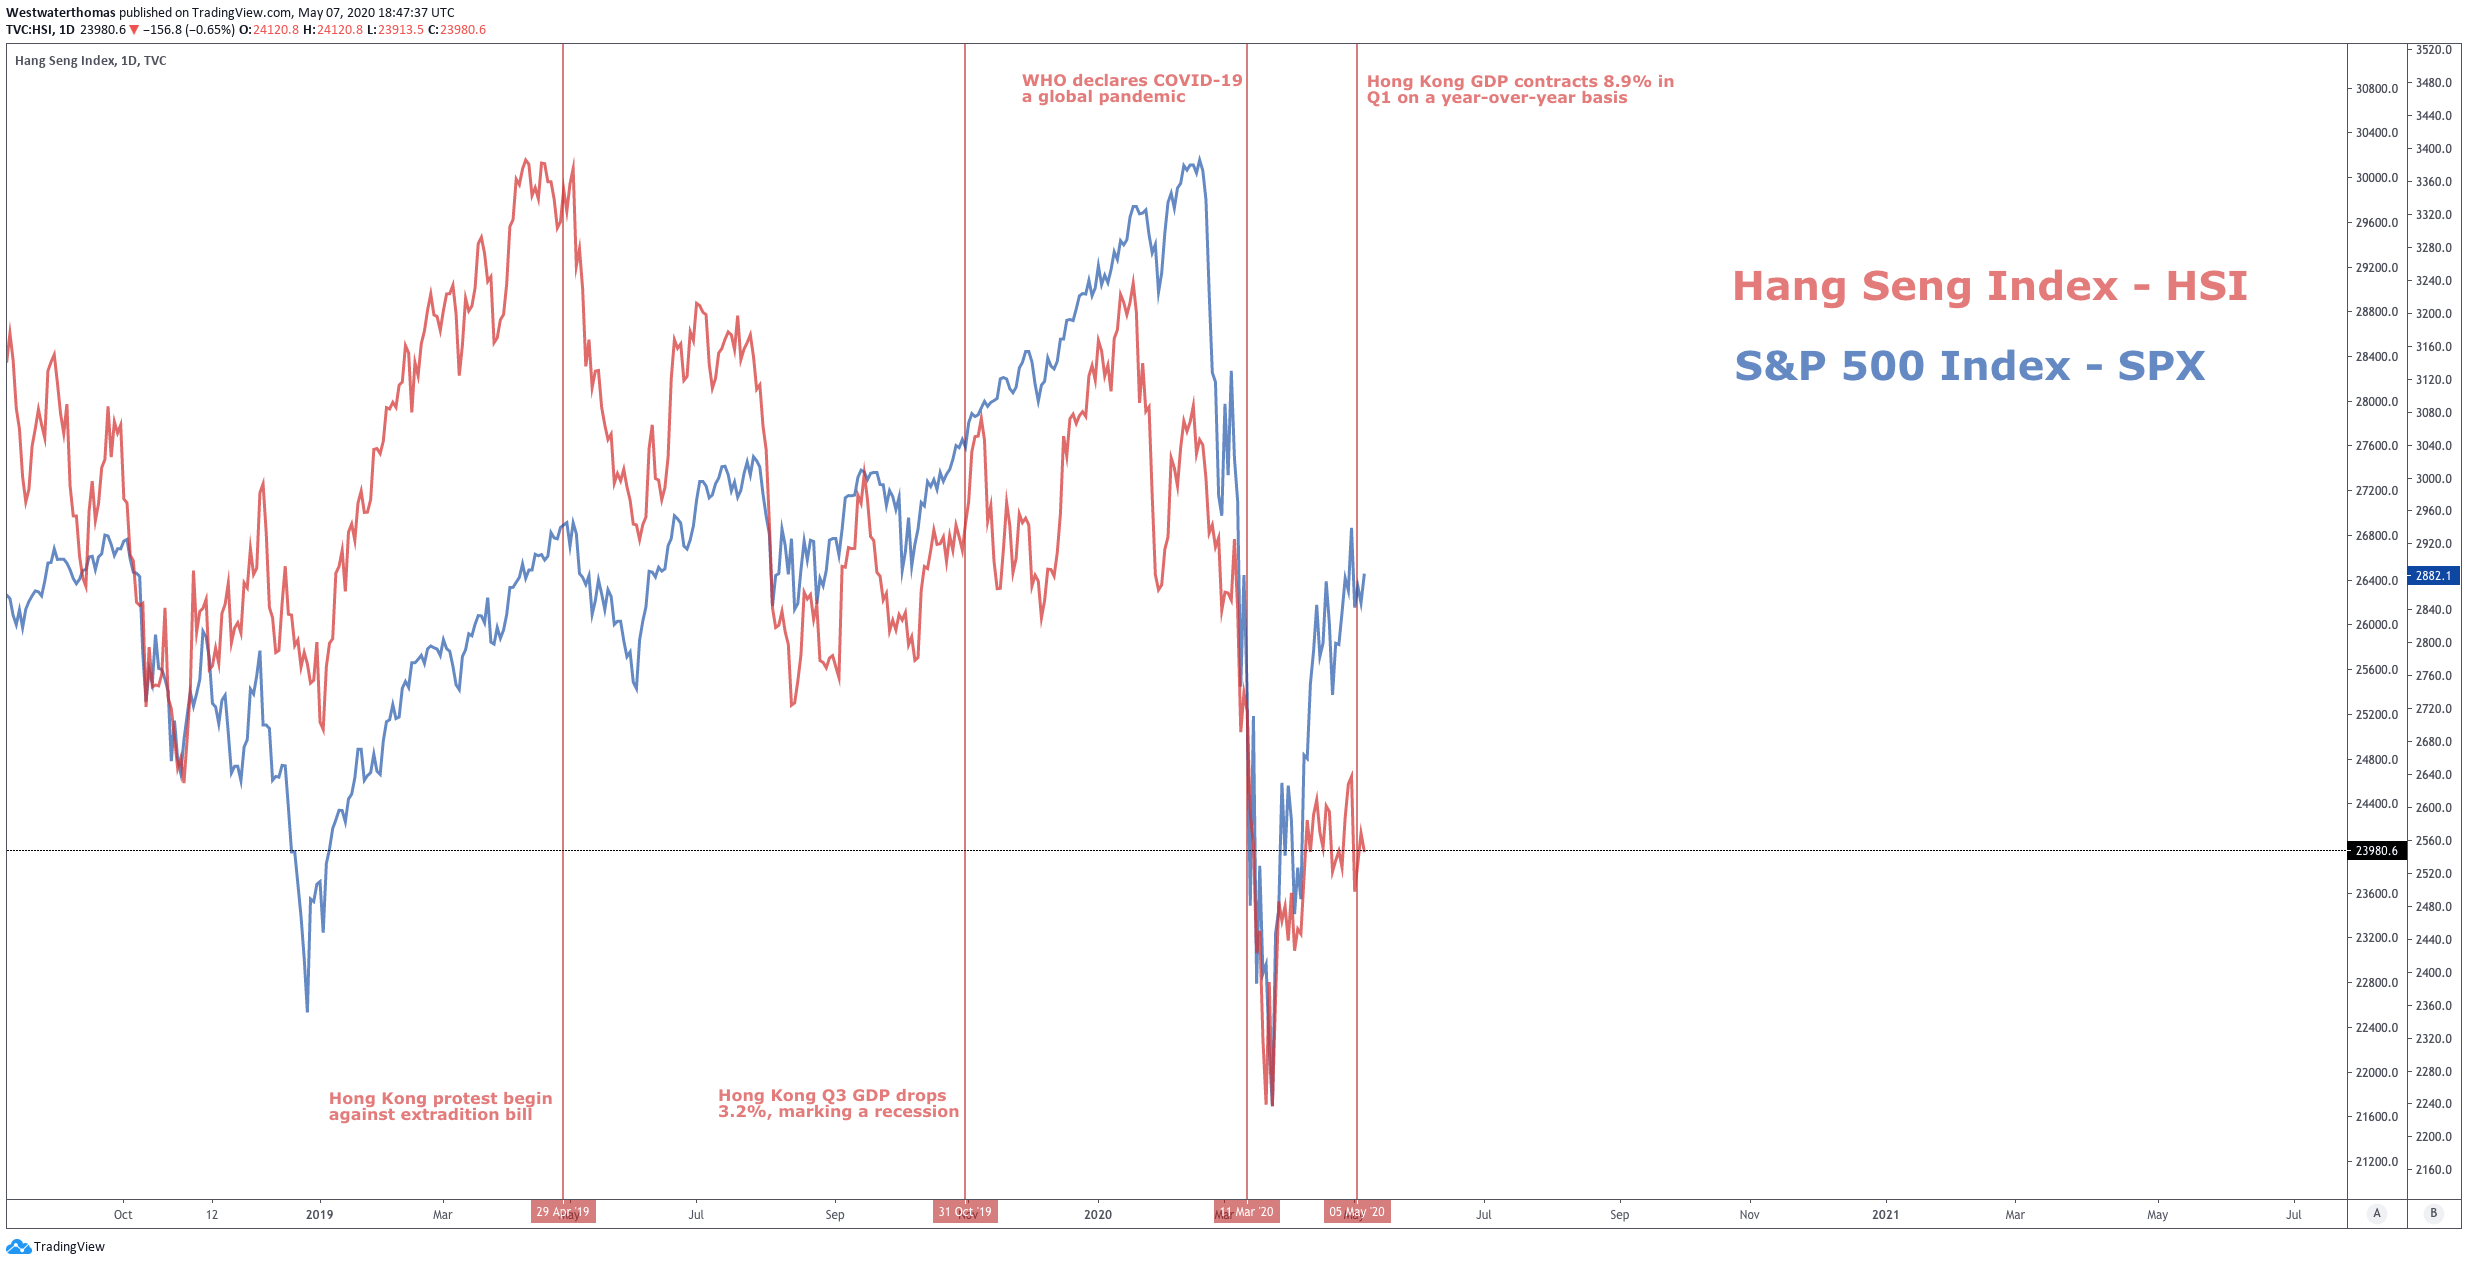
Chart created in TradingView by Thomas Westwater

Recommended by Thomas Westwater
Traits of Successful Traders
Turning to the technical setup on the Hong Kong HS50, the index currently sits 14 percent higher from its March 19 low. However, upside momentum is flashing signs of exhaustion as a third consecutive higher-low failed to manifest, with price action on Monday breaking below the last higher-low level.
Buyers attempted a push higher on Wednesday, rising above 24,129, the 38.2 fib retracement level, but follow-through fizzled as sellers fought back. While Thursday’s session ended slightly higher, price action failed again at the 38.2 fib level in the intraday session. This combined with the broken trend in setting higher-lows, could be a white flag for bulls, for now.
Hong Kong HS50 Index (Daily Chart)

Source: IG Charts
Be the first to comment