

Olivier Le Moal/iStock via Getty Images
I had covered silver a couple of years ago here. I want to refresh the metrics I used then and add new ones. We used silver (PSLV) or (SIVR) to protect a portfolio from extreme volatility, potential crisis, prolonged market crash, high inflation, volcanic eruption, descending UFO, and pretty much anything else. However, back in early 2020, that was a strategy to defend and gain through double or triple volatility of silver over gold since it had been heavily underperforming the yellow metal. Twenty-five months have passed; the gold to silver ratio subsided closer to its historical average. The analysis shows that one can retain the position, not increase it, for two reasons: a) To be safe through a potential multi-year bullish commodity cycle if he/she doesn’t want to play with non-precious commodities; b) the best part of working with multi-year shifts in the gold to silver ratio lies below the average line. It requires patience, at least two to three years. If the strategy is successful, I will shift from precious metals to value, stalwarts, and some growth stocks when their valuation gets more rational. Silver is not an investment.
Revision of the basics
Almost in every article about silver, there is an attempt to cover the fundamentals. I enjoy these attempts most of the time; they help me keep the metal’s ABCs in mind. I want to respect readers who are unfamiliar with silver and not bother people who get it better than me.
Silver has been money for most of civilization’s history in pure or alloyed form, and it was only removed from the monetary function in the late 19th century through the so-called ‘Crime of 1873‘. The process was gradual, though; however, during the 20th-century, silver lost most of its economic power to gold. I don’t know many central banks globally that hold silver rather than gold. Silver is now a metal for coins for collectors and silver bars for old-school value keepers. About 50% of silver serves modern society as a highly circular technological metal; we will discuss it later. What’s important is that some believe silver saved some of its monetary function. Given that this precious metal market is shallow, inelastic, it is prone to speculative price spikes when market participants feel uneasy about the future and opt for gold and the “smart man’s gold.”
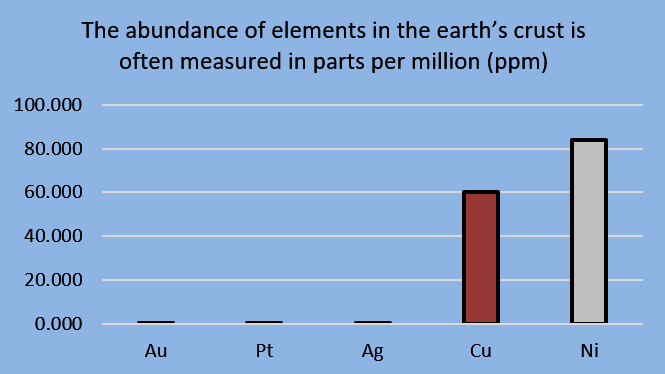
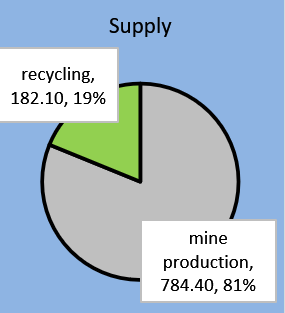
Mining silver is this “lucrative” that 73% of annually mined silver comes as a by-product. For sure, the picture would be different if the price of Oz was 50 US dollars.
www.visualcapitalist.com
(Source: visualcapitalist)
Here is another set of charts that help to picture some basics of precious metals, the supply and demand.
author’s estimate author’s estimate www.silverbullion.com and Author’s estimate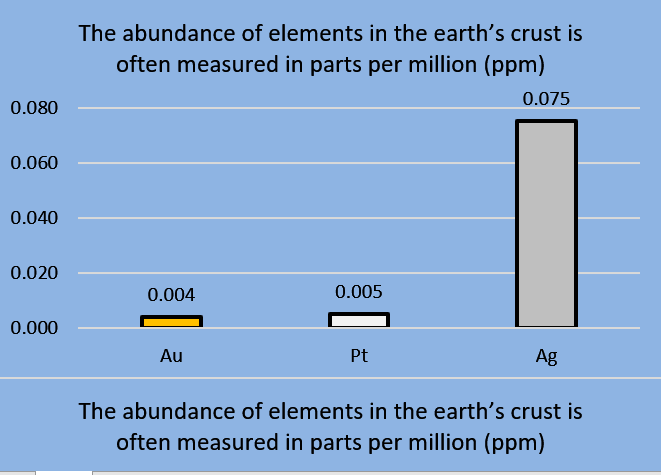
(Source: Silverbullion data and author’s visualization)
While doing second research on silver (the first was in 2020), I discovered that the market is less plain than I thought; The gold marker for comparison is clear as day. Firstly, we have an approximate piechart of total investable assets globally. I gathered the data over several years, and it may lack precision. However, it reflects the bulk proportions of the size of different investable asset classes globally. Please notice that I took a market value of OTC derivatives, not par because it would wrongfully distort the chart.
The proportion of global investable asset classes at approximate prices of 2017-2020
ZeroHedge, Visualcapitalist, WGC, Author’s estimates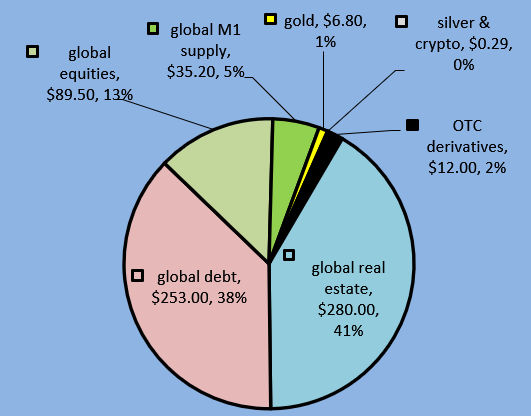
(Source: ZeroHedge, Visualcapitalist, WGC, Author’s estimates)
According to John Exter’s pyramid, all these asset classes stand on each other, but their ultimate base is so-called “power-money,” precious metals. No wonder some cash flows from other assets sometimes decide to seek a safe haven, and then:
The elasticity of a positively sloped investment demand function overwhelms the inelasticity of supply
Barton Biggs, “Hedgehogging”
A twist
One may find that silver’s share in the abovementioned chart is so tiny that it must benefit in moments of high demand for gold x-times what gold does. That is where the Argentum market vagueness kicks in; it will not react as a high-in-demand asset as you supposed it to do. Complex and interdependent reasons emerge.
The industrial role uses about half of the annual silver supply and a presumably great deal of mined silver above ground; the metal is very circular and used repeatedly. However, we do not understand the stock of the metal that may and must, according to market forces, spill over to the investable silver market. Potentially it may be huge because the above-ground stocks are understudied and underreported. You may examine it yourself in this article – “How Much Silver Is Above Ground?” In a nutshell:
In total, there were an estimated 1.6 million metric tonnes of physical silver above ground by late 2018. This amount is 20 times higher than what The Silver Institute discloses as “identifiable above-ground stocks,” which is what’s widely assumed to be the total above-ground stock. The huge discrepancy is important to analyze, as it reveals silver’s true stock to flow ratio and supply and demand dynamics. Misunderstanding these dynamics would mean failing to understand the price of silver.
Voima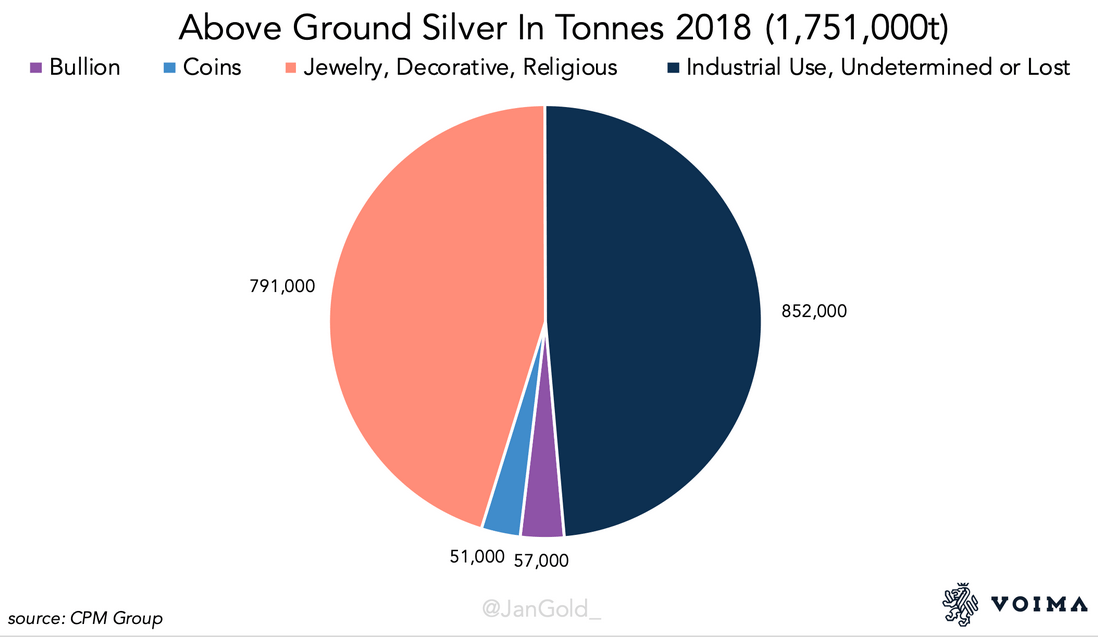
(Source: Voima)
Jewelry and Industrial related above-ground stocks are understudied. The figures in the article I mentioned above state that that whole amount is enormous. In one year, demand for silver from all sectors sways just above 1000 mln. Oz; Potentially, there are 51,981.41 mln. Oz of above-ground stocks. 1000/51,981.41 equals 1.92%. If the metal’s price gets attractive enough, just 1% of all above-ground stocks from Jewelry and Industrial use will quench the investment thirst. That partially explains why the silver market is kept speculative, is volatile, and most price spikes may be (or not) elaborately orchestrated but are always short-lived.
If you look at the next chart, you will spot that demand trends develop gradually: the Industrial sector is stable, Photovoltaic or PV – grows bit by bit, Photo is shrinking, offsetting PV’s growth, and the Jewelry – oscillate between fixed boundaries. So, as with gold, the force/dynamics of investment demand drives the price. 2020 was a vivid example of it, and the price went up from $14 in 2019 to $28+ in 2020.
The Silver Institute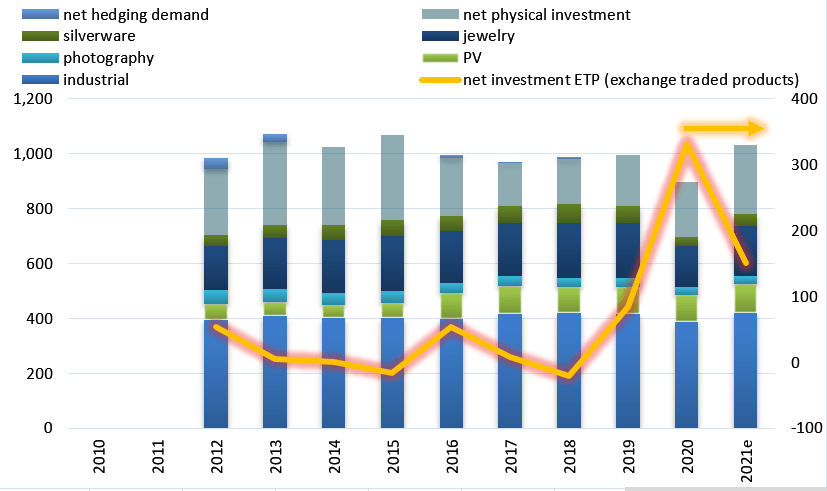
(source: The Silver Institute)
Nevertheless, over the many years since governments stripped away silver’s monetary function and then detached paper currencies from gold, these precious metals and investors have worked out their relationship. I believe these bonds incorporate all the nuts and bolts of the precious metals fundamentals and cash, and they must still be intact for the patient one. We can use that to protect our portfolios, the purchasing power of money, and even gain handsomely. So let us explore that further.
A reason to be on guard
In a few words, developed markets develop in well-known cycles, and though that is all but scientific – we have not had a good bear market since 2008; sooner or later, we can have one.
S&P 500 Index – 90 Year Historical Chart
S&P 500 Index – 90 Year Historical Chart (Macrotrends)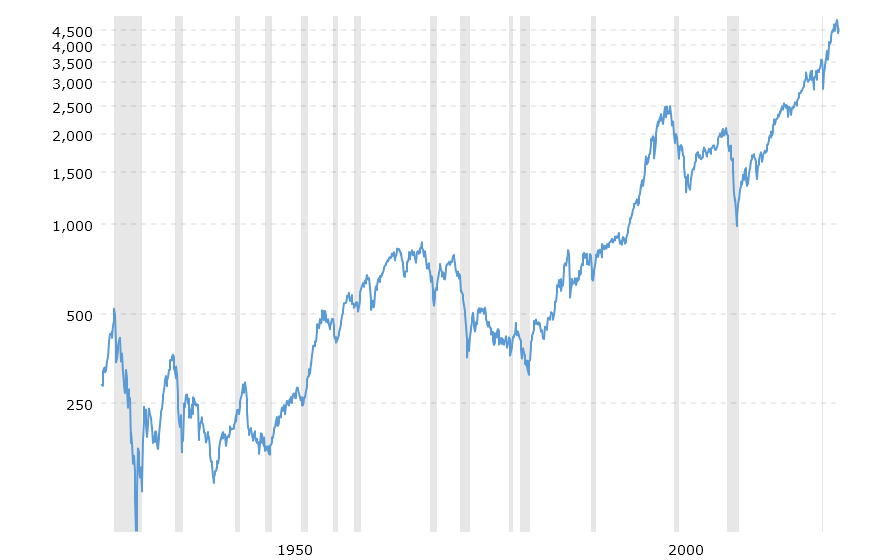
(Source: Macrotrends)
Gold is the king, a marker for precious metals investing. As the following chart shows, it has worked well as protection, and silver did nicely but with hard-to-digest volatility.
Author’s estimate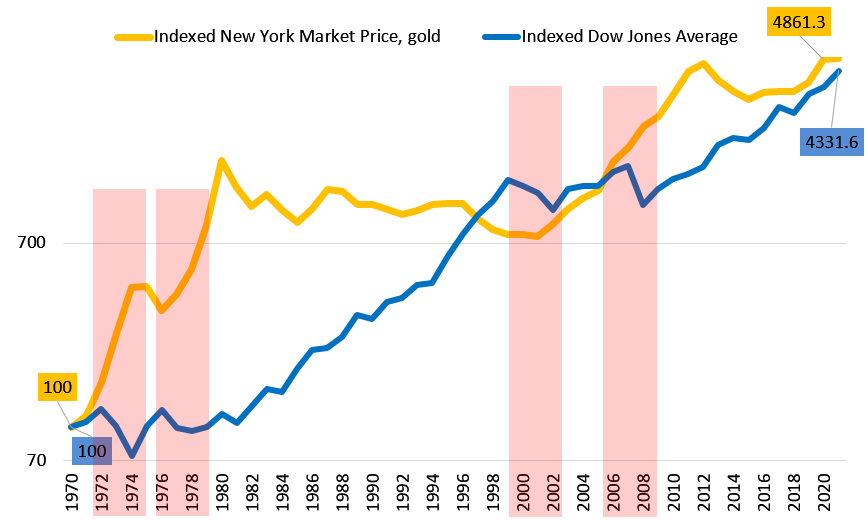
(source: Author’s estimate)
The next chart is a popular one. The “10-Year Treasury Minus 2-Year Treasury” spread (blue curve to the left axis) indicated several recessions and market crashes (check the red curve for S&P 500, right axis), though it did not in 2019 and before the 90s acted way differently. So each time spread between 10 and 2-year treasuries falls to zero or lower in a year or two, a recession follows. Too obvious to work this time, but a good reason to be on guard.
Federal Reserve Bank of St. Louis & Author’s estimate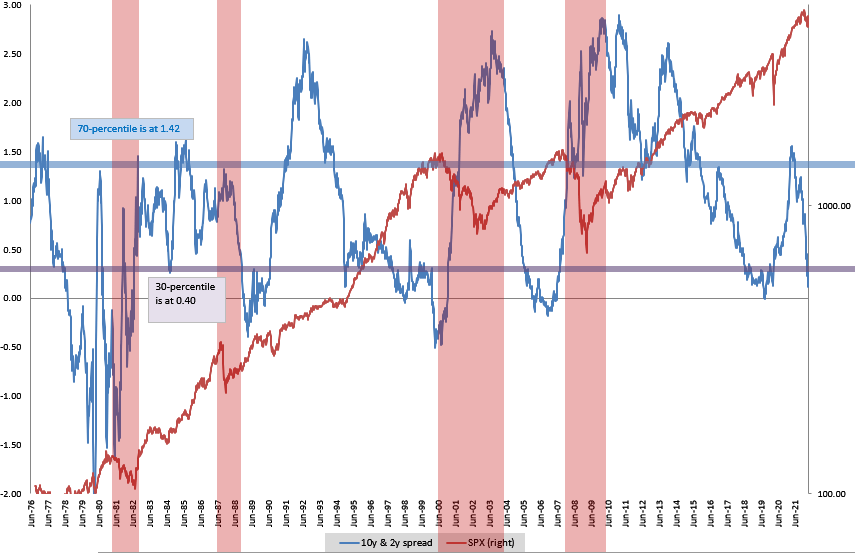
(source: Federal Reserve Bank of St. Louis & Author’s estimate)
If you soundly enough deem the chart above not convincing, then the one below clearly pictures what may be the problem now or in the future. The debt-fueled stock market is not exciting news; Yes, it can go on like this for a prolonged time, but the gap between the economy’s and its stock market growth has gotten so wide that a solid push could ruin many years of stock gains. Some protection won’t hurt at all.
Federal Reserve Bank of St. Louis & Author’s estimate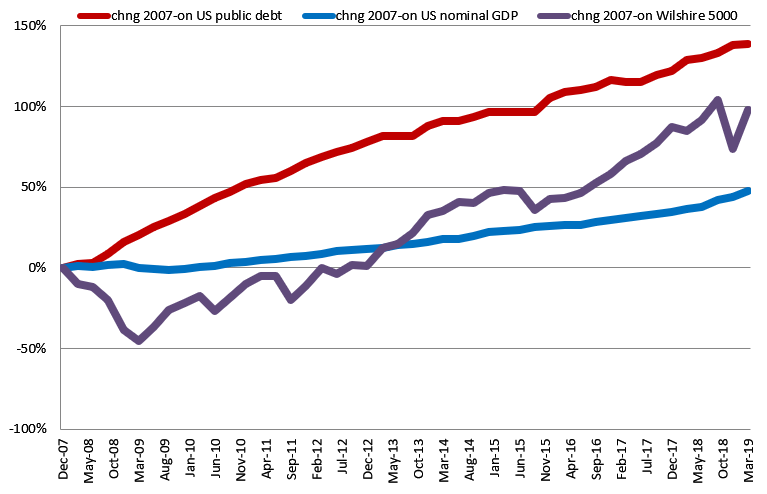
(source: Federal Reserve Bank of St. Louis & Author’s estimate)
The chart below would be my last bullet to show how unreliable the current market is. At these valuations, anything can happen. Sure, there is a single-digit or slight double-digit chance for continuing growth, yet a very high double-digit chance for a crisis. There is a good saying for the current situation: “Prepare for the worst so the best will happen.” When the average and median price to earnings, or PE, ratio for S&P 500 are 18 and 20, respectively. When the average and median price to sales, or PS, ratio are 1.5 and 1.57, respectively. Then how safe must an investor feel at the PS of over 3? The odds are in favor of the defensive style.
Bloomberg and Author’s estimate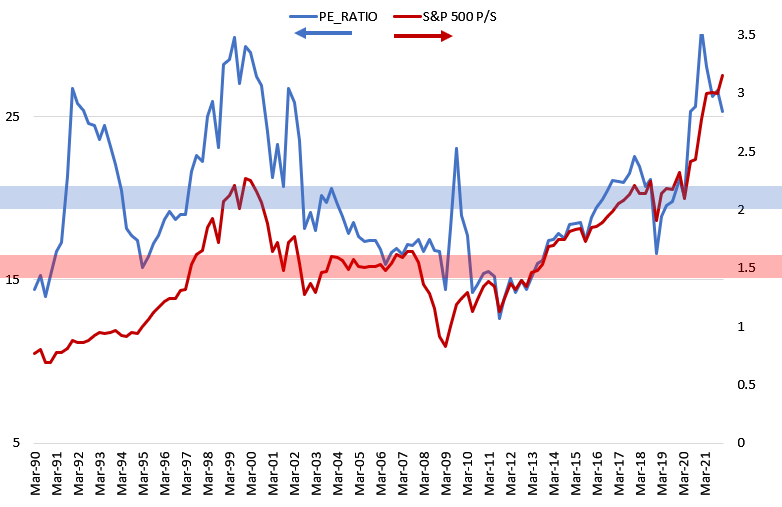
What is up with silver
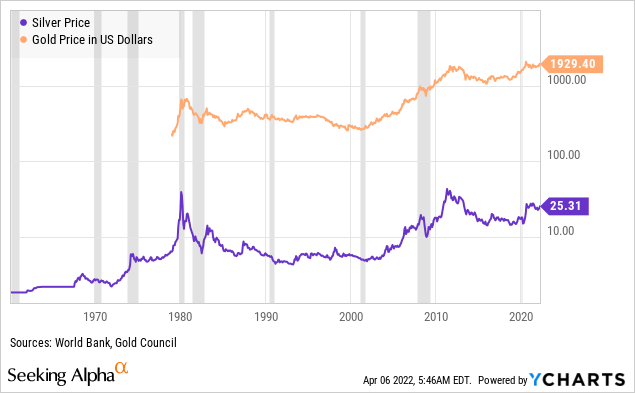
The gold to silver ratio is the sanctum sanctorum of all metrics. Gold leads the way, and silver follows it, sometimes with a significant lag. The relationship between these two can be allegorically pictured as a wise and disciplined older brother and a sleepy constantly-slacking younger brother that happens to be moody and hot-tempered. And thus, when the time comes to act, it takes quite a while to wake the younger brother up. But when he’s finally up, he goes vigorously. The chart below has a logarithmic scale; the average lies at 66 (blue area), the 25th percentile at 55.7 (red area), and the 75th percentile at 74.7 (green area). Back in 2019 and early 2020, the ratio was at its best for a long-term buy; however, it has not worked out zone below average and down to 25th percentile and lower. That’s still possible; please look at what happened in the 90s and early 2010s.
Bloomberg
Pure statistically, every extremum peak is followed by an extremal fall; it takes time to develop. After touching 114.3 in late April 2020, the ratio fell to its average in the high 60s. Now, it is not a sure shot anymore, but it still deserves a try at this level and unclosed path towards the 25th percentile or lower. However, I must warn: the overall position in 2020 was 22% of the portfolio, but now I suggest risking not more than 15%.
Except for the general prudence, we have to reason our hold of a big chunk of silver in a portfolio. Are we sure the macroeconomics favors precious metals? As all readers know well, inflation has broken all the records since the late 1970s. It remains unknown where and when inflation will be taken under control. Please see the picture below; this is Thomson Reuters/Core Commodity CRB Index that encircles all major hard and soft commodities. Note that this index lives in long phases; it doesn’t stop once it starts a new phase, bullish or bearish. It looks clear to me that it has entered a new bullish phase. That favors a wide variety of commodities, and something tells me that precious metals will tag along.
CRB Commodity Index
Tradingeconomics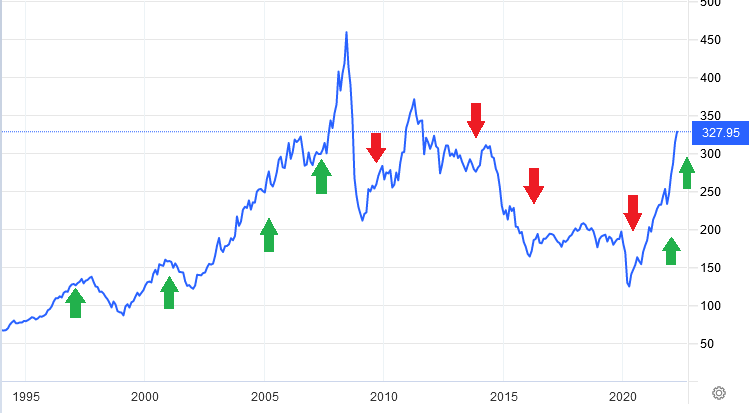
(source: tradingeconomics)
Several cases can be presented to support Argentum versus Aurum at the current gold to silver ratio of 77:
- If a random investor got into precious metals when the gold-to-silver ratio was at 82.77 in 1991 and stayed there for 3 years, then his returns would have looked like this:
| 6/28/1991 | 6/24/1994 | gain | per annum | |
| copper | 2221.7 | 2461 | 10.77% | 3.60% |
| silver | 4.45 | 5.41 | 21.57% | 7.21% |
| gold | 368.35 | 391.6 | 6.31% | 2.11% |
| platinum | 374.5 | 404 | 7.88% | 2.63% |
- If he could force himself to wait for 7 years (unlikely), then the result could have been:
| 6/28/1991 | 6/19/1998 | gain | per annum | |
| copper | 2221.7 | 1688 | -24.02% | -3.44% |
| silver | 4.45 | 5.385 | 21.01% | 3.01% |
| gold | 368.35 | 298.75 | -18.90% | -2.71% |
| platinum | 374.5 | 362.5 | -3.20% | -0.46% |
- If he did it in 2003 with the ratio at 75 and held for 3 years, then the result would have been:
| 7/25/2003 | 7/21/2006 | gain | per annum | |
| copper | 1752.5 | 7035 | 301.43% | 100.75% |
| silver | 5.07 | 10.83 | 113.61% | 37.97% |
| gold | 362.75 | 619.75 | 70.85% | 23.68% |
| platinum | 692.5 | 1206.75 | 74.26% | 24.82% |
- But if he could have waited for 5 years since 2003 then:
| 7/25/2003 | 7/18/2008 | gain | per annum | |
| copper | 1752.5 | 8085 | 361.34% | 72.47% |
| silver | 5.07 | 18.1301 | 257.60% | 51.66% |
| gold | 362.75 | 955 | 163.27% | 32.74% |
| platinum | 692.5 | 1852.5 | 167.51% | 33.59% |
If you have studied these tables for a moment, you noticed that silver did better than gold. Copper and platinum were added for comparison and should be studied separately because those are primarily industrial metals. All that Argentum requires is a good deal of patience and favorable fundamental odds.
A couple of words of PSLV and parting thoughts
Why do I use Sprott Physical Silver Trust (PSLV) as the main vehicle to have exposure to the silver market? You can read the factsheet for additional information.
- Unitholders have the ability to redeem their units for physical silver bullion on a monthly basis, subject to certain minimum requirements.
- The Trust’s metals will be held in custody by the Royal Canadian Mint, a Federal Crown Corporation of the Government of Canada.
- The Trust may offer a potential tax advantage for certain non-corporateU.S. investors. Gains realized on the sale of the Trust’s units can be taxed at a capital gains rate of 15%/20%2 versus the 28% collectibles rate applied to most precious metals ETFs, coins and bars.
The drawback to those remarkable features is a 0.62% expense ratio, which is 2-times higher than the 0.3% of Aberdeen Standard Physical Silver Shares ETF. However, SIVR doesn’t have a redemption perk, which is a nice reassuring option.
As a final thought: We do not use the metal to yield splendid returns; we use it to weather a potential upcoming storm, save purchasing power of cash, and, hopefully, execute this task better than with gold. We are ready to sell parts of it if we see exciting investment opportunities in value and growth stocks related to clean energy or other business that ease ecological problems. That is where our gains are, Insh. The enormous stock of underreported silver will not let the metal get very high for too long. Therefore, a holder must use any irregular spikes in price to sell parts of the position.
Risks
This fundamental stance could fail because history might not repeat itself, and silver would underperform gold, or both metals would significantly drop. A standard deviation (historical prices since 1982) for silver is 24%, two Sigmas equal 48%. That is entirely possible to lose 24% to 48% of the market value of one’s position in 12-24 months.
Be the first to comment