

IvelinRadkov
Background
For those interested in John and Jane’s full background, please click the following link for the last time I published their full story. Here are the key details about John and Jane that readers should understand.
- This is a real portfolio with actual shares being traded.
- I am not a financial advisor and merely provide guidance based on a relationship that goes back several years.
- John retired in January 2018 and his only consistent source of income is Social Security.
- John has begun drawing $1,000/month from his Traditional IRA to supplement his retirement income.
- Jane officially decided to retire on December 31, 2020. She is now collecting social security as her primary source of income.
- John and Jane have other investments outside of what I manage. These investments primarily consist of minimal risk and minimal yield certificates.
- John and Jane have no debt and no monthly payments other than basic recurring bills such as water, power, property taxes, etc.
John and Jane requested my help after we discovered that their financial advisor was charging excessive fees and engaging in trades that appeared to be more favorable to the advisor than it was to John and Jane. I do not charge John and Jane for anything that I do and all I have asked of them is that they allow me to write about their portfolio anonymously to help spread knowledge and to make me a better investor in the process.
Generating a stable and growing dividend income is the primary focus of this portfolio, and capital appreciation is a secondary characteristic.
Dividend Decreases
No stocks in John’s Traditional or Roth IRA put/decreased dividends during the month of September.
Dividend And Distribution Increases
Five companies paid increased dividends/distributions or a special dividend during the month of September in the Traditional and Roth IRAs.
- Apple Hospitality (APLE)
- BP (BP)
- Duke Energy (DUK)
- Main Street Capital (MAIN)
- Truist Financial (TFC)
BP was covered in the Taxable Account update and MAIN was covered in Jane’s Retirement Portfolio Update so I will only include information about the dividend increases. For those interested in reading the summary of these two companies the link is included at the end of the article.
Apple Hospitality
Inflation numbers look dismal and the economic outlook is not what I would consider rosy. Still, APLE continues to post positive news that is reassuring (especially when we consider the industry they operate in) to shareholders. The Q2-2022 conference call had a number of positive factors, including:
- RevPAR exceeded pre-pandemic highs and was up 40% compared to Q1-2022 numbers.
- Occupancy for the quarter was 78% and compared to pre-pandemic occupancy in Q2-2019 of 82%.
- The company has announced another increase to the dividend starting in November.
APLE numbers are looking strong and the stock finally appears to be in a place where it can pay a meaningful dividend once again. APLE may be more capable of paying higher dividends but I wouldn’t say that shares are exceptionally compelling in an environment where CDs are offering a 3.5% yield with practically no risk.
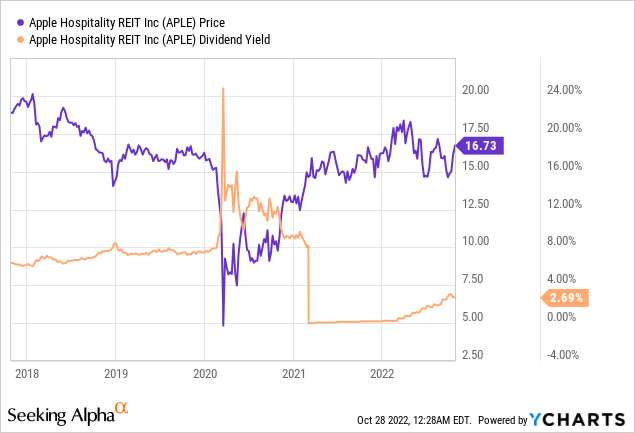
The dividend was increased from $.05/share per month to $.07/share per month. This represents an increase of 40% and a new full-year payout of $.84/share compared with the previous $.60/share. This results in a current yield of 5.02% based on the current share price of $16.73.
BP
The dividend was increased from $.33/share per quarter to $.36/share per quarter. This represents an increase of 10% and a new full-year payout of $1.44/share compared with the previous $1.32/share. This results in a current yield of 4.46% based on the current share price of $33.23.
Duke Energy
DUK is one of the largest and most established American utility companies. The utility sector has been a popular place in recent years for retirees to stuff their money and obtain a yield that is modest. DUK is also a major player when it comes to the transition to renewable energy sources even though analysts have points to 5%-7% EPS CAGR on the high end over the next several years.
Seeing DUK shares slowly pull back has started to create opportunity for those who are patient. I would rate the shares as a compelling buy in the mid-$80/share range or a yield between 4.5%-5.0%. The graph below shows that over the last five years it is difficult to find shares trade at 4.5% yield or higher.
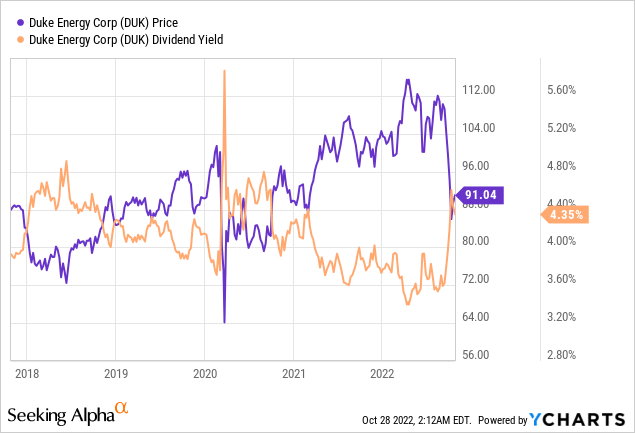
The dividend was increased from $.985/share per quarter to $1.005/share per quarter. This represents an increase of 2% and a new full-year payout of $4.02/share compared with the previous $4.94/share. This results in a current yield of 4.43% based on the current share price of $91.04.
Main Street Capital
MAIN paid a one-time special dividend of $.10/share in the month of September.
Truist Financial
TFC is an interesting case study for rising interest rates. On one hand, TFC has a large number of wealth management clients who seeing the value of their investments decrease because of rising rates and those funds shifting from capital markets to safer investments like Certificates of Deposit (A great example of this is to look at what is happening to T. Rowe Price (TROW) with their decline in Assets Under Management). On the other hands their lending portfolio is likely to continue seeing interest income rise on the back of the Federal Reserve raising rates.
TFC is now one of the largest financial institutions in the United States so it is prepared to handle these challenging market conditions. For those looking to establish or add to an existing position I would wait until shares push further into the low-$40/share range and produce a yield closer to 5%.
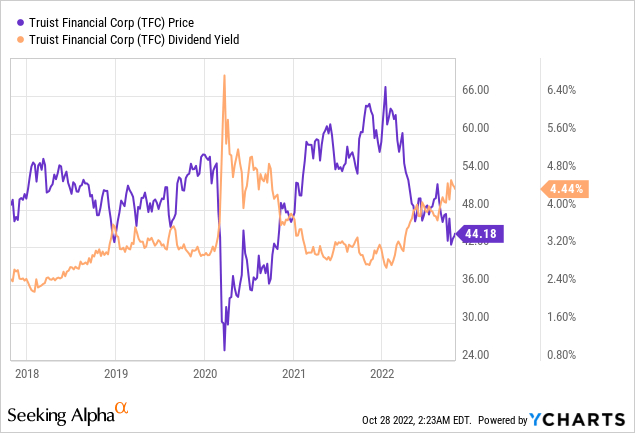
The dividend was increased from $.48/share per quarter to $.52/share per quarter. This represents an increase of 8.3% and a new full-year payout of $2.08/share compared with the previous $1.92/share. This results in a current yield of 4.70% based on the current share price of $44.18.
Retirement Account Positions
There are currently 38 different positions in John’s Traditional IRA and 23 different positions in his Roth IRA. While this may seem like a lot, it is important to remember that many of these stocks cross over in both accounts and are also held in the Taxable Portfolio.
Below is a list of the trades that took place in the Traditional IRA during the month of September.
Traditional IRA – September Trades (Charles Schwab)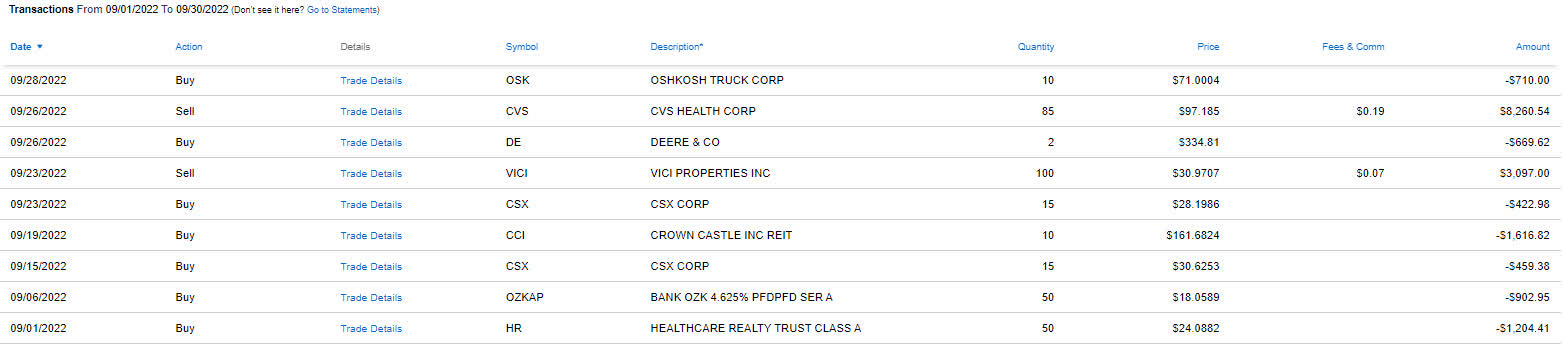
Below is a list of the trades that took place in the Roth IRA during the month of September.
Roth IRA – September Trades (Charles Schwab)
The next article I release will summarize all of my trades in John and Jane’s portfolios since the middle of September.
September Income Tracker – 2021 Vs. 2022
September’s income for the Traditional IRA and Roth IRA were up considerably year-over-year. The average monthly income for the Traditional IRA in 2022 is projected to be up about 30% based on current estimates, and the Roth IRA is looking to grow by an astounding 19.1% year-over-year. This means the Traditional IRA would generate an average monthly income of $1,427.82/month and the Roth IRA would generate an average income of $671.87/month. This compares with 2021 figures that were $1,098.38 and $564.25 per month, respectively. We are on track to generate approximately $5,200 of additional dividend income in 2022 from the combined dividends in the Traditional and Roth IRAs when compared to FY-2021 dividends received.
It should be noted that the huge increase in dividend income in the Traditional IRA can largely be attributed to the significant special dividend paid by Healthcare Realty (HR) that was elaborated on in the July article for John.
SNLH = Stocks No Longer Held – Dividends in this row represent the dividends collected on stocks that are no longer held in that portfolio. We still count the dividend income that comes from stocks no longer held in the portfolio even though it is non-recurring.
All images below come from Consistent Dividend Investor, LLC. (Abbreviated to CDI).
Traditional IRA – September – 2021 V 2022 Dividend Breakdown (CDI) Roth IRA – September – 2021 V 2022 Dividend Breakdown (CDI)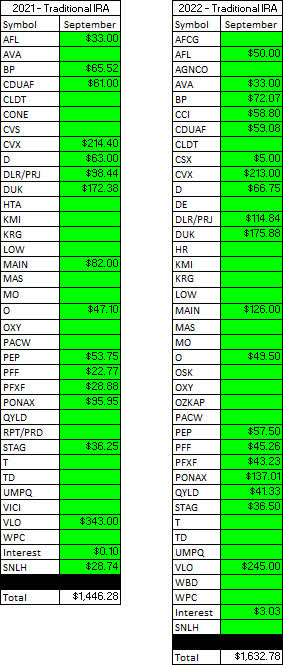
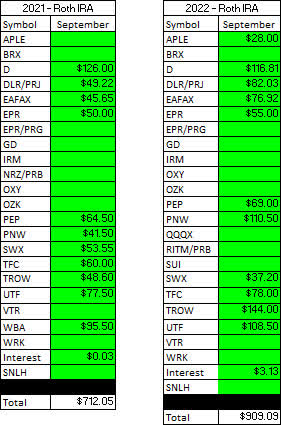
Here is a graphical illustration of the dividends received on a monthly basis for the Traditional and Roth IRAs.
Retirement Account – Monthly Dividends Received – September 2022 (CDI)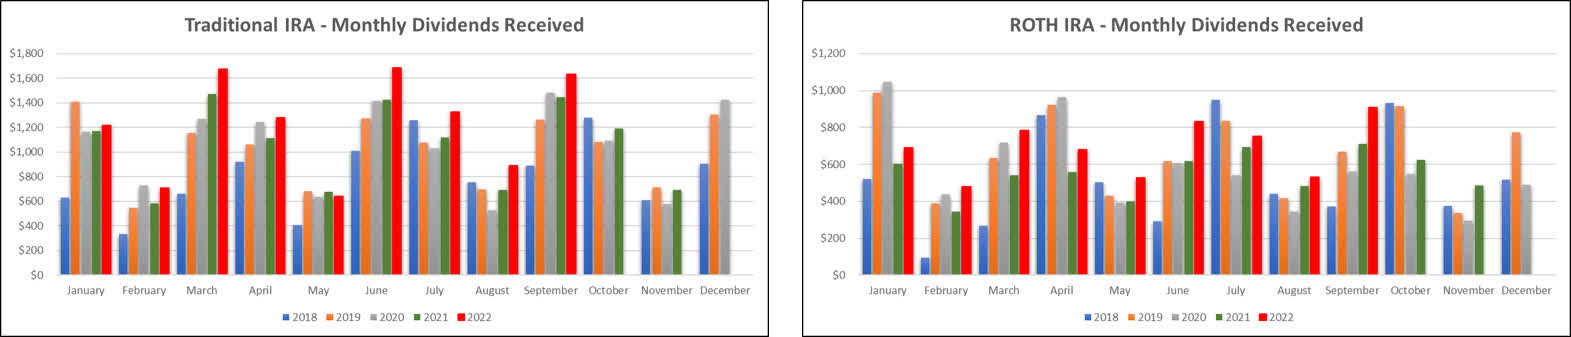
Based on the current knowledge I have regarding dividend payments and share count, the following tables are a basic prediction of the income we expect the Traditional IRA and Roth IRA to generate in FY-2022 compared with the actual results from 2021.
Retirement Projections – September 2022 (CDI)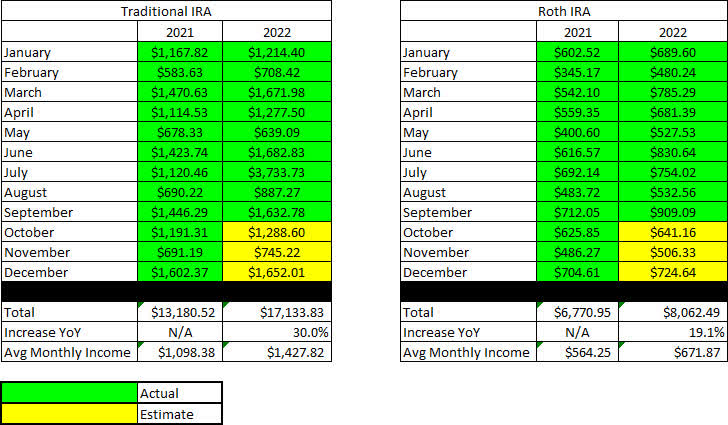
Below is an expanded table that shows the full dividend history since inception for both the Traditional IRA and Roth IRA.
Retirement Projections – September 2022 – Full Dividend History (CDI)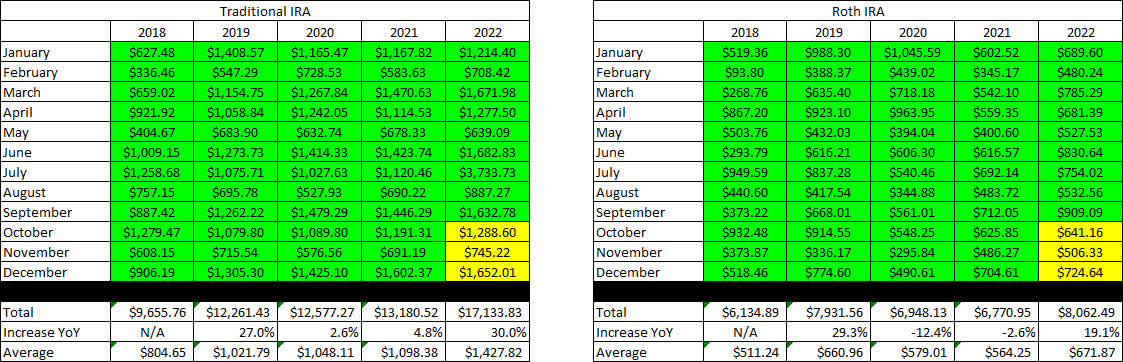
I have included line graphs that better represent the trends associated with John’s monthly dividend income generated by his retirement accounts. The images below represent the Traditional IRA and Roth IRA, respectively.
Retirement Account – Monthly Dividends – September 2022 (CDI)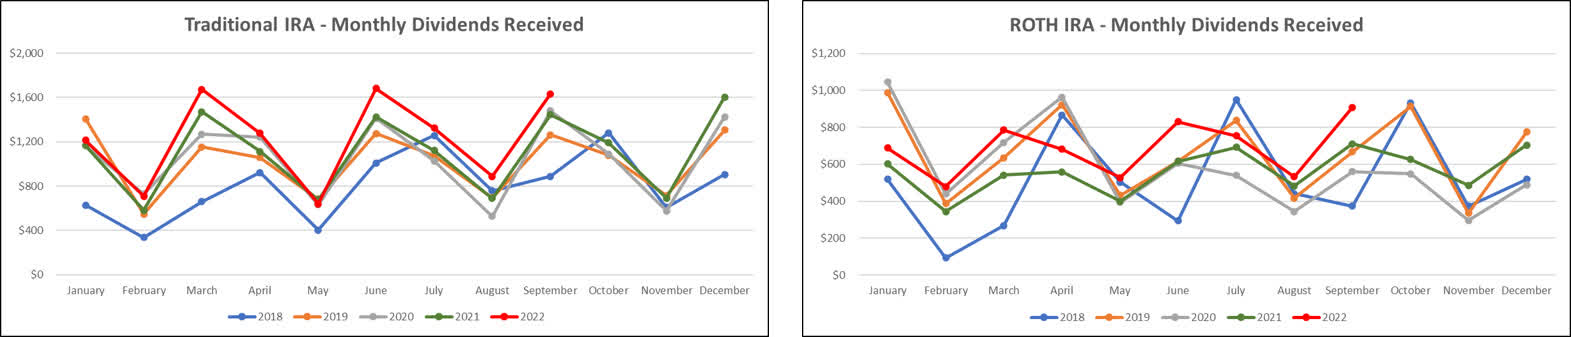
Here is a table to show how the account balances stack up year over year (I previously used a graph but believe the table is more informative).
Retirement Account – Month End Balances – September 2022 (CDI)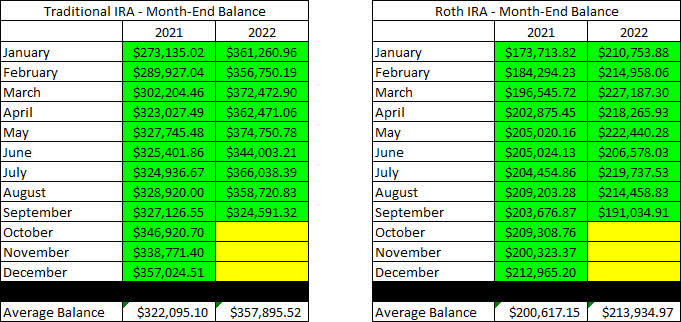
The next images are the new tables that indicate how much cash John had in his Traditional and Roth IRA Account at the end of the month, as indicated on his Charles Schwab statements.
Retirement Accounts – September 2022 – Cash Balances (CDI)
The following two tables provide a history of the unrealized gain/loss at the end of each month in the Traditional and Roth IRAs, going back to the beginning of January 2018.
Retirement Accounts – September 2022 – Unrealized Gain-Loss (CDI)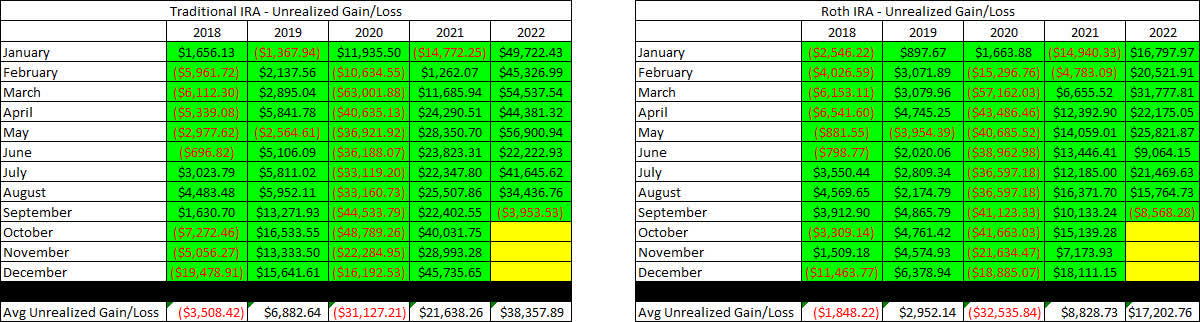
John has finally begun taking disbursements from his Traditional IRA, and he has opted to receive $1,000/month. Based on the dividend income generated he could take up to $1,400/month from the Traditional IRA before his withdrawals would start to negatively impact his principal. Our goal for John is to maintain withdrawals below the dividend income generated for as long as possible.
Traditional IRA Withdrawals – September 2022 (CDI)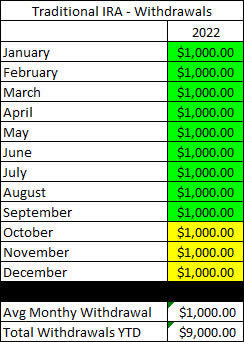
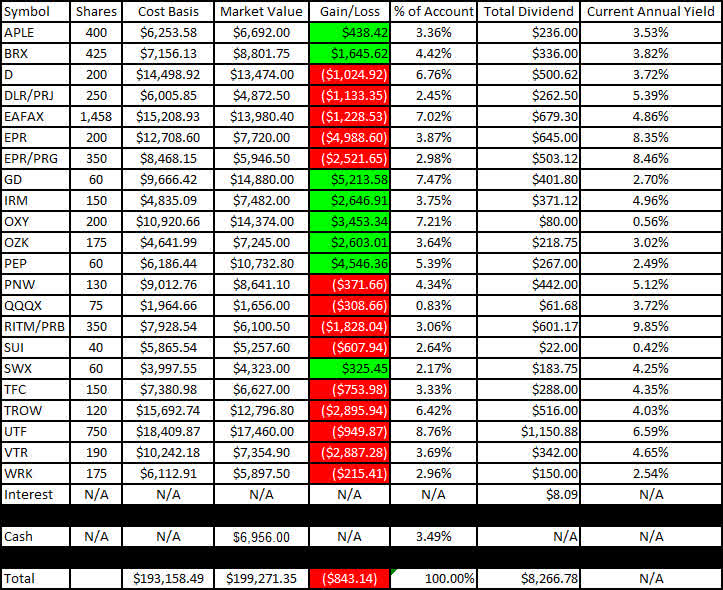
I like to show readers the actual unrealized gain/loss associated with each position in the portfolio because it is important to consider that, in order to become a proper dividend investor, it is necessary to learn how to live with volatility. The market value and cost basis below are accurate as of the market close on October 5, 2022.
Here is the unrealized gain/loss associated with John’s Traditional and Roth IRAs.
Traditional IRA – September 2022 – Gain-Loss (CDI) Roth IRA – September 2022 – Gain-Loss (CDI)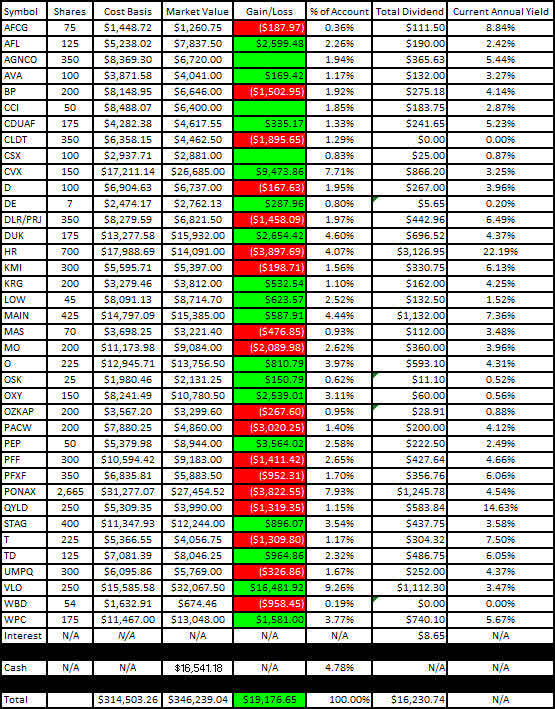
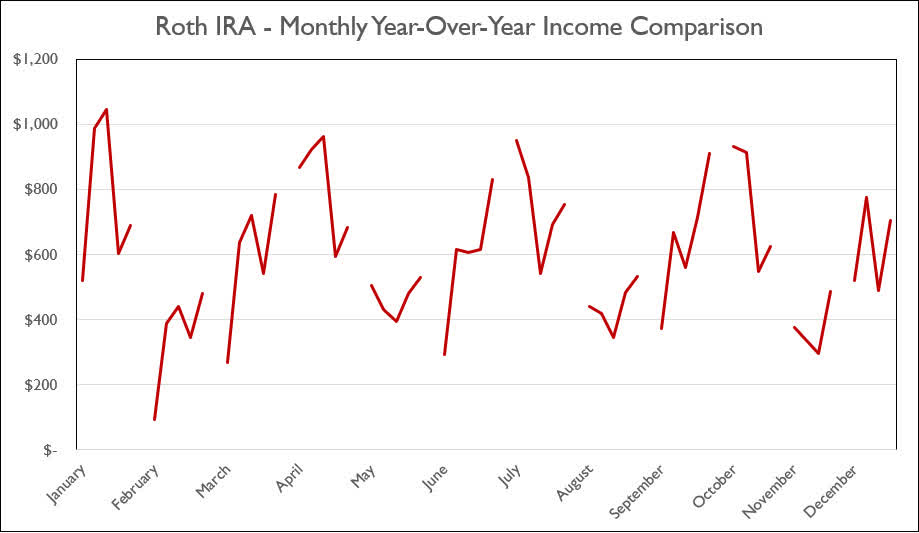
The last two graphs show how dividend income has increased, stayed the same, or decreased in each respective month on an annualized basis. Now that we are in our fifth year of tracking, the trend for each respective month of the year has begun to show interesting trends for when income increases year-over-year.
Traditional IRA – September 2022 – Annual Month Comparison (CDI) Roth IRA – September 2022 – Annual Month Comparison (CDI)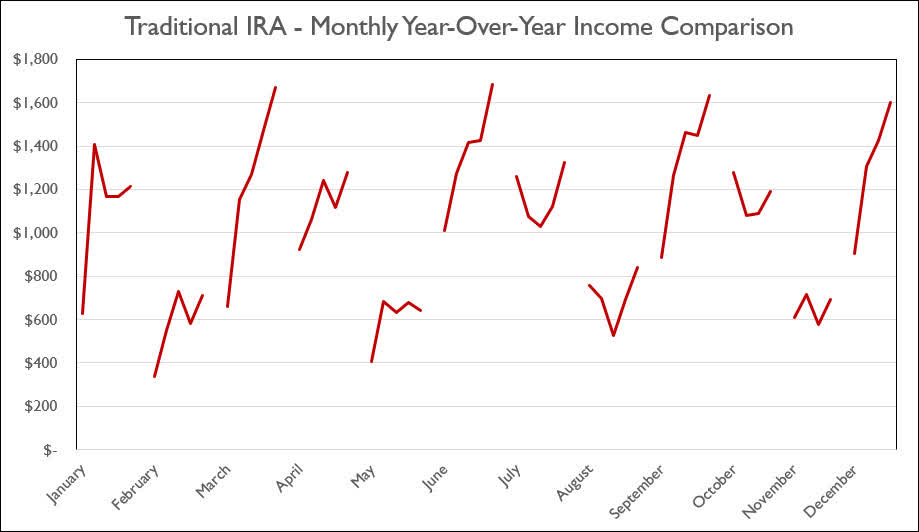
Conclusion
September is the only month so far where the statement balance ended with a negative gain-loss balance (assuming all shares were liquidated on 9/30/2022. This being said, consider the following positives:
- Cash balances up $4.5k YoY in the Traditional IRA.
- Cash balances up $9.5k YoY in the Roth IRA.
- Traditional IRA would have an additional $9k in balances if John had made no withdrawals.
- Traditional IRA income generation is a staggering 30% higher than in 2021. Even if special dividends were removed this number would be close to 15%-20% higher.
- Roth IRA income generation is a solid 19.1% higher than in 2021.
For all of the negative sentiment in the market, we are finding ways to reduce risk and redeploy cash towards overwhelmingly discounted stocks which are allowing us to lock in decade-low yields for stocks like Crown Castle International (CCI), American Tower Corporation (AMT), and Lowe’s (LOW).
The point in saying this is that it’s important to remind yourself why you chose a specific strategy and avoid deviating from that approach when things feel like they are getting a little concerning. The recent drop has been a huge factor in why we have started deploying more cash (this will be seen in my trading update coming this Saturday).
September Articles
I have included the links for John and Jane’s Taxable Account and Jane’s Retirement Account articles for the month of September below.
The Retirees’ Dividend Portfolio: John And Jane’s September Taxable Account Update
Article Format: Let me know what you think about the format (what you like or dislike) by commenting. I appreciate all forms of criticism and would love to hear what I can do to make the articles more useful for you!
In John’s Traditional and Roth IRAs, he is currently long the following mentioned in this article: AFC Gamma (AFCG), Aflac (AFL), Apple Hospitality REIT (APLE), Avista (AVA), BP plc (BP), Brixmor Property Group (BRX), Crown Castle (CCI), Canadian Utilities (OTCPK:CDUAF), Chatham Lodging Trust (CLDT), Chevron (CVX), CSX (CSX), Dominion Energy (D), Deere (DE), Digital Realty Preferred Series J (DLR.PJ), Duke Energy (DUK), Eaton Vance Floating-Rate Advantage Fund (EAFAX), EPR Properties (EPR), EPR Properties Preferred Series G (EPR.PG), General Dynamics (GD), Healthcare Trust of America (HTA), Iron Mountain (IRM), Kinder Morgan (KMI), Kite Realty Group (KRG), Lowe’s (LOW), Main Street Capital (MAIN), Masco (MAS), Altria (MO), New Residential Investment Corp. Preferred Series B (NRZ.PB), Realty Income (O), Oshkosh (OSK), Occidental Petroleum Corp. (OXY), Bank OZK (OZK), Bank OZK Preferred Series A (OZKAP), PacWest Bancorp (PACW), PepsiCo (PEP), iShares Preferred and Income Securities ETF (PFF), VanEck Vectors Preferred Securities ex Financials ETF (PFXF), Pinnacle West (PNW), PIMCO Income Fund Class A (PONAX), Nuveen Nasdaq 100 Dynamic Overwrite Fund (QQQX), Global X Funds Nasdaq 100 Covered Call ETF (QYLD), STAG Industrial (STAG), Sun Communities (SUI), Southwest Gas (SWX), AT&T (T), Toronto-Dominion Bank (TD), Truist Financial (TFC), T. Rowe Price (TROW), Cohen & Steers Infrastructure Fund (UTF), Valero (VLO), Umpqua Holdings (UMPQ), Ventas (VTR), WestRock (WRK), Warner Bros. Discovery (WBD), and W. P. Carey (WPC).
Be the first to comment