DNY59
Investment Thesis
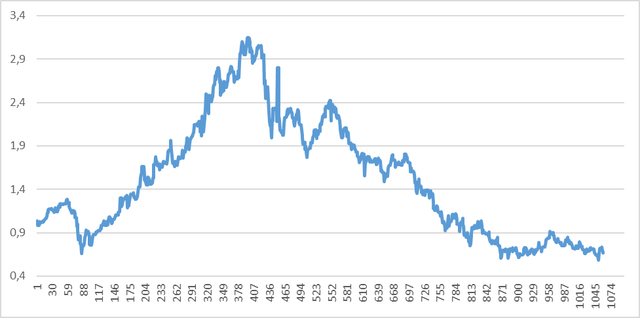
The market has been brutal for growth and tech stocks, with no end in sight. Although the composition of the portfolio is definitely different than Ark (ARKK), it has nevertheless followed the same general trend, with a peak in early 2021 (becoming a multi-bagger in about a year) followed by what by now is amounting to nearly two years of persistent declines. The net result of the initial spike followed by the collapse is that my net worth is still below where it was two years ago, despite consistently adding to the portfolio over time.
So while the stock market is often touted as a reliable method for wealth generation, after the first three years of being an investor so far it has only served as a wealth destroyer.
Background
I have updated on the portfolio on a three to six monthly basis, so those previous articles could serve as background, although I will contain the most relevant information below.
When I became an investor in late 2019, I initially looked at dividend stocks. However, upon realizing the potentially incredible (“multi-bagger”) gains that can be achieved in growth stocks, I quickly pivoted my strategy before I had even bought a single stock. After some research, my initial portfolio consisted of NIO (NIO), Pinterest (PINS), DocuSign (DOCU) and Twilio (TWLO), with IIPR (IIPR) as a dividend growth stock. The idea was to hold these stocks for many years.
Of course, little did I know that it was just months before a worldwide pandemic. I didn’t adjust the portfolio during the initial crash and volatility, and so my portfolio became immediately successful in the new work-from-home age that benefited these kinds of stocks. Pinterest and NIO propelled my portfolio to great heights in the second half of 2020, along with Roku (ROKU), Lemonade (LMND), Palantir (PLTR) et al.
Unfortunately, it wouldn’t last long. As I had tried to be disciplined about following my first principle of not selling any stocks (in order to reap their full potential upside), it never occurred to me (likely due to lack of experience) that when your portfolio goes up by 3x in one year, that this represents a decade or more of average market gains, and that the downside risk starts to become much higher: although many of my stocks had strong financials, only Zoom (ZM), which I never owned, was able grow its revenue by >>100%.
Alas, I remember around two years ago one commenter mentioned my TipRanks profile, which apparently was rated as very top performance. Instead, more recently some commenters have used the same profile to draw the exact opposite conclusion.
Thoughts
One growth investor I follow on Twitter, who has a very concentrated hyper-growth portfolio and makes use of leverage, had a very strong multi-year performance of around triple digits CAGR, but this investor as well has been hit by the growth decline since mid-Q4 2021 (with a YTD decline of ~65%), driven by interest rates and inflation. So clearly, perhaps there is some solace in knowing that it is/has been a rough time for many investors.
Indeed, objectively speaking the valuations of SaaS companies have compressed well below their historical average, which is of course brutal given that they had reached an all-time high in the wake of the COVID bubble.
So while the current performance of the portfolio remains discouraging, fact also remains that the current inflation and interest rate prints are historically high as well (not to mention the energy/food crisis and Ukraine). Once the economy stabilizes, there might be some upside simply from valuations reversing back to the mean. In addition, and this could be both a headwind and a tailwind, unless it turns out the growth stocks I have invested in aren’t able to fulfill the premise of growing at elevated (20%+) rates for many years, then there should also be upside from the stocks meeting their investment theses over time.
Portfolio
The portfolio consists of 42 positions, although the idea was to have most of the concentration in just a handful stocks (which is more or less the case). The table below lists them in order of nest size (invested dollars, so not current value).
|
Stock |
Ticker |
Average open $ |
P/L % |
|
PubMatic |
(PUBM) |
29.4 |
-49 |
|
SentinelOne |
(S) |
24.3 |
-31 |
|
Upstart |
(UPST) |
55.5 |
-65 |
|
|
(PINS) |
26.4 |
-8 |
|
Teladoc Health |
(TDOC) |
126 |
-77 |
|
Asana |
(ASAN) |
21.9 |
-19 |
|
JFrog |
(FROG) |
35.5 |
-37 |
|
Invitae |
(NVTA) |
7.1 |
-60 |
|
Alteryx |
(AYX) |
67.4 |
-35 |
|
Alibaba |
173 |
-53 |
|
|
Unity |
(U) |
25.3 |
37 |
|
Innovative Industrial Properties |
(IIPR) |
91.8 |
22 |
|
DiDi |
4.8 |
-49 |
|
|
Smartsheet |
(SMAR) |
38.6 |
-27 |
|
Sumo Logic |
(SUMO) |
19.4 |
-61 |
|
Lemonade |
(LMND) |
40.8 |
-51 |
|
Affirm |
(AFRM) |
37.7 |
-64 |
|
Fastly |
(FSLY) |
63.0 |
-86 |
|
Global-E |
(GLBE) |
48.9 |
-58 |
|
monday.com |
(MNDY) |
116 |
-17 |
|
Twilio |
(TWLO) |
105 |
-53 |
|
Fiverr |
(FVRR) |
163 |
-77 |
|
Roku |
(ROKU) |
142 |
-61 |
|
Intel |
(INTC) |
37.1 |
-19 |
|
Palantir |
(PLTR) |
15.3 |
-52 |
|
Elastic |
(ESTC) |
127 |
-54 |
|
SoFI |
(SOFI) |
8.7 |
-40 |
|
American Well |
(AMWL) |
19.4 |
-81 |
|
Riskified |
(RSKD) |
10.3 |
-51 |
|
UiPath |
(PATH) |
22.4 |
-44 |
|
Duolingo |
(DUOL) |
102 |
-34 |
|
Nio |
(NIO) |
3.0 |
251 |
|
MercadoLibre |
(MELI) |
1525 |
-37 |
|
DocuSign |
(DOCU) |
71.3 |
-35 |
|
ZoomInfo |
(ZI) |
61.0 |
-56 |
|
Peloton |
(PTON) |
110 |
-91 |
|
Beyond Meat |
(BYND) |
144 |
-91 |
|
Etsy |
(ETSY) |
202 |
-44 |
|
Sea |
(SE) |
194 |
-71 |
|
Splunk |
(SPLK) |
224 |
-65 |
|
Digital Turbine |
(APPS) |
17.2 |
0 |
|
Marqeta |
(MQ) |
6.6 |
0 |
Discussion
PubMatic was one of the main stocks I kept adding to in 2021 because it was already valued very low, and its potential seemed similar to The Trade Desk (TTD). However, it seems its performance was likely a bit exaggerated by COVID, as it hasn’t continued to beat-and-raise, and growth has currently evaporated. A similar story, but to an even larger extent, holds for Upstart, never mind Teladoc Health. As such, the only stock with “just” a single-digit decline in the dozen largest positions is Pinterest, although its era of high growth also seems to have finished.
Of the other top positions, I remain fairly bullish about SentinelOne, Asana, JFrog and Alteryx, which have declined by less than 40%. Hence, if valuations were to reverse back to more historical figures (perhaps once interest rates and inflation also reverse), then these would likely be around breakeven, and their long-term growth opportunities for continued growth still seem compelling.
There are two stocks (besides NIO) notably in the green currently: IIPR and U. First, IIPR was one of the first stocks of the portfolio, initially bought in the low $70s, meant as a dividend growth stock, but I sold out of this one a year ago near the top (in order to buy stocks like UPST and AFRM). Seeing how it had declined back to $90, not much higher than in late 2019 despite strongly improved financials, it seemed a nice opportunity to get some dividend stability back in the portfolio. A similar reasoning made me add to Intel.
The Unity position is the result of my strong investment in ironSource in the first half of this year, as it became a top 3 or so position. IS unfortunately merged with U in a deal that made U profit from IS shareholders who got ripped, as discussed here: ironSource Sells Out To Unity. However, as my broker didn’t automatically convert the IS position to U, I bought a few stocks instead of just Unity: around 70% split evenly between U and S, and the rest split between AYX, SMAR, ASAN and MNDY. Although the Unity position is up a bit (both stocks were quite volatile in the last several months) already, in the wake of the recent rally due to the somewhat weaker inflation print, the IS position was sold at quite a loss.
Portfolio performance
The chart suggests the portfolio has bottomed earlier this year, and has remained quite stable since, although the August rally didn’t continue.
Nevertheless, there isn’t much to cheer about, as this means the portfolio is now worth only 65% of the dollars that were initially invested. Note that since I have either partly or fully sold out of some positions over time (such as NIO, IIPR and IS), the actual amount of dollars that have been invested is bigger than the nest egg, which means the actual performance is even worse than the 35% decline just cited.
By that way, the recent growth stock rally due to the weaker than expected inflation print, which was so much talked about? It’s hardly even visible on this chart: the two-day rally just reversed the dip that came before it! (There is someone on Twitter who posts cautionary tweets each time the market rallies by 0.01%, figuratively speaking. However, the market is clearly still down a ton compared to a year ago, never mind two years ago, so let’s please not pretend as if stocks aren’t allowed to go up sometimes as well. A 10% or even 20% rally after a 90% decline still doesn’t change much.)
Investor Takeaway
As mentioned, my net worth has been flat (at best…) for the last two years. In recent months and quarters, some strong performers in late 2020, such as ROKU, DOCU and TWLO, have even declined below their COVID lows. Even PubMatic, which became my top stock in 2021 as it seemed a (profitable) growth stock valued as a value stock, has now declined by 50%. Overall, the “wealth destruction” I have incurred for being an investor over the last year now amounts to a loss around 35% of the nest egg, down from a multi-bagger gain in late 2020.
Since I had been eager since the beginning of the decline a year ago to buy the dips, I have been less active to buy any further dips in recent months. Nevertheless, some notable portfolio activity includes rebuilding my IIPR position, adding to INTC, and buying a lot more U and S as my broker sold IS in the wake of its merger. Among others, I have also added to UPST and AFRM, as well as the trifecta of work management stocks (ASAN, MNDY and SMAR, weighted towards ASAN).


Be the first to comment