

cemagraphics
Investment Thesis
Although Polygon (MATIC-USD) top holders might have slightly distributed their holdings, many average stakeholders might have added more coins to their pack. For the moment, the network adoption has expanded while the network value is underestimated. This often leads to the formation of the local bottom because the buying momentum can be going back.
The Polygon Network Growth Is Strong
One of the common facets of on-chain analysis is the network growth, which shows how many new users have joined the ecosystem. As seen in the following chart, the total number of unique addresses on the Polygon POS chain has gradually increased since MATIC’s inception. It could be healthy for the network growth in the long term when new distinct addresses have been created on a daily basis and new users might have adopted the Polygon network.
The network growth is steady as new distinct addresses have been created on a daily basis. (Polygonscan)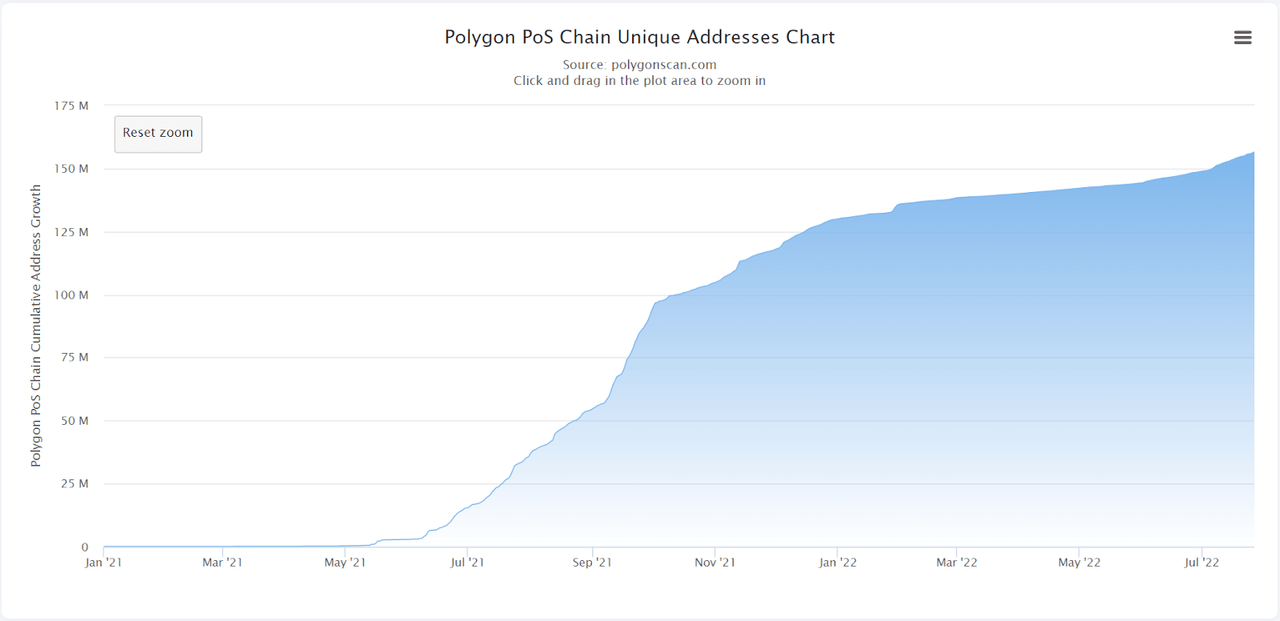
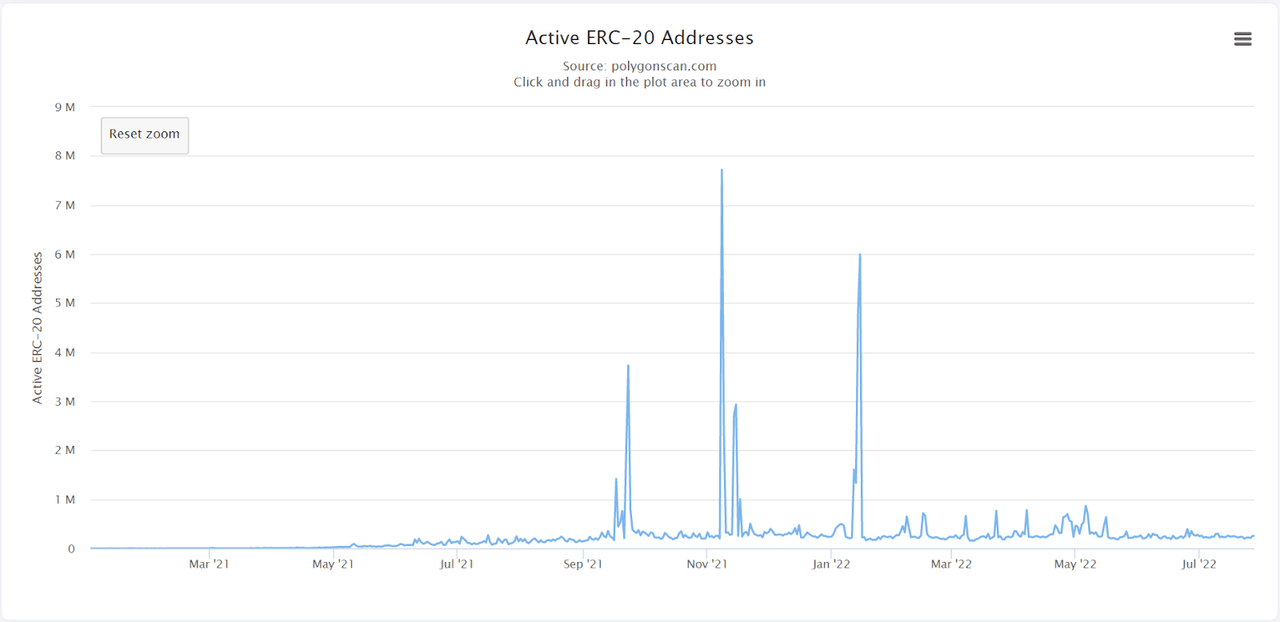
In the meantime, the active Polygon POS chain address chart shows the daily cumulative count of unique active addresses on the network, including senders and receivers. The ERC-20 address chart displays the daily sum count of unique addresses that were both senders or receivers as a ERC-20 token on the network. These data have remained stable during the recent bear market, suggesting that network activity remains strong.
The unique active addresses on the network suggests that network activity is heightened. (Polygonscan) The ERC-20 active addresses suggest that the activity on the network is heightened. (Polygonscan)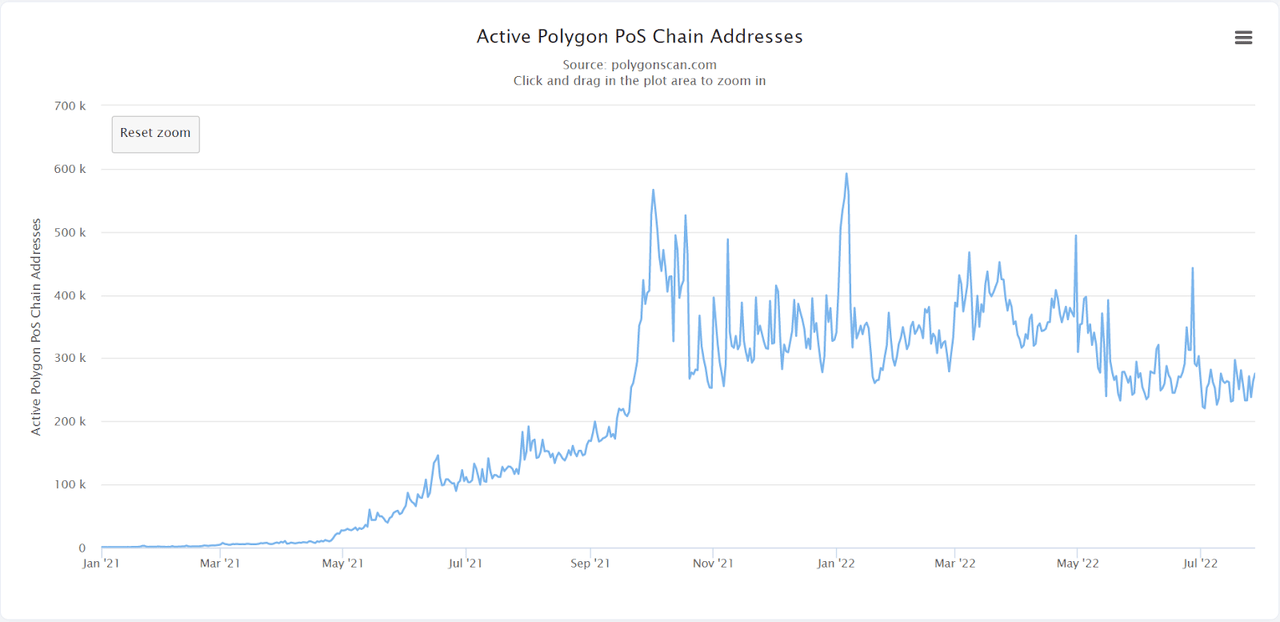
Polygon Utility Is High During The Bear Market
Gas price is how much of the fee that must be paid to miners for processing transactions on the Polygon network. The gas price is defined by an auction mechanism wherein those transactions in the waiting list that accept higher fees will be consecutively selected to execute in a decreasing order. The Polygon POS chain average gas price data illustrates the daily average gas price used of the network. This data has gradually increased, which shows not only the intense network activity but also the aggressiveness among those who would like to conduct their transactions faster.
The average gas price data indicates the increased network activity and the competition among senders. (Polygonscan)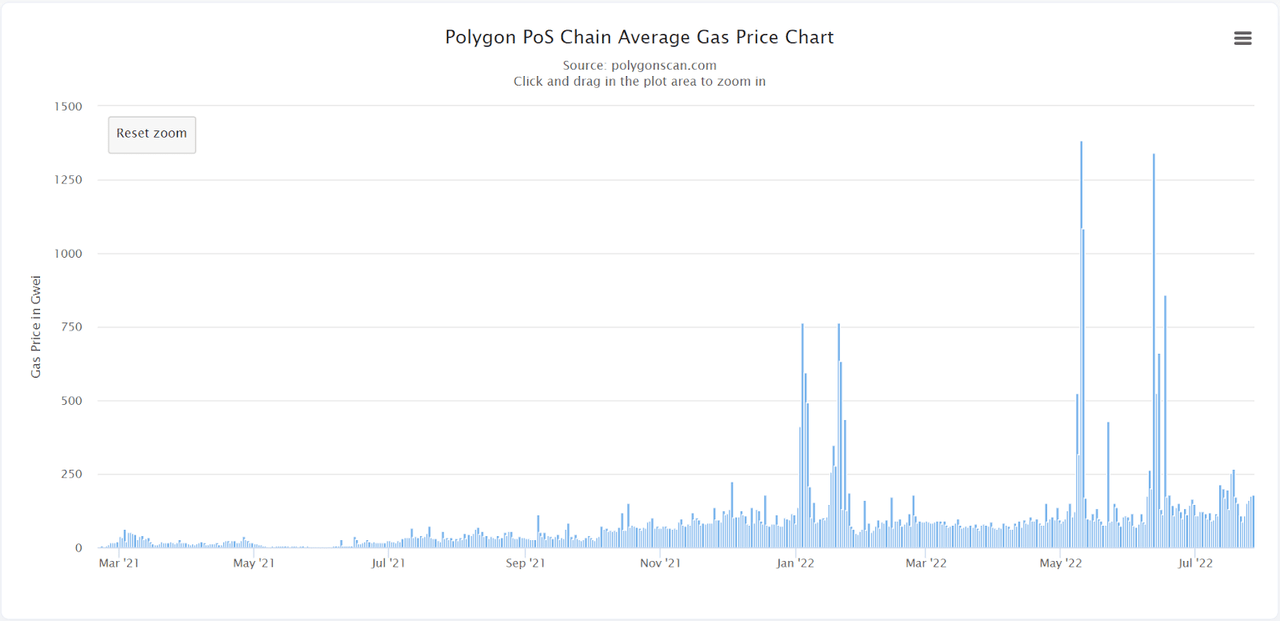
The maximum cost that a user is willing to spend on executing a transaction on the Polygon blockchain is called the gas limit. This is the amount that is paid to miners for their computational effort in verifying transactions. Additionally, setting the gas limit too low may lead to unsuccessful transactions. The Polygon POS chain average gas limit chart displays the historical daily average gas limit of the network. This data remains stable so does the network activity and users’ willingness to transact on the network.
The average gas limit remains stable so does the network activity. (Polygonscan)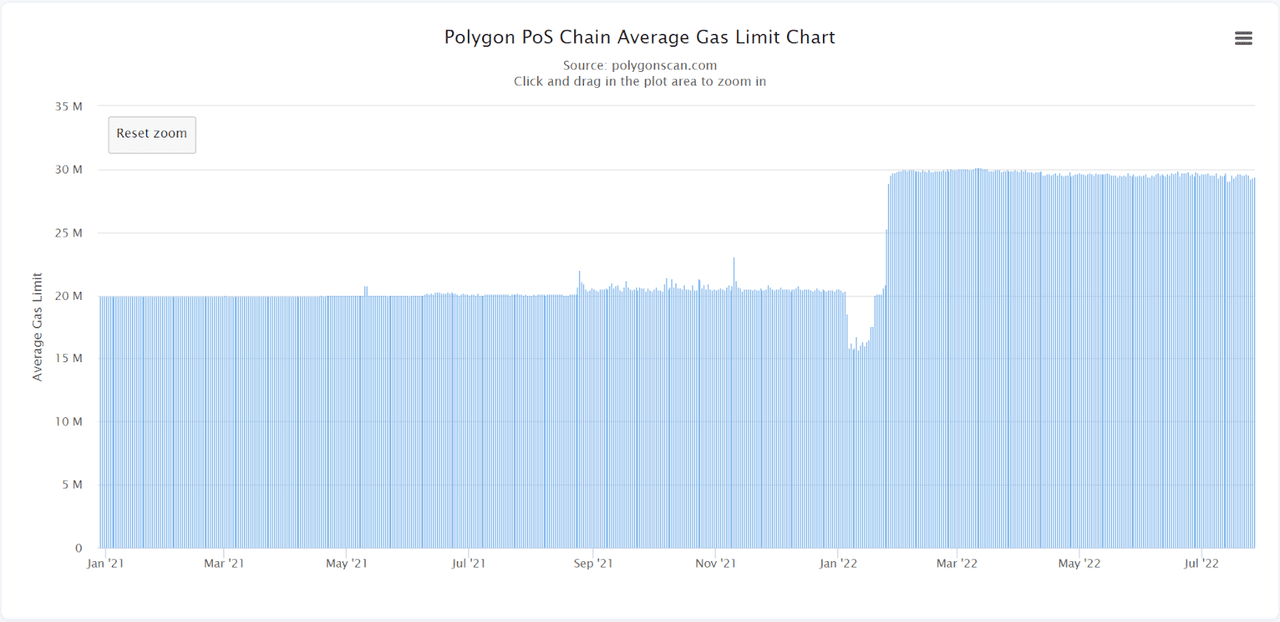
Gas is the measuring unit of computational resources required to execute specific operations on the Polygon network. Each operation that can be performed by a transaction or contract on the network costs a specific amount of gas. The more computational work required, the more gas needed. The Polygon POS chain daily gas used is defined as the historical total amount of gas used daily over the network. This data has remained sustained indicating that network activity is heightened during this bear market.
Polygon network activity is heightened as daily gas used data has been maintained. (Polygonscan)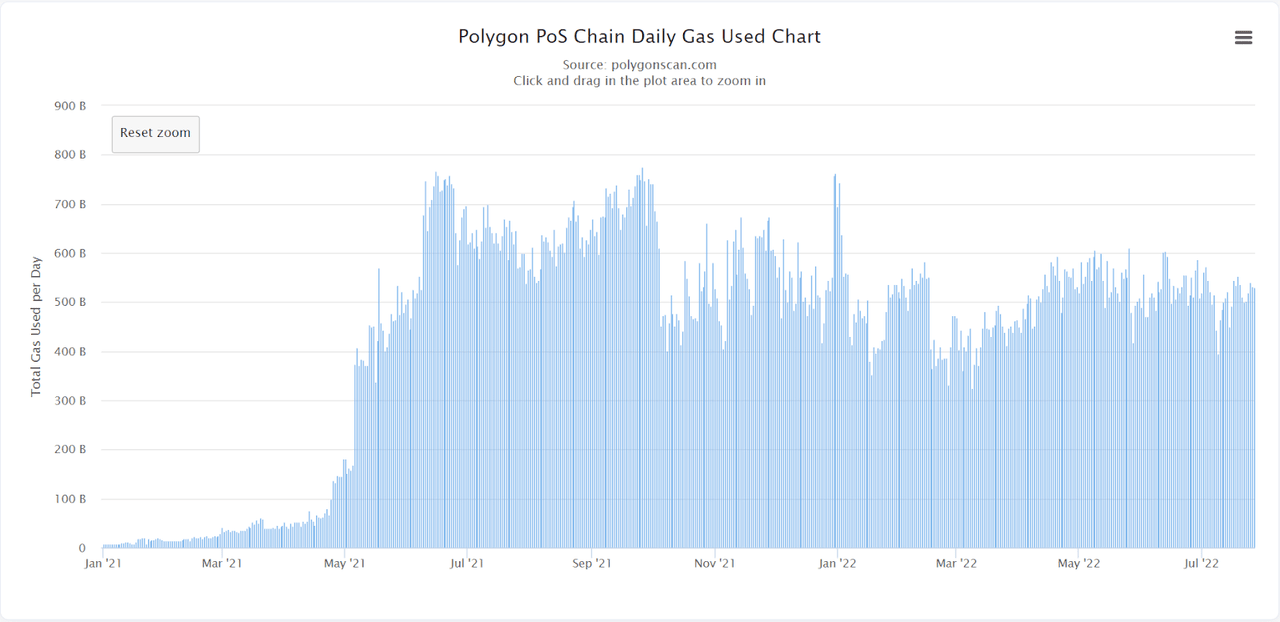
The Polygon POS chain network utilization is calculated as the ratio of the average gas used to limit gas in percent. It estimates the actual gas used in comparison to the maximum gas on average. In other words, it shows how properly and aggressively transactions are conducted on the Polygon network. This data was not falling during the 2021 bear market, and has leveled off after a drop in early 2022. It indicates that Polygon network utility has maintained the status quo during the downside market, which can make a huge contribution to the network growth.
Polygon network utility has maintained the status quo making a huge contribution to the network growth. (Polygonscan)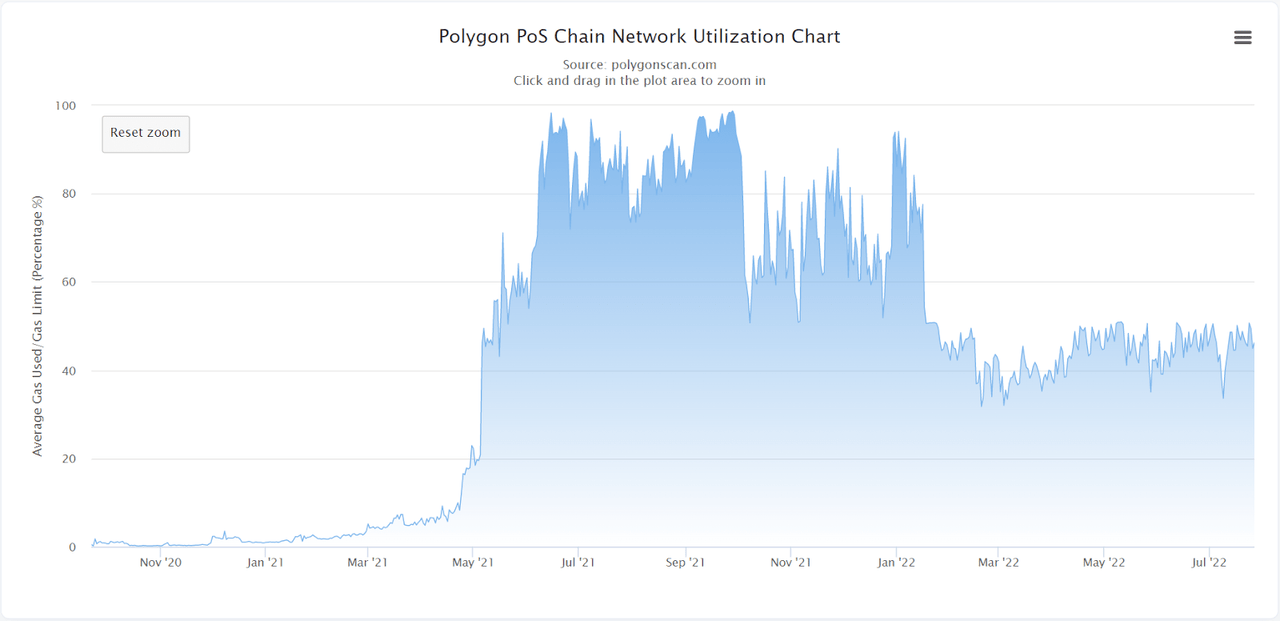
Asset’s Distribution
According to IntoTheBlock, the asset allocation is mostly held by whales with the balance of nearly 71.23% of the circulating supply while investors and retailers hold the remainder of 14.42% and 14.36%, respectively.
Where:
-
Whales are attributed to addresses holding over 1% of the circulating supply.
-
Investors are attributed to addresses holding from 0.1% to 1% of the circulating supply.
-
Retails are attributed to addresses holding less than 0.1% of the circulating supply.
Whales hold 71.23%, Investors hold 14.42%, Retails hold 14.36%. (IntoTheBlock)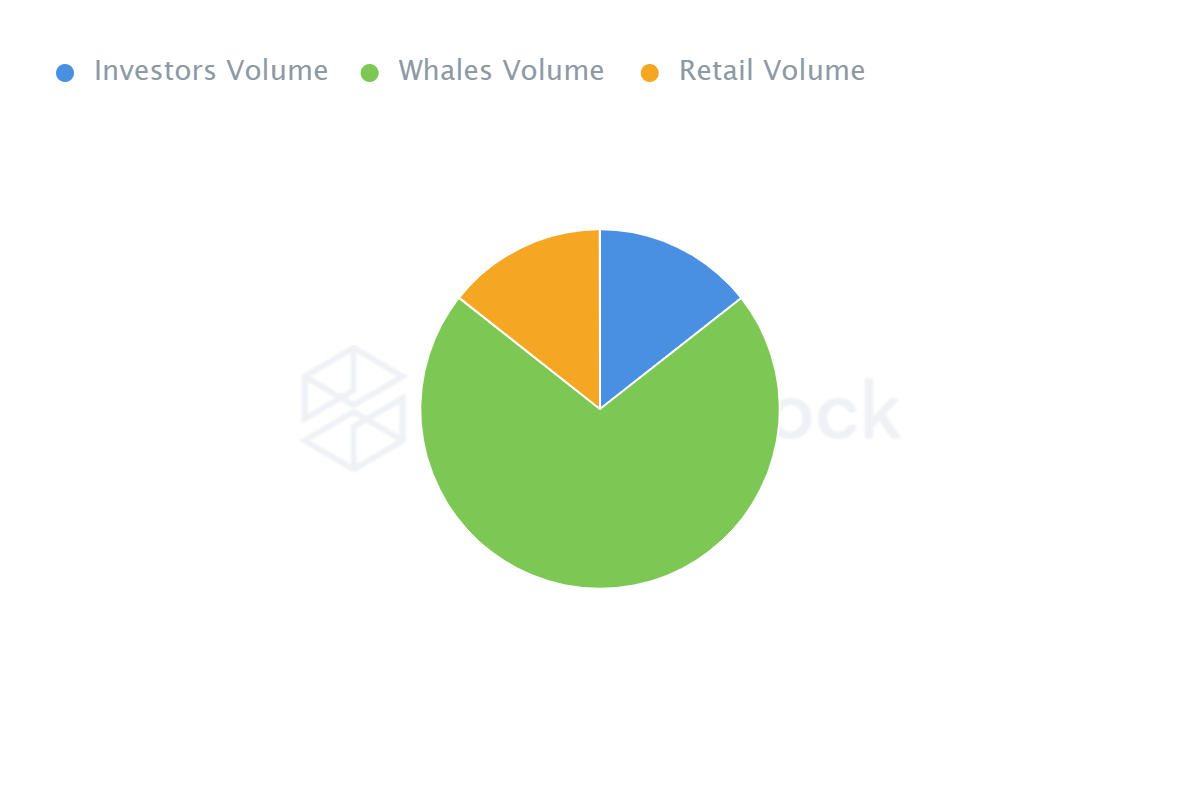
In terms of stakeholders’ allocation, the number of traders who are using coins for speculative purposes has gradually decreased since early 2022, and just slightly moved up since the recent dip. At the same time, the number of those long-term investors who hold their coins over one year has gradually increased since early 2022. This may be inferred from the network utility as holders want to take advantage of their coins thanks to usable decentralized applications to earn some profit. It can make a huge contribution to the network sustainability in the long term, and reduce the downside risk.
Long-term investors who hold their coins over one year has gradually increased since early 2022 (IntoTheBlock)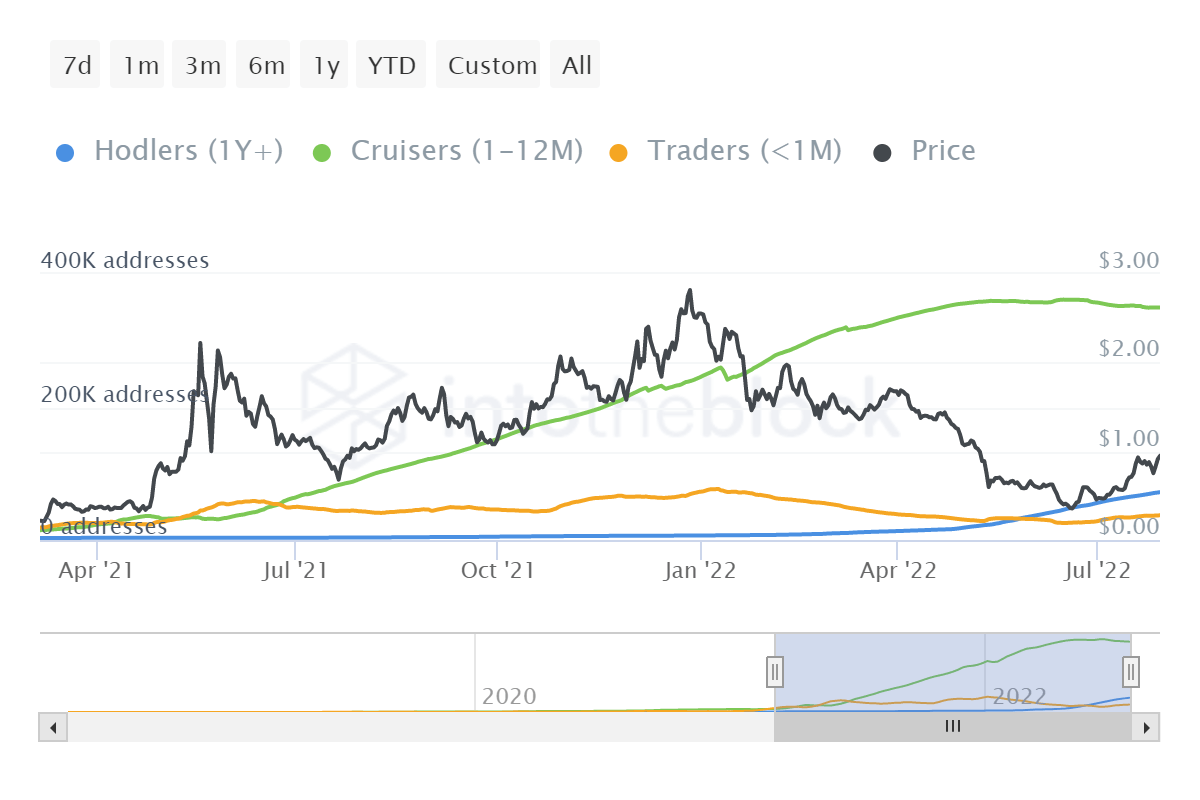
Whales Have Moved Off When Holders In Loss
Regarding the network’s profitability, the historical in/out of the money metric depicts the holders’ state whether they are in profit (in the money), break-even (at the money) or loss (out of the money) on their positions. In other words, it displays the proportion of addresses that are in profit or loss if they sell at the current price. In the following figure, most addresses are out of the money as the current price is lower than their cost of acquisition. It means that there was more selling pressure from holders trying to recover their positions to reach their average cost and break-even. This state has almost reached the maximum in selling momentum and now the momentum is likely to be back on buyers’ side.
The momentum is back on buyers’ side as shown in the In/Out of money metric. (IntoTheBlock)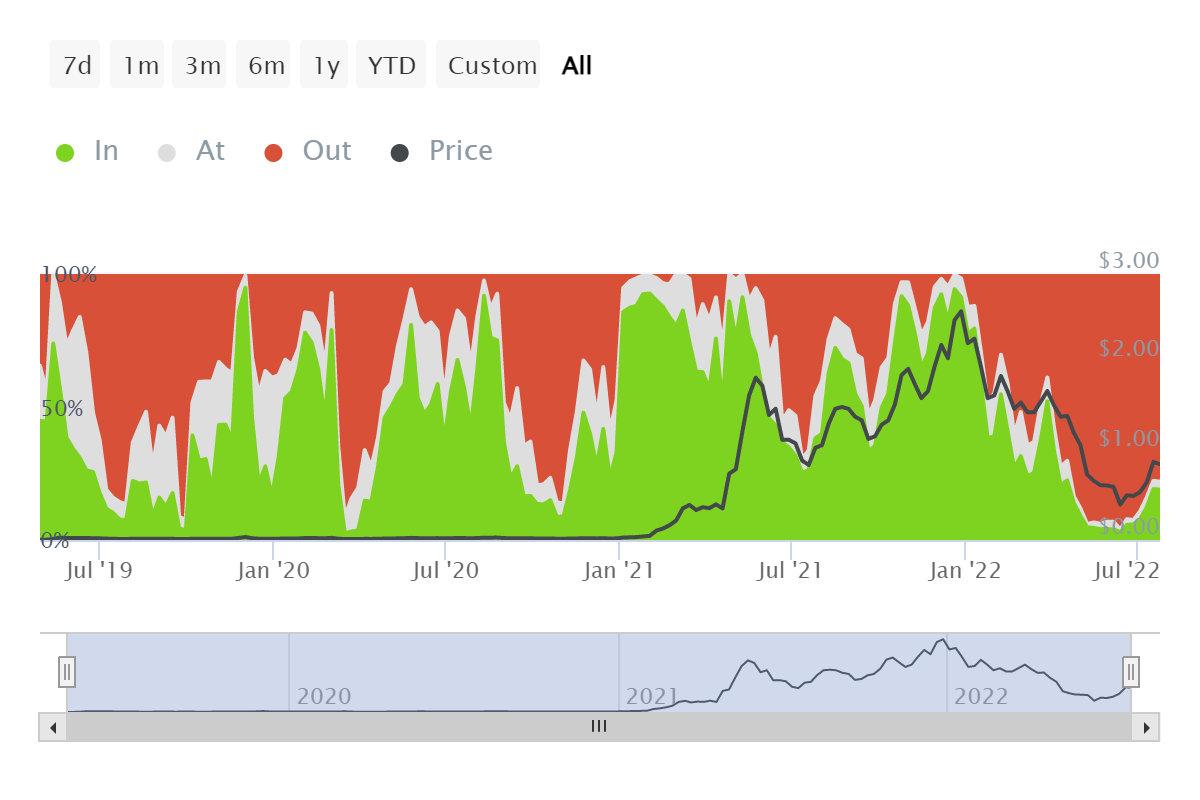
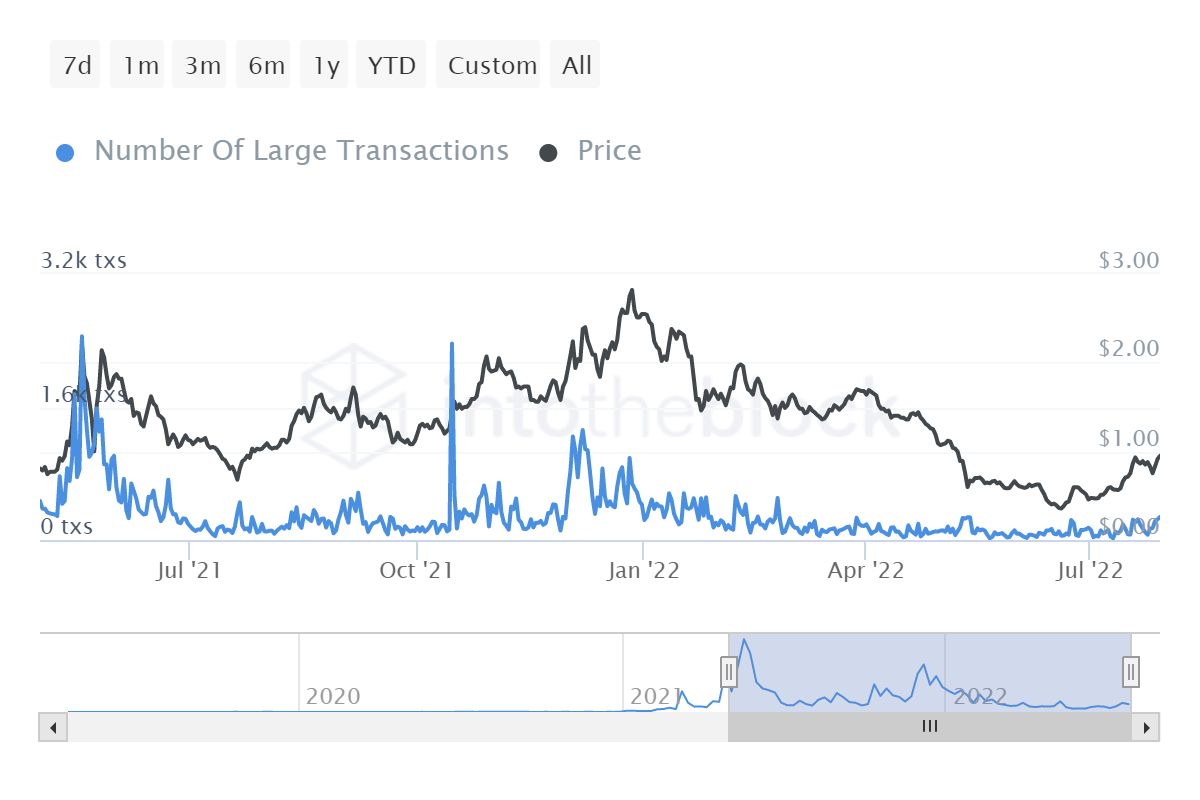
Furthermore, the large transactions volume metric measures the aggregate amount of transactions that is more than $100,000. The number of large transactions metric counts the total number of transactions that is larger than $100,000. This kind of transaction is not assigned to retail traders, and illustrates the behavior of whales’ and institutions’ transactions. These data have recently increased as whales have been active, which often results in a small pump.
The aggregate amount of transactions that is greater than $100,000 has begun to be volatile. (IntoTheBlock) The total number of transactions that is greater than $100,000 has slightly moved up. (IntoTheBlock)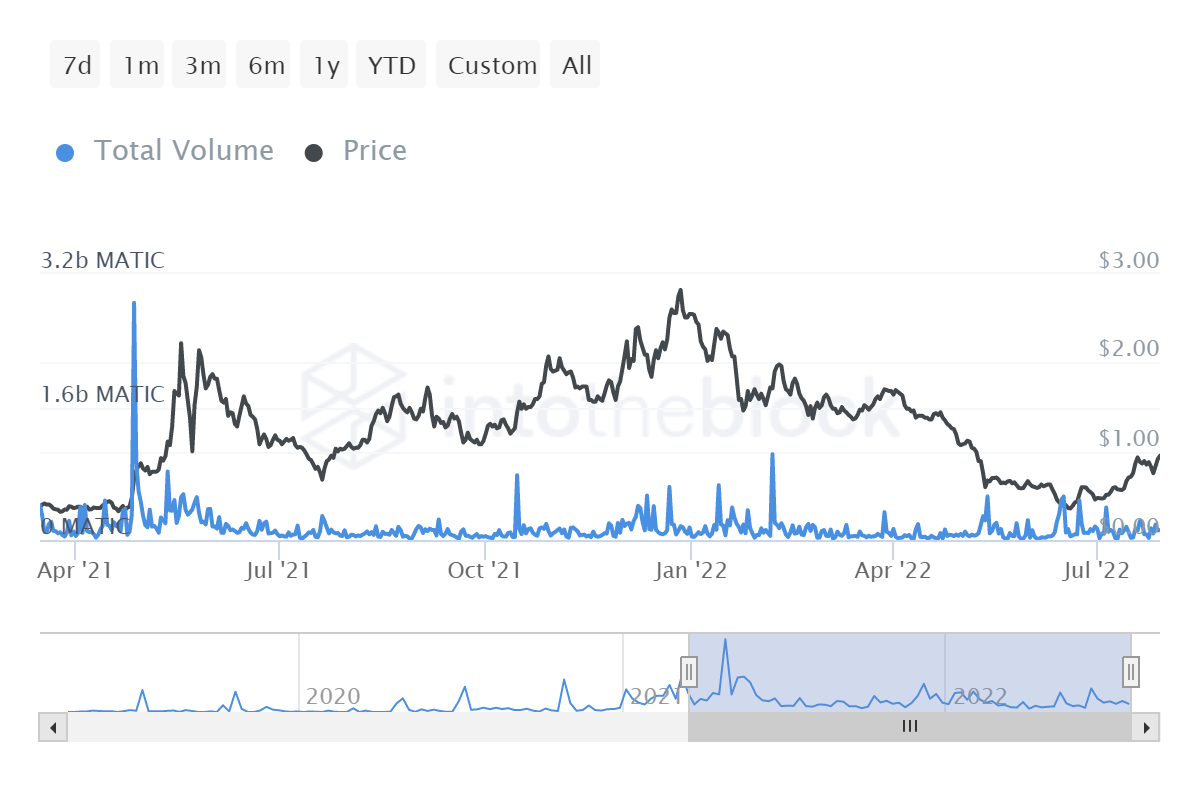
Stakeholders Have Strong Hands
Looking at the total number of unique addresses that hold at least a thousandth of the current supply of MATIC that are available in a window of time, this data has steadily increased since the Polygon’s inception and has leveled off since May 2021 as of the bear market. It means that these stakeholders have accumulated their coins and tightly held their holding throughout this bear market.
The number of unique addresses holding at least 0.1% supply has remained stable since May 2021. (CoinMetrics)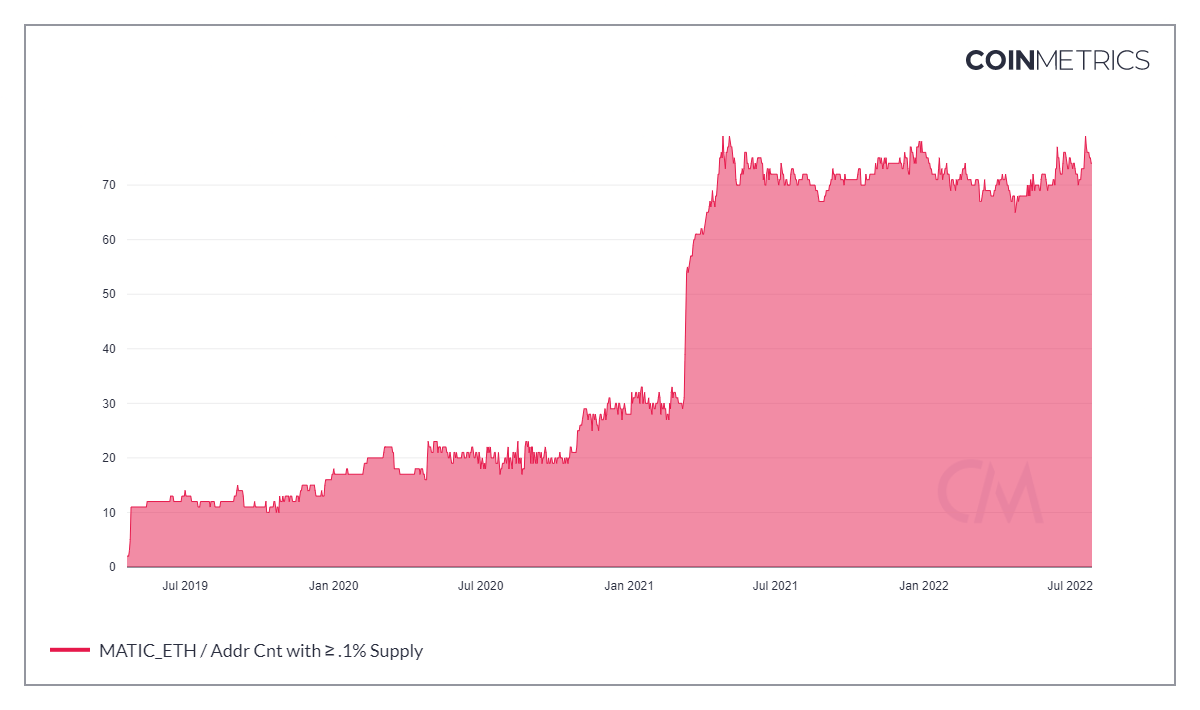
Meanwhile, observing the total number of unique addresses owning at least one ten-thousandth of the current supply of MATIC that are available in a specific interval of time, this data has steadily increased since the Polygon’s inception despite the recent bear market. This may not be the top holders changing their addresses due to the network growth and increasing transaction fee. It suggests that there may be more average whales who have adopted the Polygon network.
The number of unique addresses holding at least 0.01% supply has increased since MATIC’s inception. (CoinMetrics)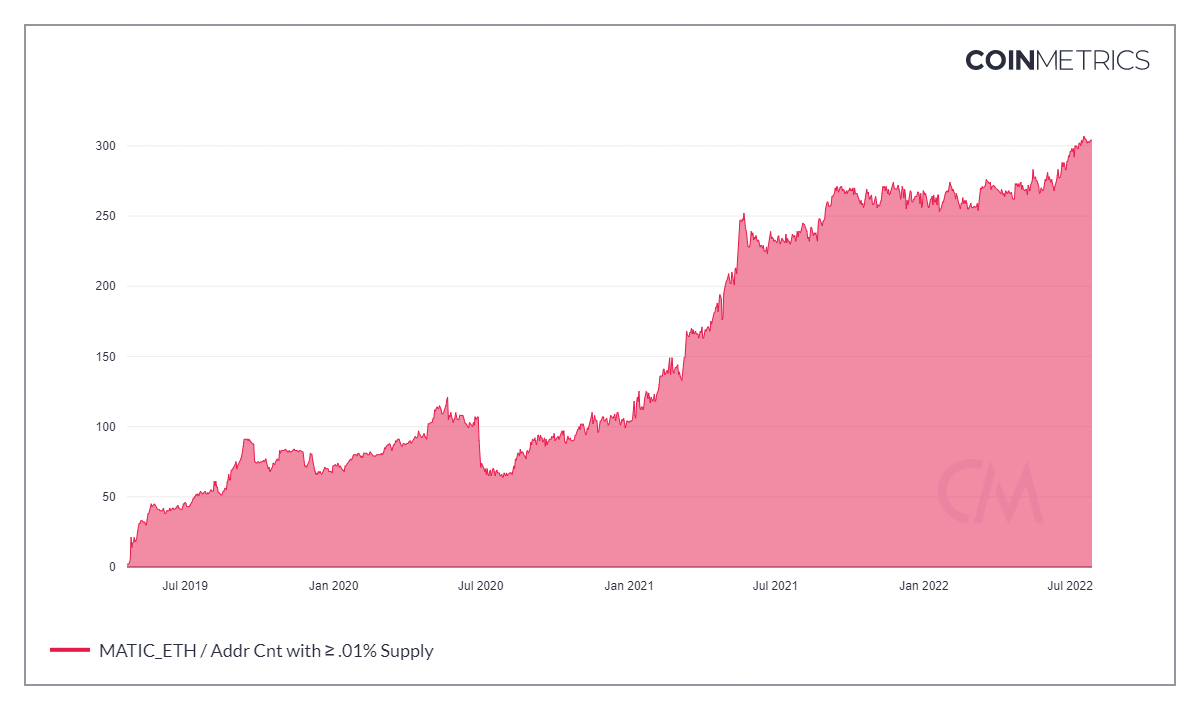
In addition, the bands of the total number of unique addresses holding at least 10,000, 100,000, and 1,000,000 native units in a window of time have grown. It is reasonable to deduce that new stakeholders might have adopted the network and this can also be seen in the number of new addresses being created in the first paragraph.
The total number of unique addresses holding at least 10,000, 100,000, and 1,000,000 coins have grown. (CoinMetrics)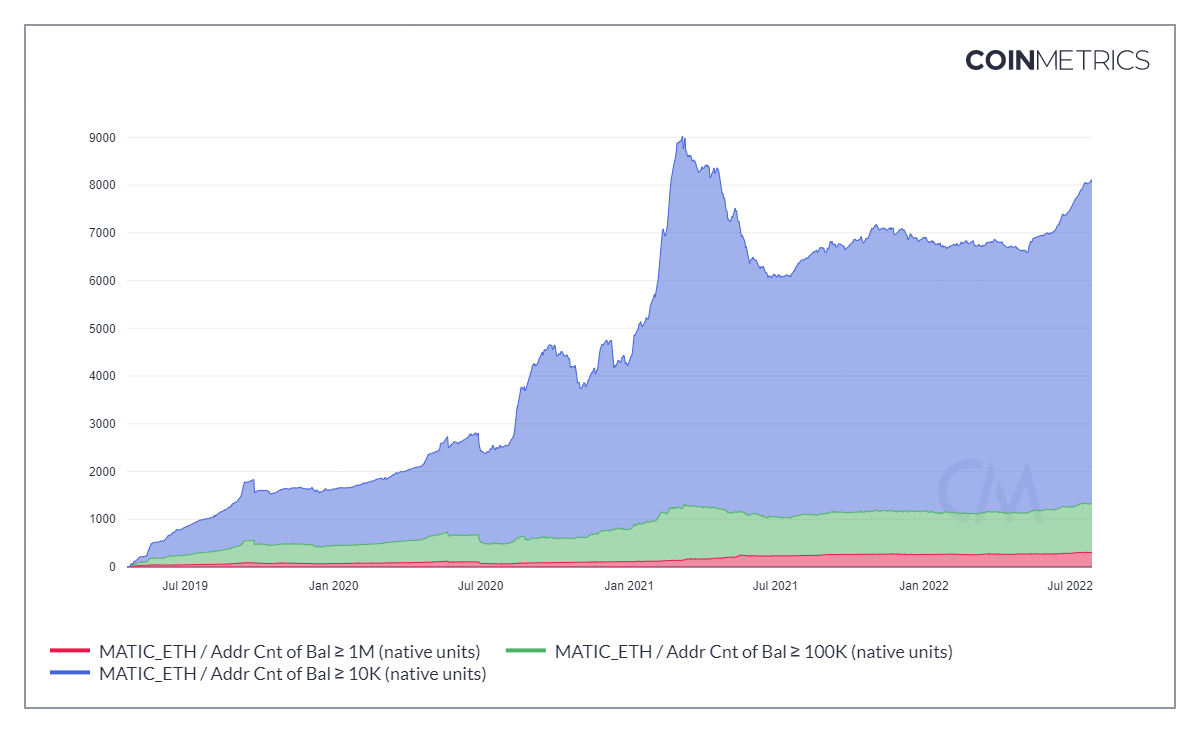
Since January 2021, the top holders have gradually divided their holdings, resulting in a modest decline in the total number of coins owned by the 100 largest wallet addresses. In the meantime, the total amount of coins held by both the top 10% and 1% have slowly decreased as giant whales might have slightly distributed their assets.
Top holders might have slowly distributed their holdings. (CoinMetrics)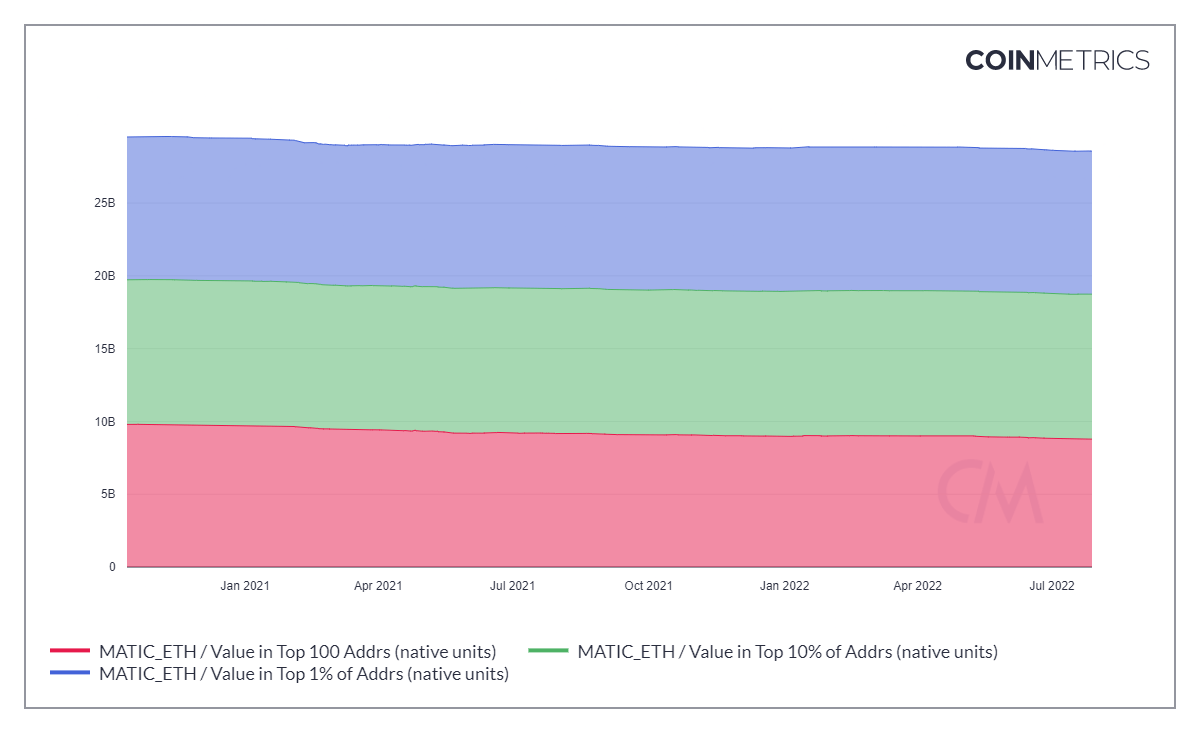
Bitcoin Is The Leading Indicator
Bitcoin (BTC-USD) has proven to be the leading indicator for the cryptocurrency market in that its price has been highly correlated with the large market capitalization altcoins. In this case, the recent correlation between Bitcoin and MATIC is roughly 90% as calculated by IntoTheBlock. It simply means that MATIC’s price is likely to be affected by Bitcoin’s movement. Hence, we should also look at Bitcoin’s movement to make investment decisions and reduce the short-term downside risk.
The current correlation between MATIC and Bitcoin is about 90%. (IntoTheBlock)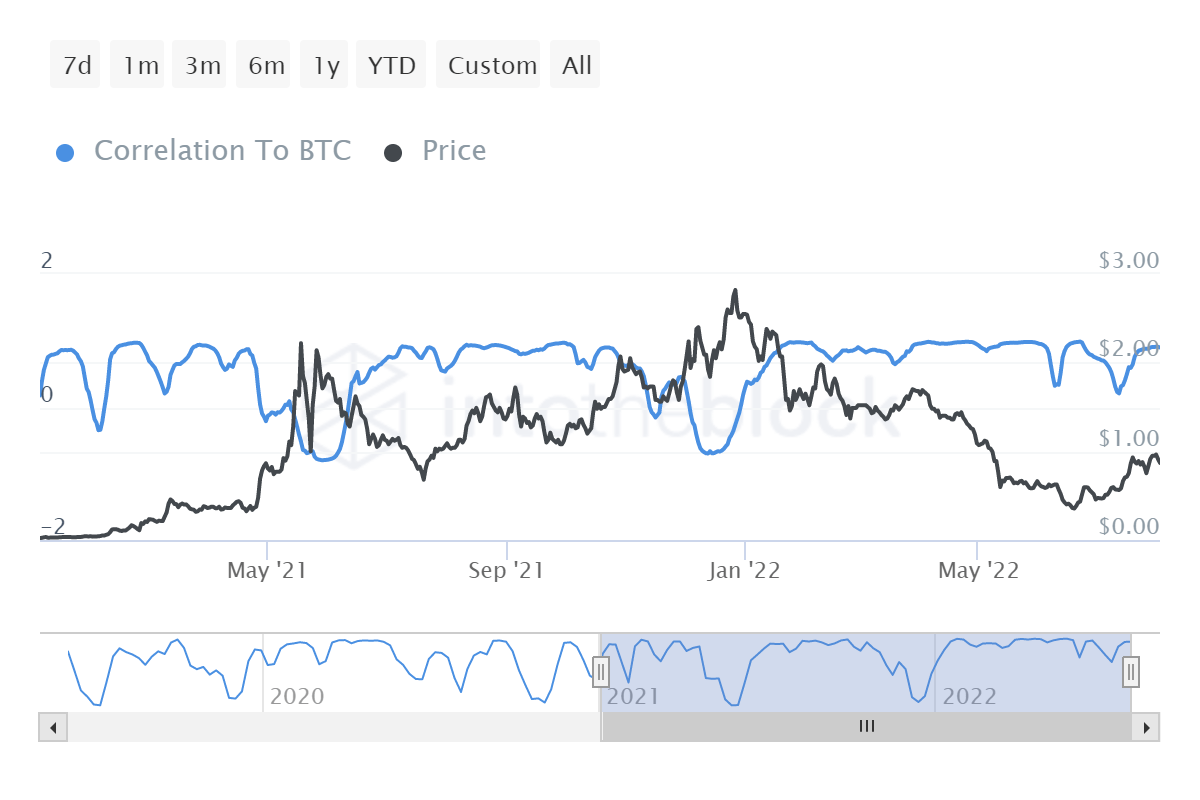
Looking at the weekly chart of Bitcoin’s price, we can see that the zone of $28,000 to $36,000 was a strong support for Bitcoin bull run in the long term. However, this support has been broken out, and the price action is in a downtrend now. This zone is likely to be the new resistance for the next bear run in the short term.
The zone between 28,000 and 36,000 is now a strong resistance for Bitcoin downside. (TradingView)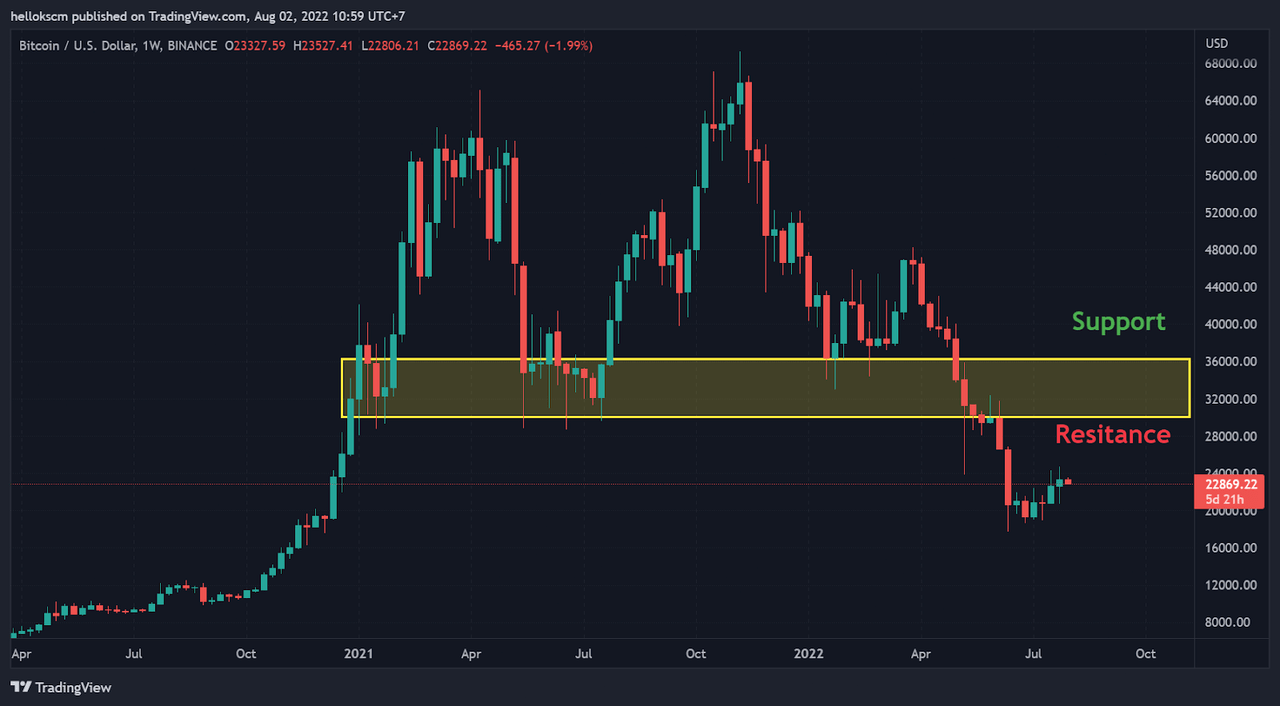
In addition, the daily price action of Bitcoin is forming a rising channel, which is widely known as the continuation pattern in technical analysis. It means that the price action will likely continue their previous direction before the formation of the rising channel. Unfortunately, this can entail more the potential downside risk if the price breaks the lower band of the channel pattern.
The daily price action of Bitcoin is forming a rising channel, potentially entailing more downside risk. (TradingView)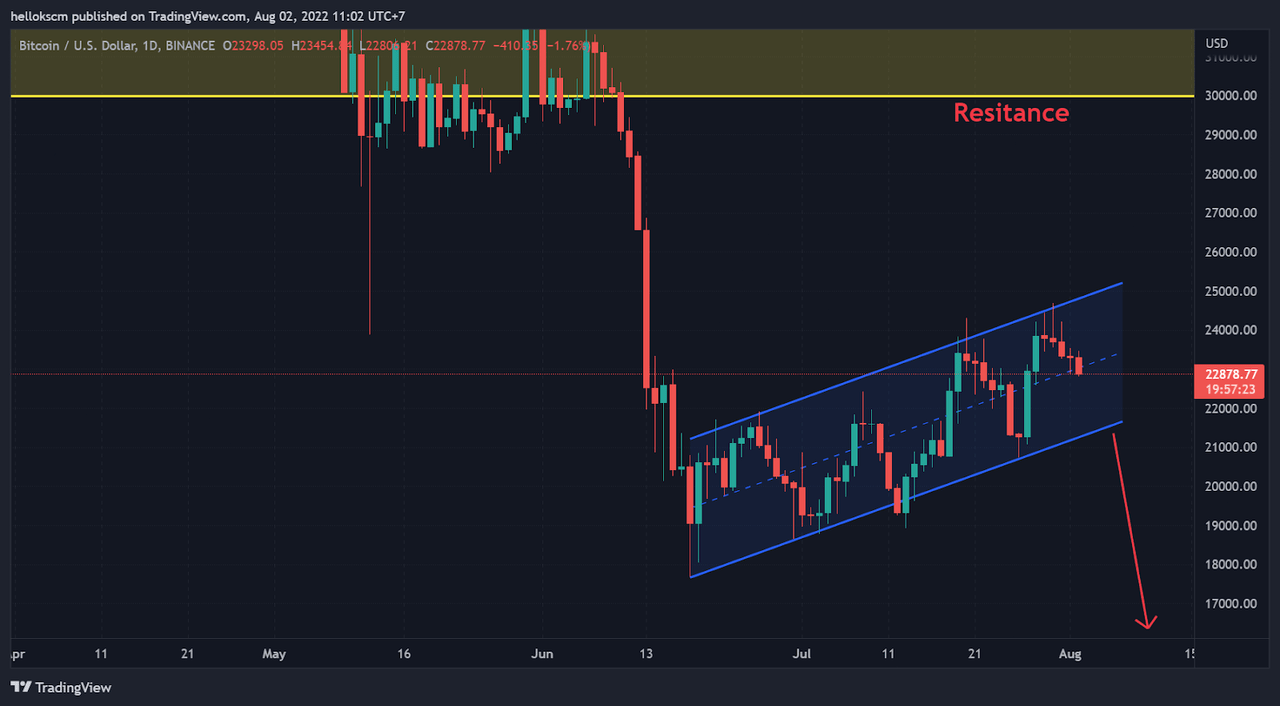
Conclusion
On balance, many average stakeholders may have added additional coins to their accounts, though top holders may have marginally divided their holdings. The Polygon network is undervalued because the majority of investors are suffering significant losses, while the network utilization has grown. This historically results in the establishment of the local bottom due to the return of the buying momentum. The current MATIC price is reasonable in the long term, but there is a downside risk in this market under the prevailing economic conditions. Therefore, a good investment strategy in terms of risk management now could be to go short MATIC in futures market for the short-term, and slowly accumulate more MATIC in spot for the long-term.
Be the first to comment