

marekuliasz/iStock Editorial via Getty Images
This article was coproduced with Dividend Sensei.
Are you nervous about all the volatility we’ve seen this year thanks to a perfect storm of risks including:
-
the Russo-Ukrainian war
-
soaring commodity prices (due to the war)
-
the highest inflation in 40 years
-
soaring interest rates
-
the fastest Fed tightening cycle since 1980
-
extreme tech valuations coming into the year
Consider what we’ve seen in just the last three months.
-
the worst January in market history according to Bloomberg
-
a 14.6% peak decline in the S&P 500 (Feb 24th)
-
a 21% peak decline in the Nasdaq (a bear market)
-
stocks soaring 11% in 11 days, the 14th best 11-day return in US history
This kind of volatility can be scary for new investors who have been spoiled by the last three years.
-
31% return in 2019
-
18% in 2020
-
28% in 2021
Stocks went up 24% annually for three years, one of the best three-year periods in history.
These are literally Buffett-like returns for index fund investors and, naturally, gave many investors a sense of euphoria.
Everyone feels like a genius in a bull market.” – Mark Cuban
Guess what?
The 14.6% correction we’ve seen this year? Which is now in its 93rd day?
Totally normal, healthy, and predictable.
-
since WWII, corrections have averaged one every 18 months
-
an average decline of 15%
-
average duration of 8 months, measured from market peak to new record high
No one could have predicted the exact witch’s brew of risk factors that created this current correction.
But according to JPMorgan Asset Management, since 1980 the market’s average peak intra-year decline is 14%.
Or to put it another way, in any given year you should expect a 14% correction.
How on earth can long-term investors stay sane, and avoid costly mistakes, when this kind of decline could happen every year?
Simple, by remembering one simple fact.
“Volatility isn’t risk, it’s the source of future returns.” – Joshua Brown, CEO Ritholtz Wealth Management
So let me show you how to harness 2022’s perfectly normal and healthy volatility to lock in a blue-chip bargain that need to be seen to be believed.
I’m talking about Polaris Inc. (NYSE:PII), a 42% undervalued Ultra SWAN anti-bubble Buffett-style “fat pitch” that Dividend Sensi recently added to and recommended for Dividend Kings members.
Why?
Because as you’ll now see, this is one of the easiest and safest ways to potentially triple your money in the next five years.
More importantly, Polaris could deliver decades of aristocrat and market-beating returns that could be your ticket to retiring in safety and splendor.
So here are the three reasons why Sensei just bought more Polaris (and I did too), and you might want to as well.
Reason One: World-Class Quality You Can Trust In Any Economy
The Dividend King’s overall quality scores are based on a 243-point model that includes:
-
dividend safety
-
balance sheet strength
-
credit ratings
-
credit default swap medium-term bankruptcy risk data
-
short and long-term bankruptcy risk
-
accounting and corporate fraud risk
-
profitability and business model
-
growth consensus estimates
-
management growth guidance
-
historical earnings growth rates
-
historical cash flow growth rates
-
historical dividend growth rates
-
historical sales growth rates
-
cost of capital
-
long-term risk-management scores from MSCI, Morningstar, FactSet, S&P, Reuters’/Refinitiv, and Just Capital
-
management quality
-
dividend friendly corporate culture/income dependability
-
long-term total returns (a Ben Graham sign of quality)
-
analyst consensus long-term return potential
In fact, it includes over 1,000 fundamental metrics, including the 12 rating agencies we use to assess fundamental risk.
How do we know that our safety and quality model works well?
During the two worst recessions in 75 years, our safety model predicted 87% of blue-chip dividend cuts, the ultimate baptism by fire for any dividend safety model.
And then there’s the confirmation that our quality ratings are very accurate.
DK Zen Phoenix: Superior Fundamentals Lead To Superior Long-Term Results
|
Metric |
US Stocks |
189 Real Money DK Phoenix Recs |
|
Great Recession Dividend Growth |
-25% |
0% |
|
Pandemic Dividend Growth |
-1% |
6% |
|
Positive Total Returns Over The Last 10 Years |
42% |
99.5% (Greatest Investors In History 60% to 80% Over Time) |
|
Lost Money/Went Bankrupt Over The Last 10 Years |
47% |
0.5% |
|
Outperformed Market Over The Last Decade (296%) |
36% |
52% |
|
Bankruptcies Over The Last 10 Years |
11% |
0% |
|
Permanent 70+% Catastrophic Decline Since 1980 |
44% |
0.5% |
|
100+% Total Return Over The Past 10 Years |
NA |
87% |
|
Sources: Morningstar, JPMorgan, Seeking Alpha |
Basically, historical market data confirms that the DK safety and quality model is one of the most comprehensive and accurate in the world.
This is why we entrust 100% of my life savings to this model and the DK Phoenix blue-chip strategy.
How does Polaris score on one of the world’s most comprehensive and accurate safety and quality models?
Polaris Dividend Safety
|
Rating |
Dividend Kings Safety Score (153 Point Safety Model) |
Approximate Dividend Cut Risk (Average Recession) |
Approximate Dividend Cut Risk In Pandemic Level Recession |
|
1 – unsafe |
0% to 20% |
over 4% |
16+% |
|
2- below average |
21% to 40% |
over 2% |
8% to 16% |
|
3 – average |
41% to 60% |
2% |
4% to 8% |
|
4 – safe |
61% to 80% |
1% |
2% to 4% |
|
5- very safe |
81% to 100% |
0.5% |
1% to 2% |
|
PII |
92% |
0.50% |
1.40% |
|
Risk Rating |
Medium (58th industry percentile risk-management consensus) |
Effective A+ stable outlook credit rating 0.6% 30-year bankruptcy risk |
20% OR LESS Max Risk Cap Recommendation |
Long-Term Dependability
|
Company |
DK Long-Term Dependability Score |
Interpretation |
Points |
|
Non-Dependable Companies |
21% or below |
Poor Dependability |
1 |
|
Low Dependability Companies |
22% to 60% |
Below-Average Dependability |
2 |
|
S&P 500/Industry Average |
61% (58% to 70% range) |
Average Dependability |
3 |
|
Above-Average |
71% to 80% |
Very Dependable |
4 |
|
Very Good |
81% or higher |
Exceptional Dependability |
5 |
|
PII |
85% |
Exceptional Dependability |
5 |
Overall Quality
|
PII |
Final Score |
Rating |
|
Safety |
92% |
5/5 very safe |
|
Business Model |
90% |
3/3 wide moat |
|
Dependability |
85% |
5/5 exceptional |
|
Total |
89% |
13/13 Ultra SWAN Dividend Champion |
|
Risk Rating |
2/3 Medium Risk |
|
|
20% OR LESS Max Risk Cap Rec |
5% Margin of Safety For A Potentially Good Buy |
PII: 71st Highest Quality Master List Company (Out of 506) = 86th Percentile
The DK 500 Master List includes the world’s highest quality companies including:
-
All dividend champions
-
All dividend aristocrats
-
All dividend kings
-
All global aristocrats (such as BTI, ENB, and NVS)
-
All 13/13 Ultra Swans (as close to perfect quality as exists on Wall Street)
-
49 of the world’s best growth stocks
PII’s 89% quality score means its similar in quality to such blue-chips as:
-
Altria (MO) – dividend king
-
Digital Realty Trust (DLR)
-
Home Depot (HD)
-
Illinois Tool Works (ITW) – dividend king
-
Enbridge (ENB) – global aristocrat
-
Qualcomm (QCOM)
-
Lockheed Martin (LMT)
-
Johnson & Johnson (JNJ) – dividend king
-
Philip Morris International (PM) – dividend king
Even among the world’s highest quality companies, PII is higher quality than 86% of them.
Why I Trust Polaris With My Retirement Savings And So Can You
Polaris was founded in 1954, in Medina Minnesota.
Polaris is one of the longest-operating brands in Powersports. We believe that its brands, innovative products, and lean manufacturing yield the firm a wide economic moat and that it stands to capitalize on its research and development, solid quality, operational excellence, and acquisition strategy. – Morningstar (emphasis added).
Polaris (Annual Report)
PII isn’t just a leading US Powersports company, it’s a global industry leader:
-
16,000 employees
-
#1 market share
-
20 global factories
-
over 4,000 global dealers
-
over 400,000 units sold in 2021
-
operating in over 120 countries
-
79% of sales in the US
-
7% Canada
-
14% international
Polaris is a very adaptable company, surviving and thriving through:
-
10 recessions
-
2 economic crises
-
four major oil spikes
-
inflation as high as 15%
-
interest rates as high as 20%
-
10 bear markets
-
dozens of corrections and pullbacks
PII is built to last and will likely outlive us all.
PII’s largest risk pre-pandemic was elevated leverage (why the dividend has been growing at 2% for several years).
That risk is now handled and PII is now able to once more continue its rich history of smart M&A to keep driving double-digit growth.
PII just recently began selling overseas and this represents a decades-long potential growth runway for the company.
Our International business exceeded the $1 billion mark, which was an increase of 34%. – CEO, Q4 conference call
PII’s international business grew at 34% in 2021, compared to 17% for overall company sales.
PII has steadily expanded beyond snowmobiles into ATVs, motorcycles, boats, and EVs, and is steadily gaining market share.
We introduced over 30 new vehicles and nearly 500 new accessories in 2021…
Despite the headwinds, I couldn’t be more pleased with our market share performance or gained 120 basis points of share with side by side up about 1 point of share for the year and ATVs up over 1.5 points. – CEO, Q4 conference call
Exceptional Management You Can Trust
“Our capital allocation rating for Polaris is Exemplary….
With net debt/EBITDA that should average below 1 time over the next decade, there is plenty of financial flexibility on the balance sheet.
From a leadership perspective, prior CFO Mike Speetzen took the helm at Polaris after longtime CEO Scott Wine moved on at the end of 2020. Speetzen brought a robust knowledge base of the Powersports industry to the leadership position, thanks to his time in the CFO seat providing a long primer on the overall business strategy…
We continue to hold a positive view on Polaris’ investment strategy…
Additionally, the transformational acquisitions Polaris has pursued have been reasonably priced and have largely folded into the business without disruption….
Furthermore, we deem cash distributions as appropriate, with the management team returning capital to shareholders when optimal.” – Morningstar
As Morningstar points out, PII’s management has an excellent track record on
-
reasonably priced M&A (usually around 9 to 10X EBITDA)
-
well-executed M&A
-
a very safe balance sheet
-
very dependable dividend growth
My definition of exceptional management is based on
-
stable wide moat for 20+ years (75th industry percentile profitability or better)
-
20+ year dividend growth (the Graham standard of excellence)
So I agree 100% with Morningstar, a wonderful management team and dividend-friendly corporate culture you can trust.
-
no matter what the economy or stock market throws at us in the future
Our second priority is dividends. We obtained dividend Aristocrat status two years ago, which is defined as 25 years of consecutive dividend increases, which we are very proud of. We believe dividends are a critical part of the attractiveness of Polaris stock to our shareholders. Later this week, we are asking our Board to approve the 27th consecutive annual dividend increase. We will announce any increase subsequent to Board approval. – CFO, Q4 conference call (emphasis added).
PII’s #1 focus is on organic growth.
#2 is the dividend, with management planning to remain a dividend aristocrat.
#3 is opportunity buybacks, with management planning to reduce the share count by at least 10% in the next five years.
-
2% annual buyback target per management guidance
PII currently is targeting a $55 billion fast-growing market.
And has plans to expand that to the full addressable market of about $145 billion.
-
$8.2 billion in 2021 sales = 15% market share
-
6% of addressable market share
PII’s market share is 2X that of its nearest rival.
And in 2021 it gained significant market share:
-
Offroad (#1 market share): 80% market share gains vs #2 in the industry
-
On-Road (#2 market share): 130% market share gains vs #3
-
Marine (#1 market share): 70% market share gains vs #2
PII’s customer base is growing rapidly and in the last five years
-
Millennials +44%
-
women +28%
-
Hispanics +21%
-
African Americans +7%
Management thinks it can grow its customer base by 50% in the next 10 years.
-
70% of sales in 2021 were to new customers
And it’s not just recreational users that love PII’s products. In the last five years
-
hunters +28%
-
landowners +34%
-
farmers +18%
1,800 of PII’s 16,000 employees are engineers and software developers, operating out of eight global R&D centers.
-
11% or 1 in 9 employees works on R&D
-
$337 million budget in 2021
-
over 1,100 patents actively protecting its brands and IP
One of PII’s main R&D focuses is on EVs which are superior to conventional vehicles in many ways.
-
better acceleration
-
lower cost of ownership
-
quieter (hunters love this)
-
zero-emissions
From ATVs to snowmobiles to side-by-sides to motorcycles, PII is leading the charge in electrifying the industry.
Management believes it can grow sales at 7% to 9% CAGR over the next five years.
-
adjusted EBITDA growth of 13% to 19% CAGR
-
EPS growth of 10+%
-
returns on invested capital stable at 24% to 26%
Quantitative Analysis: The Math Behind The Investment Thesis
GuruFocus 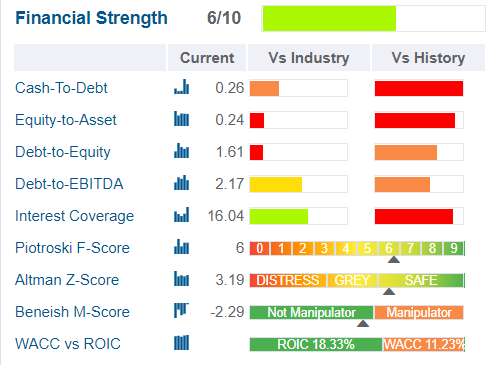
PII doesn’t pay for a credit rating but I’m highly confident that if it did it would be rated A+, and here’s why.
-
current and historical debt metrics and ratios consistent with A or even AA-rated companies
-
advanced accounting metrics (F, Z, and M-scores) consistent with A or even AA-rated companies
-
solvency ratios consistent with A or even AA-rated companies
-
2.45% average borrowing cost consistent with A or even AA-rated companies
In other words, the bond market, which knows the rating agency guidelines for every industry, is treating Polaris as an A+ rated company.
-
approximately 30-year bankruptcy risk 0.6%
-
The approximate risk of losing all your money buying PII today is 1 in 167
PII’s Leverage Consensus Forecast
|
Year |
Debt/EBITDA |
Net Debt/EBITDA (3.0 Or Less Safe According To Credit Rating Agencies) |
Interest Coverage (8+ Safe) |
|
2020 |
1.51 |
0.94 |
3.16 |
|
2021 |
1.38 |
1.43 |
16.16 |
|
2022 |
1.46 |
0.90 |
16.15 |
|
2023 |
1.10 |
0.57 |
16.28 |
|
Annualized Change |
-10.00% |
-15.38% |
72.64% |
(Source: FactSet Research Terminal)
PII’s balance sheet is a fortress and is expected to get steadily safer over time.
|
Credit Rating |
Safe Net Debt/EBITDA For Most Companies |
30-Year Default/Bankruptcy Risk |
|
BBB |
3.0 or less |
7.50% |
|
A- |
2.5 or less |
2.50% |
|
A |
2.0 or less |
0.66% |
|
A+ |
1.8 or less |
0.60% |
|
AA |
1.5 or less |
0.51% |
|
AAA |
1.1 or less |
0.07% |
(Sources: S&P, Fitch, Moody’s)
Even with a cyclical business model, I’m confident this is an A+ rated company.
-
and the bond market agrees
PII’s Balance Sheet Consensus Forecast
|
Year |
Total Debt (Millions) |
Cash |
Net Debt (Millions) |
Interest Cost (Millions) |
EBITDA (Millions) |
Operating Income (Millions) |
|
2020 |
$1,401 |
$635 |
$873 |
$67 |
$929 |
$212 |
|
2021 |
$1,376 |
$509 |
$1,421 |
$44 |
$994 |
$711 |
|
2022 |
$1,636 |
$518 |
$1,005 |
$52 |
$1,118 |
$840 |
|
2023 |
$1,338 |
$654 |
$693 |
$57 |
$1,217 |
$928 |
|
2024 |
NA |
NA |
NA |
NA |
$1,296 |
$995 |
|
Annualized Growth |
-1.52% |
0.99% |
-7.41% |
-5.25% |
8.68% |
47.19% |
(Source: FactSet Research Terminal)
PII’s debt is expected to remain stable while cash flows grow rapidly.
PII Bond Profile
-
$1.5 billion in liquidity
-
100% unsecured bonds (maximum financial flexibility)
-
no debt maturing until 2026, and after that 2028, and after 2030
-
2.45% average borrowing cost vs bond market’s 2.2% long-term inflation forecast
-
PII’s effective real interest rate is 0.25% vs 18.7% return on invested capital
-
returns on investment are 75X its real borrowing cost
Profitability: Wall Street’s Favorite Quality Proxy
PII’s profitability is historically in the top 10% of peers.
PII Trailing 12-Month Profitability Vs. Peers
|
Metric |
Industry Percentile |
Major Vehicle And Parts Companies More Profitable Than PII (Out Of 1,211) |
|
Operating Margin |
70.81 |
353 |
|
Net Margin |
67.62 |
392 |
|
Return On Equity |
97.05 |
36 |
|
Return On Assets |
89.35 |
129 |
|
Return On Capital |
92.96 |
85 |
|
Average |
83.56 |
199 |
(Source: GuruFocus Premium)
In the last year, PII’s average profitability was in the top 16% of its peers.
PII’s industry-leading profitability has been relatively stable or improving for the last 30 years confirming a wide and stable moat.
PII’s Profit Margin Consensus Forecast
|
Year |
FCF Margin |
EBITDA Margin |
EBIT (Operating) Margin |
Net Margin |
Return On Capital Expansion |
Return On Capital Forecast |
|
2020 |
11.5% |
13.2% |
3.0% |
1.8% |
1.13 |
|
|
2021 |
-0.1% |
12.1% |
8.7% |
6.0% |
TTM ROC |
54.11% |
|
2022 |
7.9% |
12.0% |
9.0% |
6.6% |
Latest ROC |
29.15% |
|
2023 |
5.6% |
12.5% |
9.6% |
6.9% |
2023 ROC |
61.00% |
|
2024 |
8.3% |
12.7% |
9.8% |
7.2% |
2023 ROC |
32.86% |
|
2025 |
NA |
NA |
NA |
NA |
Average |
46.93% |
|
2026 |
NA |
NA |
NA |
NA |
Industry Median |
11.28% |
|
2027 |
NA |
NA |
NA |
NA |
PII/Industry Median |
4.16 |
|
Annualized Growth |
-7.76% |
-0.94% |
34.16% |
41.94% |
Vs S&P |
3.21 |
|
Annualized Growth (Ignoring Pandemic) |
2.24% |
1.65% |
4.08% |
6.23% |
(Source: FactSet Research Terminal)
PII’s profitability is expected to keep growing at a steady and impressive rate, ignoring the temporary pandemic effects.
Return on capital is pre-tax profit/operating capital (the money it takes to run the business).
-
Joel Greenblatt’s gold standard proxy for quality and moaty-ness
Analysts are expecting a 47% long-term ROC.
-
the average investment pays for itself in two years vs 7 for the S&P 500
-
over 4X the industry’s ROC
-
over 3X the S&P 500’s ROC
PII’s ROC has been trending lower at a 3.4% pace for nearly 30 years.
-
part of its risk profile (see risk section)
-
something we’re tracking over time
PII’s Dividend Growth Consensus Forecast
|
Year |
Dividend Consensus |
FCF/Share Consensus |
FCF Payout Ratio |
Retained (Post-Dividend) Free Cash Flow |
Buyback Potential |
Debt Repayment Potential |
|
2022 |
$2.56 |
$10.43 |
24.5% |
$472 |
7.65% |
34.3% |
|
2023 |
$2.64 |
$10.63 |
24.8% |
$479 |
7.77% |
34.8% |
|
2024 |
$2.76 |
$13.57 |
20.3% |
$649 |
10.51% |
39.6% |
|
Total 2022 Through 2024 |
$7.96 |
$34.63 |
23.0% |
$1,600.20 |
25.92% |
116.29% |
|
Annualized Rate |
3.83% |
14.06% |
-8.97% |
17.20% |
17.20% |
7.48% |
(Source: FactSet Research Terminal)
-
60% FCF payout ratios are the safety guideline for this industry according to rating agencies.
-
PII’s payout ratio is already very safe and expected to fall to 20% by 2024
Its $1.6 billion in retained FCF (after dividends) from 2022 through 2024 is enough to pay off more than all of its debt or buy back about 26% of its stock at current valuations
PII’s Buyback Consensus Forecast
|
Year |
Consensus Buybacks ($ Millions) |
% Of Shares (At Current Valuations) |
Market Cap |
|
2022 |
$156.0 |
2.5% |
$6,174 |
|
Total 2022-2022 |
$156.00 |
2.5% |
$6,174 |
|
Annualized Rate |
2.50% |
Average Annual Buybacks |
$156.00 |
(Source: FactSet Research Terminal)
Management is guiding for 2% annual buybacks over the next five years, and analysts expect $156 million in repurchases this year, enough to buy back 2.5% of its shares at current valuations.
PII has been buying back an average of 1.65% of its net shares each year for 36 years, reducing the share count by 46%.
|
Time Frame (Years) |
Net Buyback Rate |
Shares Remaining |
Net Shares Repurchased |
Each Share You Own Is Worth X Times More (Not Including Future Growth And Dividends) |
|
5 |
1.7% |
92.02% |
7.98% |
1.09 |
|
10 |
1.7% |
84.67% |
15.33% |
1.18 |
|
15 |
1.7% |
77.91% |
22.09% |
1.28 |
|
20 |
1.7% |
71.69% |
28.31% |
1.39 |
|
25 |
1.7% |
65.97% |
34.03% |
1.52 |
|
30 |
1.7% |
60.71% |
39.29% |
1.65 |
(Source: FactSet Research Terminal)
If PII were to continue at its historical buyback rate, within 30 years it could repurchase 39% of its shares and make each share you own today worth 65% more.
-
not including future growth or dividends
And what if PII’s buyback stock is at 2% over time as management is guiding for (at a minimum)?
|
Time Frame (Years) |
Net Buyback Rate |
Shares Remaining |
Net Shares Repurchased |
Each Share You Own Is Worth X Times More (Not Including Future Growth And Dividends) |
|
5 |
2.0% |
90.39% |
9.61% |
1.11 |
|
10 |
2.0% |
81.71% |
18.29% |
1.22 |
|
15 |
2.0% |
73.86% |
26.14% |
1.35 |
|
20 |
2.0% |
66.76% |
33.24% |
1.50 |
|
25 |
2.0% |
60.35% |
39.65% |
1.66 |
|
30 |
2.0% |
54.55% |
45.45% |
1.83 |
(Source: FactSet Research Terminal)
If PII buys back 2% of its shares each year for three decades, then even with zero growth and not counting dividends you’d make 83% on your money.
Basically, Polaris is a wonderful company that has made many investors rich over the decades. Here’s why that’s likely to continue for decades to come.
Reason Two: Incredible Growth Prospects For Decades To Come
We’ve already seen how PII is the industry leader in terms of market share, R&D, and EVs.
We’ve seen how PII has a $55 billion market that could grow to as much as $160 billion per year.
-
that addressable market is itself growing rapidly
So what does all this potentially mean for PII investors? Here’s what analysts expect in the medium-term.
PII’s Medium-Term Growth Consensus Forecast
|
Year |
Sales |
Free Cash Flow |
EBITDA |
EBIT (Operating Income) |
Net Income |
|
2020 |
$7,025 |
$805 |
$929 |
$212 |
$125 |
|
2021 |
$8,198 |
-$5 |
$994 |
$711 |
$494 |
|
2022 |
$9,327 |
$740 |
$1,118 |
$840 |
$614 |
|
2023 |
$9,698 |
$546 |
$1,217 |
$928 |
$671 |
|
2024 |
$10,176 |
$844 |
$1,296 |
$995 |
$735 |
|
Annualized Growth |
9.71% |
1.19% |
8.68% |
47.19% |
55.72% |
|
Annualized Growth (Ignoring Pandemic) |
7.47% |
6.80% |
9.25% |
11.85% |
14.16% |
(Source: FactSet Research Terminal)
PII is expected to achieve management’s guidance and deliver high single-digit sales growth and double-digit bottom-line growth.
|
Metric |
2020 Growth |
2021 Growth Consensus |
2022 Growth Consensus |
2023 Growth Consensus |
2024 Growth Consensus |
|
Sales |
3% |
16% |
15% |
4% |
5% |
|
Dividend |
2% |
2% |
2% (Official) |
3% |
5% (29-year dividend growth streak) |
|
EPS |
22% |
18% |
12% |
9% |
13% |
|
Operating Cash Flow |
62% |
-68% |
184% |
-4% |
51% |
|
Free Cash Flow |
98% |
-101% |
13182% |
2% |
28% |
|
EBITDA |
21% |
15% |
27% |
9% |
7% |
|
EBIT (operating income) |
27% |
27% |
29% |
10% |
8% |
(Source: FactSet Research Terminal)
PII is expected to start accelerating its dividend growth in 2023 and 2024. By 2025 its dividend growth streak is expected to hit 30 years.
What about the long-term?
PII’s Long-Term Growth Outlook
-
5.4% to 15.0% CAGR growth consensus range (from five sources)
-
median growth consensus: 10.7% CAGR
-
management guidance: 10+%
How accurate are analyst forecasts?
-
smoothing for outliers 10% margins of error to the upside and downside
-
4% to 17% CAGR margin-of-error adjusted growth consensus range
-
70% statistical probability that PII grows at 4% to 17% CAGR over the long-term
Over the last 20 years, PII has grown at 5% to 20% CAGR and analysts and management expect long-term growth to be similar to the last 20 years.
Ok, so now you can see why I’m excited to recommend Polaris, but there is one final reason that makes PII such a wonderful dividend aristocrat “fat pitch.”
Q4-21 Polaris Investor Deck
Reason Three: Crazy, Stupid, Cheap
-
over the last 7 to 20 years (statistically significant periods)
-
outside of bear markets and bubbles
-
tens of millions of income investors have consistently paid 16.5X to 18X earnings for PII
-
a 91% statistical probability that PII’s intrinsic value is within this range
|
Metric |
Historical Fair Value Multiples (all-Years) |
2020 |
2021 |
2022 |
2023 |
2024 |
12-Month Forward Fair Value |
|
Earnings |
16.90 |
$130.81 |
$154.30 |
$172.89 |
$191.82 |
$211.42 |
|
|
Average |
$130.81 |
$154.30 |
$172.89 |
$191.82 |
$211.42 |
$177.98 |
|
|
Current Price |
$103.80 |
||||||
|
Discount To Fair Value |
20.65% |
32.73% |
39.96% |
45.89% |
50.90% |
41.68% |
|
|
Upside To Fair Value (NOT Including Dividends) |
26.02% |
48.65% |
66.56% |
84.79% |
103.68% |
71.47% (74% including dividend) |
|
|
2022 EPS |
2023 EPS |
2022 Weighted EPS |
2023 Weighted EPS |
12-Month Forward EPS |
12-Month Average Fair Value Forward PE |
Current Forward PE |
|
|
$10.23 |
$11.35 |
$7.48 |
$3.06 |
$10.53 |
16.9 |
9.9 |
I estimate PII is worth 17X earnings and today it trades at 9.9X
-
cash-adjusted PE (EV/EBITDA) of 7.1
Today PII is a bargain even by private equity standards.
-
Shark Tank season 1 to 10 average EV/EBITDA of 7
Yet it’s one of the world’s highest quality companies, and growing at double-digits.
|
Analyst Median 12-Month Price Target |
Morningstar Fair Value Estimate |
|
$141.90 (12.2 PE) |
$184.00 (17.5 PE) |
|
Discount To Price Target (Not A Fair Value Estimate) |
Discount To Fair Value |
|
26.85% |
43.59% |
|
Upside To Price Target (Not Including Dividend) |
Upside To Fair Value (Not Including Dividend) |
|
36.71% |
77.26% |
|
12-Month Median Total Return Price (Including Dividend) |
Fair Value + 12-Month Dividend |
|
$144.46 |
$186.56 |
|
Discount To Total Price Target (Not A Fair Value Estimate) |
Discount To Fair Value + 12-Month Dividend |
|
28.15% |
44.36% |
|
Upside To Price Target ( Including Dividend) |
Upside To Fair Value + Dividend |
|
39.17% |
79.73% |
Analysts expect PII to trade at 12.2X earnings in 12 months, delivering a 39% total return.
-
more than justified by its fundamentals
-
PII at 12.2X earnings would still be a bargain
Morningstar’s fair value estimate is similar to ours and shows PII with 79% upside potential just to fair value.
|
Rating |
Margin Of Safety For Medium-Risk 13/13 Ultra SWAN Quality Companies |
2022 Price |
2023 Price |
12-Month Forward Fair Value |
|
Potentially Reasonable Buy |
0% |
$172.89 |
$191.82 |
$177.98 |
|
Potentially Good Buy |
5% |
$164.24 |
$182.22 |
$169.08 |
|
Potentially Strong Buy |
15% |
$146.95 |
$163.04 |
$151.29 |
|
Potentially Very Strong Buy |
25% |
$123.18 |
$143.86 |
$133.49 |
|
Potentially Ultra-Value Buy |
35% |
$112.38 |
$124.68 |
$115.69 |
|
Currently |
$103.80 |
39.96% |
45.89% |
41.68% |
|
Upside To Fair Value (Not Including Dividends) |
66.56% |
84.79% |
71.47% |
For anyone comfortable with its risk profile, PII is a potential Ultra Value, pound the table, Buffett-style “fat pitch” buy. And here’s why.
Buffett-Like Total Return Potential From A Blue-Chip Bargain Hiding In Plain Sight
For context, here’s the return potential of the 16% overvalued S&P 500.
|
Year |
EPS Consensus |
YOY Growth |
Forward PE |
Blended PE |
Overvaluation (Forward PE) |
Overvaluation (Blended PE) |
|
2021 |
$206.25 |
50.34% |
20.7 |
21.9 |
20% |
25% |
|
2022 |
$225.56 |
9.36% |
20.1 |
20.4 |
17% |
16% |
|
2023 |
$248.01 |
9.95% |
18.2 |
19.2 |
6% |
9% |
|
2024 |
$275.55 |
11.10% |
16.4 |
17.3 |
-4% |
-2% |
|
12-Month forward EPS |
12-Month Forward PE |
Historical Overvaluation |
PEG |
25-Year Average PEG |
S&P 500 Dividend Yield |
25-Year Average Dividend Yield |
|
$231.60 |
19.538 |
15.95% |
2.30 |
3.62 |
1.41% |
2.01% |
(Source: DK S&P 500 Valuation And Total Return Tool)
Stocks have already priced in 96% EPS growth from 2020 through 2024 and are trading at 20X forward earnings.
-
16.85 is the 25-year average
-
16.9 is the 10-year average (low rate era)
-
16.9 is the 45-year average
-
91% probability that stocks are worth about 17X forward earnings
-
A 13.8% correction needed to get back to the historical market fair value
S&P 500 2027 Consensus Return Potential
|
Year |
Upside Potential By End of That Year |
Consensus CAGR Return Potential By End of That Year |
Probability-Weighted Return (Annualized) |
Inflation And Risk-Adjusted Expected Returns |
Expected Market Return Vs Historical Inflation-Adjusted Return |
|
2027 |
33.74% |
5.99% |
4.49% |
1.08% |
16.88% |
(Source: DK S&P 500 Valuation And Total Return Tool)
Adjusted for inflation, the risk-expected returns of the S&P 500 are about 1% for the next five years.
-
17% of the S&P’s historical inflation-adjusted returns of 6.4% CAGR
|
S&P Earnings Yield |
10-Year US Treasury Yield |
Earning Yield Risk-Premium (3.7% 10 and 20-year average) |
|
5.12% |
2.64% |
2.48% |
|
Theoretical Interest Rate Justified Market Fair Value Forward PE |
Current PE |
Theoretically Interest Rate Justified Market Decline |
|
15.77 |
19.54 |
19.31% |
(Source: DK S&P 500 Valuation And Total Return Tool)
Even adjusting for interest rates, stocks still require an even larger 19% correction before they become theoretically fairly valued.
But here’s what investors can reasonably expect if PII grows as expected over the next five years.
-
5-year consensus return potential range: 16% to 26% CAGR
PII 2024 Consensus Total Return Potential
Fast Graphs 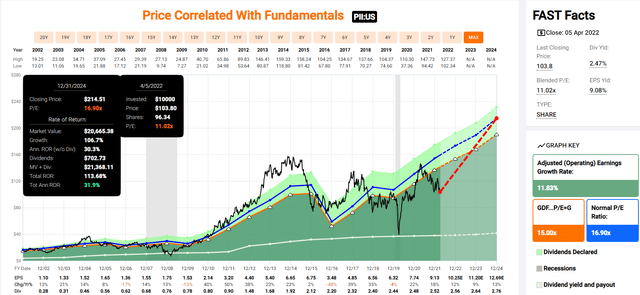
If PII grows as analysts expect by 2024 it could deliver 114% total returns, or 32% annually.
-
Buffett-like returns from an anti-bubble blue-chip bargain hiding in plain sight
PII 2027 Consensus Total Return Potential
Fast Graphs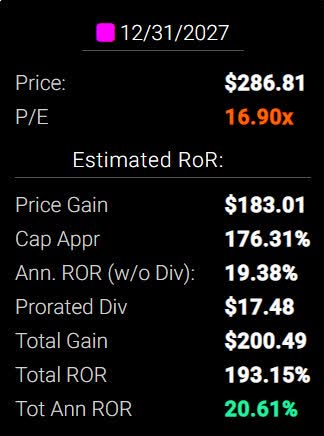
By 2027 if PII grows as expected and returns to historical fair value, it could triple and deliver 21% annual total returns.
-
also Buffett-like returns
-
6X the S&P 500 consensus
Historical Returns Since 1987
PII has delivered 122X inflation-adjusted returns since 1987 or 8X better than the S&P 500.
Polaris Rolling Returns Since 1987
PII has historically generated 18% long-term returns but from bear market lows returns as strong as 28.5% CAGR for the next 15 years.
Risk Profile: Why Polaris Isn’t Right For Everyone
There are no risk-free companies and no company is right for everyone. You have to be comfortable with the fundamental risk profile.
PII’s Risk Profile Summary
Polaris faces a number of different risks.
Motorcycles, snowmobiles, and ATVs are all big-ticket items, and a widespread slowdown in the global economic environment could hamper the replacement and adoption rates of these products.
A protracted domestic downturn could also affect financing rates at the dealer (floor plan) and retail levels…
Weather is the biggest factor Polaris cannot control; sales of snowmobiles are correlated with the amount of snowfall generated in any given season, making segment volume more volatile than the others.
Also, the most significant environmental, social, governance (‘ESG’) risk surrounds safety issues related to using Powersports products, resulting from persistent recalls (which can weigh on the firm’s ability to maintain its brand equity).
Foreign exchange exposure could prove unpredictable as the firm grows internationally, making sales uncertain. Finally, near-term issues surrounding inflation and the supply chain could alter profitability…
In ATVs, competitors like Honda and Deere are formidable players, while Indian has to compete with motorcycle manufacturing giants Honda and Harley-Davidson. All of the aforementioned brands have huge franchises and financial resources, which could cause the environment to become promotional.
Although Polaris has held its ground against these incumbents, competitive winds got the best of the company in 2004 when it sold its personal watercraft business, and the concern remains that it could happen again. – Morningstar (emphasis added).
PII’s Risk Profile includes
-
cyclical business tied to the health of the economy (and increasingly the global economy)
-
brand risk: another recall crisis could decrease market share
-
credit risk: dealers make loans to finance these big-ticket purchases
-
supply chain disruption risk
-
M&A execution risk (PII occasionally makes large deals)
-
labor retention risk (tightest job market in over 50 years and finance is a high paying industry )
-
margin compression risk: ROC has been trending lower for 30 years
The pressure points from component shortages have not changed significantly from my last update. We continue to experience parts variability for various components such as shocks, displays, certain plastics, seats, and semiconductors, among others. The reasons for these supply disruptions continue to be tied to logistics delays, labor shortages, and commodities, not unlike many other industries.” – CEO, Q4 conference call
Recession Watch
PII’s business model is highly sensitive to economic cycles.
|
Bonds |
Yield |
|
3-Month Treasury Yield |
0.68% |
|
2-Year Treasury Yield |
2.55% |
|
10-Year Treasury Yield |
2.64% |
|
10-3M Curve (Most Accurate Recession Forecasting Tool) |
1.96% |
|
10-2 Curve (Most Popular Yield Curve Followed By Wall Street) |
0.09% |
|
Potential Historically Average Recession Start If Curve Inverts Now (Curve Inverted March 31st) |
October 31st, 2023 |
|
Potential Historically Average Bear Market Start If Curve Inverts Now (Curve Inverted March 31st) |
September 8th, 2023 |
|
Potential Historically Average Bear Market Bottom (Curve Inverted March 31st) |
September 8th, 2024 |
|
Potential Historically Average New Record High (Curve Inverted March 31st) |
December 8th, 2025 |
(Source: DK S&P 500 Valuation & Total Return Tool) NOT For Market Timing Purposes
The 10-2 curve is the most closely watched by Wall Street but a study from the NY Fed finds that the 10-3 curve is the most accurate at forecasting recessions.
According to NY Fed’s model, the risk of a recession by 3/31/2023 is approximately 5.49%.
The St. Louis Fed’s model, based on four economic metrics, estimates a 0.0% chance we’re in a recession right now.
Currently, the bond market is mildly concerned about recession risk and we are monitoring the situation closely each day and week.
-
A recession scare could occur in 2022
-
yield curve + BaR economic grid makes it very likely that we’ll see a recession coming at least 10 months out
-
giving DK and iREIT members plenty of time to prepare emotionally and financially for any future bear market
How do we quantify, monitor, and track such a complex risk profile? By doing what big institutions do.
Material Financial ESG Risk Analysis: How Large Institutions Measure Total Risk
Here is a special report that outlines the most important aspects of understanding long-term ESG financial risks for your investments.
-
ESG is NOT “political or personal ethics based investing”
-
it’s total long-term risk management analysis
“ESG is just normal risk by another name.” Simon MacMahon, head of ESG and corporate governance research, Sustainalytics” – Morningstar
ESG factors are taken into consideration, alongside all other credit factors, when we consider they are relevant to and have or may have a material influence on creditworthiness.” – S&P
ESG is a measure of risk, not of ethics, political correctness, or personal opinion.
S&P, Fitch, Moody’s, DBRS (Canadian rating agency), AM Best (insurance rating agency), R&I Credit Rating (Japanese rating agency), and the Japan Credit Rating Agency have been using ESG models in their credit ratings for decades.
-
credit and risk management ratings make up 41% of the DK safety and quality model
-
dividend/balance sheet/risk ratings make up 82% of the DK safety and quality model
Dividend Aristocrats: 67th Industry Percentile On Risk Management (Above-Average, 24/100 Medium Risk)
PII Long-Term Risk Management Consensus
|
Rating Agency |
Industry Percentile |
Rating Agency Classification |
|
Morningstar/Sustainalytics 20 Metric Model |
96.4% |
11.2/100 low-Risk |
|
Reuters’/Refinitiv 500+ Metric Model |
96.6% |
Excellent |
|
S&P 1,000+ Metric Model |
23.0% |
Poor, Stable Trend |
|
Just Capital 19 Metric Model |
36.1% |
Below-Average |
|
FactSet |
30.0% |
Below-Average, Positive Trend |
|
Morningstar Global Percentile (All 15,000 Rated Companies) |
97.7% |
Excellent |
|
Just Capital Global Percentile (All 954 Rated US Companies) |
29.4% |
Poor |
|
Consensus |
58% |
Medium-Risk, Average Risk-Management, Stable Trend, |
(Sources: Morningstar, Reuters’, JustCapital, S&P, FactSet Research)
PII’s Long-Term Risk Management Is The 312th Best In The Master List (38th Percentile)
|
Classification |
Average Consensus LT Risk-Management Industry Percentile |
Risk-Management Rating |
|
S&P Global (SPGI) #1 Risk Management In The Master List |
94 |
Exceptional |
|
Strong ESG Stocks |
78 |
Good – Bordering On Very Good |
|
Foreign Dividend Stocks |
75 |
Good |
|
Ultra SWANs |
71 |
Good |
|
Low Volatility Stocks |
68 |
Above-Average |
|
Dividend Aristocrats |
67 |
Above-Average |
|
Dividend Kings |
63 |
Above-Average |
|
Master List average |
62 |
Above-Average |
|
Hyper-Growth stocks |
61 |
Above-Average |
|
Monthly Dividend Stocks |
60 |
Above-Average |
|
Polaris |
58 |
Average, Bordering On Above-Average |
|
Dividend Champions |
57 |
Average |
(Source: DK Research Terminal)
PII’s risk-management consensus is in the bottom 38% of the world’s highest quality companies and similar to that of such other companies as
-
Realty Income (O) – dividend aristocrat
-
Essex Property Trust (ESS) – dividend aristocrat
-
Northwest Natural Holding (NWN) – dividend king
-
General Dynamics (GD) – dividend aristocrats
-
Exxon Mobil (XOM) – dividend aristocrat
-
UnitedHealth Group (UNH)
-
Carlisle Companies (CSL) – dividend champion
-
Brookfield Renewable Corp (BEPC)
The bottom line is that all companies have risks, and PII is average, bordering on above-average at managing theirs.
How We Monitor PII’s Risk Profile
-
16 analysts
-
5 total risk rating agencies
-
21 experts who collectively know this business better than anyone other than management
“When the facts change, I change my mind. What do you do sir?” – John Maynard Keynes
There are no sacred cows at iREIT or Dividend Kings. Wherever the fundamentals lead, we always follow. That’s the essence of disciplined financial science, the math behind retiring rich and staying rich in retirement.
Bottom Line: Polaris Is A 42% Undervalued Dividend Aristocrat That Could Triple In 5 Years
2022 has been a volatile year, and that’s likely to continue.
2023 could be a year when a recession begins, in fact, that’s Deutsche Bank’s base case scenario.
I’m not a market timer. I can’t tell you what’s going to happen with the economy, interest rates, or the stock market in the short-term. And guess what? Neither can anyone else.
Nobody can predict interest rates, the future direction of the economy or the stock market. Dismiss all such forecasts and concentrate on what’s actually happening to the companies in which you’ve invested. — Peter Lynch
The good news is that if you focus on safety and quality first, and prudent valuation and sound risk-management always, you never have to pray for luck on Wall Street.
Reasons To Potentially Buy Polaris
-
89% quality medium-risk 13/13 Ultra SWAN dividend champion
-
very safe 2.5% yield (92% safety score)
-
27-year dividend growth streak
-
42% conservatively undervalued (potential ultra value buy)
-
Fair Value: $177.98 (16.9x earnings)
-
9.9X earnings vs 16.5 to 18 historical
-
7.1X cash-adjusted earnings = anti-bubble blue-chip
-
Effective A+ stable outlook credit rating = 0.6% 30-year bankruptcy risk
-
risk management consensus 58th industry percentile = average, bordering on above-average
-
4% to 17% CAGR margin-of-error growth consensus range
-
10.7% CAGR median growth consensus
-
management guidance: 10+%
-
5-year consensus total return potential: 16% to 26% CAGR
-
base-case 5-year consensus return potential: 21% CAGR (6X market consensus)
-
consensus 12-month total return forecast: 39% (12.2 PE, very reasonable)
-
Fundamentally Justified 12-Month Returns: 74% CAGR
Why did we recommend buying Polaris now when it might fall even lower in a recession in 2023 or 2024?
Because it’s such a screaming bargain that it might soar 40% or more before a bear market begins, and potentially not be trading this cheaply ever again.
And if we avoid a recession entirely?
Well, then Polaris might be one of the best performing blue-chips of 2023 and 2024.
And even if we get a bear market next year, PII’s incredible fundamentals make this Ultra SWAN aristocrat one of the easiest ways to potentially triple your money in the next five years on Wall Street.
Be the first to comment