

Andrii Dodonov/iStock via Getty Images
(This article was co-produced with Hoya Capital Real Estate)
Introduction
While investors need to avoid “letting the tax tail wag their investment dog” as the saying goes, municipal bond funds can add value to an overall portfolio. Three often listed benefits include:
- Taxes: Municipal bond interest is exempt from basic Federal income taxes. Home state bonds escape state income, and maybe city taxes. That said, unless they are AMT-free, the income will count under the Alternative Minimum Tax process.
- Diversification: Over the last decade, municipal bonds show only 13% correlation to stocks. Their correlation to corporates (77%) and governments (64%) should reduce a portfolio’s Standard Deviation.
- Risk: According to Moody’s Investor Service’s annual U.S. Municipal Bond Defaults and Recoveries snapshot, from 1970-2020, the default rate – when a bond fails to make interest or principal payments – remains “rare” overall for municipal bonds, at 0.08%. Based on history, that rate falls between A and BBB-rated corporate bonds.
Fidelity Investments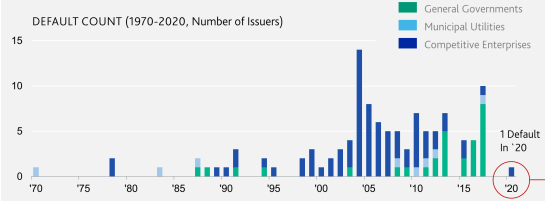
In this article, I will review two of the three PIMCO Municipal Income series CEFs. One is the PIMCO Municipal Income Fund (NYSE:PMF); the other is the PIMCO Municipal Income Fund III (NYSE:PMX). For a review of the third CEF, here is a link to its most recent review.
Describing both CEFs
Seeking Alpha gives the following description for PMF:
Primary investments (at least 90%) are municipal fixed-income securities, the interest from which is exempt from federal income tax. At least 80% of the bonds are investment grade. The Fund will seek to avoid bonds generating interest potentially subjecting individuals to the alternative minimum tax. Up to 20% of the net assets may be invested in municipal bonds that are rated Ba/BB or B. Benchmark: Bloomberg MuniLong Bond 22+. PMF started in 2001.
Source: seekingalpha.com PMF
PIMCO adds the following information about PMF’s strategy:
- The fund may invest up to 20% of its total assets in investments the interest from which is subject to the federal alternative minimum tax.
- The fund invests at least 80% of its net assets in municipal bonds that at the time of investment are investment grade quality (Baa or higher by Moody’s Investors Service, Inc. (“Moody’s) or BBB or better by S&P Global Ratings.
- The fund may invest up to 20% of its net assets in municipal bonds that are, at the time of investment, rated Ba/BB or B by Moody’s, S&P or unrated but judged by PIMCO to have met those rating rules.
- The portfolio manager also aims to preserve and enhance the value of the fund’s holdings relative to the municipal bond market, generally using proprietary analytical models that test and evaluate the sensitivity of those holdings to changes in interest rates and yield relationships.
Seeking Alpha gives the following description for PMX:
The Fund seeks current income exempt from Federal income tax through investment in investment grade municipal fixed income securities. Benchmark: Bloomberg Municipal TR USD. PMX started in 2002.
Source: seekingalpha.com PMX
PIMCO ‘s description for PMX matches the data provided for PMF.
Comparing both CEFs
| Characteristic | PMF | PMX |
| Asset Size | $263m | $286m |
| Asset Count | 243 | 255 |
| Total Fees | 136bps | 137bps |
| Leverage | 48.1% | 48.5% |
| IG Bond % | 74.5% | 71.9% |
| Not rated % | 15.1% | 16.1% |
| Price Yield | 6.00% | 6.21% |
| Premium/Discount | 5.88% | 2.89% |
| 0-5Yr Call/Maturity | 32%/26% | 34%/25% |
| Effective Duration/Maturity (yrs) | 13.8/11.4 | 12.1/14.2 |
Holdings analysis
PIMCO; compiled by Author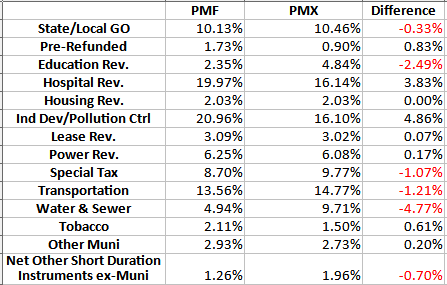
There are four sectors where the weights vary by 2% or more, with the biggest two, in opposite directions, being Industrial/Pollution favoring PMF and Water/Sewer favoring PMX.
The Top state exposures are:
PIMCO; compiled by Author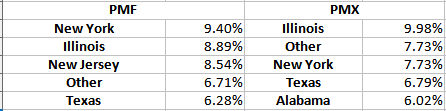
While in a different order, three of the Top 5 are on both lists.
PIMCO; compiled by Author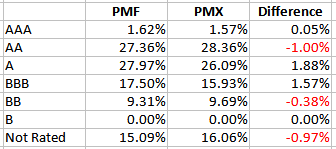
Using just the rated weights, both portfolios come in at a BBB+ rating.
Top 10 holdings for PMF:
PIMCO; compiled by Author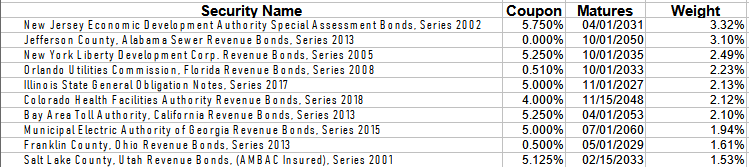
Top 10 holdings for PMX:
PIMCO; compiled by Author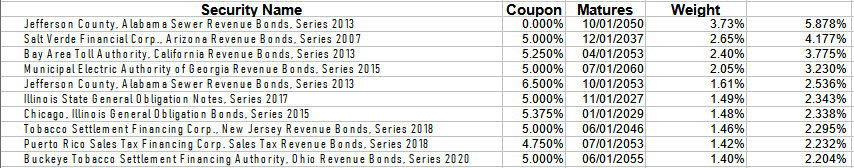
The above differences are seen by comparing the Top 10 from each CEF; only four appear in both lists.
Distribution analysis
Seeking Alpha PMF DVDs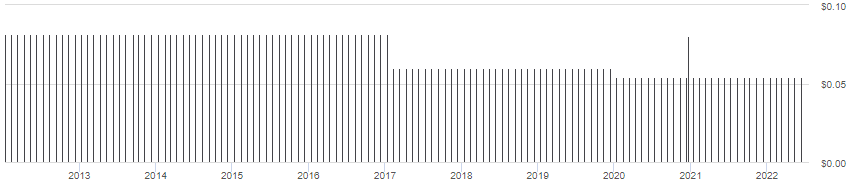
PMF last cut the payout at the start of 2020.
Seeking Alpha PMX DVDs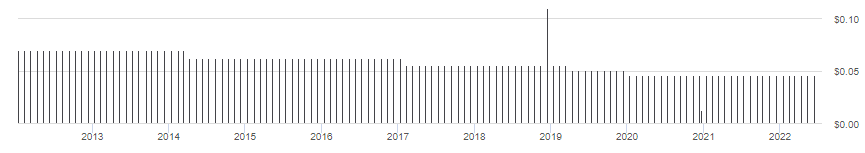
While PMX also last cut the payout at the start of 2020, its history shows a few more reductions than PMF shows.
PIMCO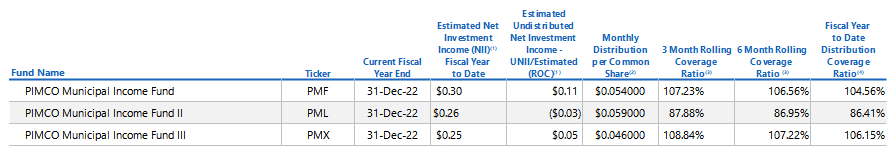
I included the third CEF, the PIMCO Municipal Income Fund II (PML). While both PMF and PMX are earning their payouts, PML has only an 86% coverage of theirs.
Discount review
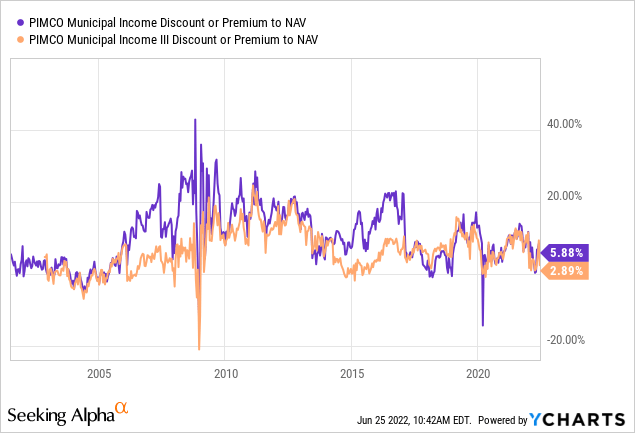
Both funds show a history of selling at a premium, with little time where investors could buy in at a discount. Over the last ten days, PMX has been near a 3% premium, whereas PMF has been more volatile, moving from 5%, down to 1%, up to 8%, and now at 5.88%.
Performance and risk analysis
I included PML here also as it has some of the best results by a slight margin over PMF. PMX trails on most values.
Portfolio Visualizer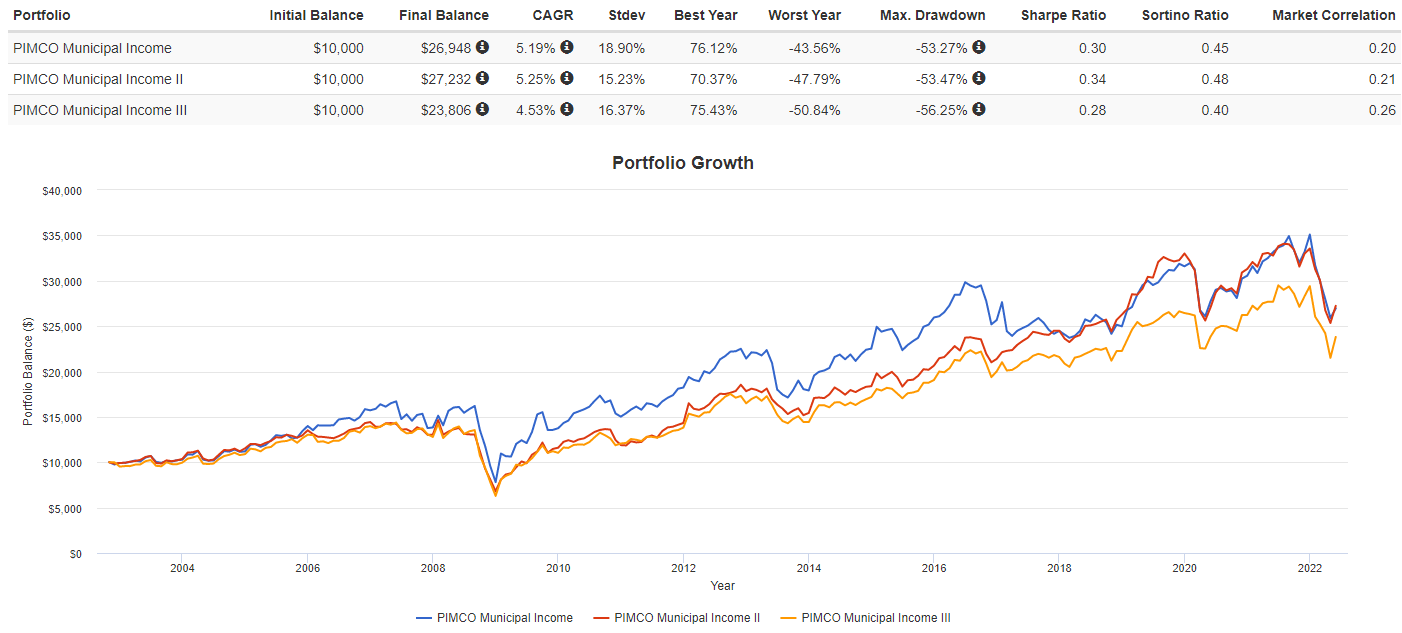
While PMX places 3rd in CAGR since it started, it has the best 3-month return, though still negative. Over the past 3-, 5-, and 10-yr periods, it places second behind PML. PMF was on top for the 10-yr period that ended with the start of 2017, showing how changing the dates used can change the outcome. Between PMF and PMX, the risk statistic “winner” is not consistent with both lagging behind PML.
Portfolio strategy
While the three CEFs have alternated as to whom was the best performer, there are differences in risk an investor took using a Buy/Hold strategy. Now, I will test PMF against other bond strategies to see if avoiding income taxes should be attempted. While I can show the data, each investor then needs to evaluate it against their own tax situation. Here I will compare PMF against the following CEF funds:
- Nuveen Taxable Municipal Income Fund (NBB)
- PIMCO High Income Fund (PHK)
- PCM Fund (PCM), a multi-sector fund
Portfolio Visualizer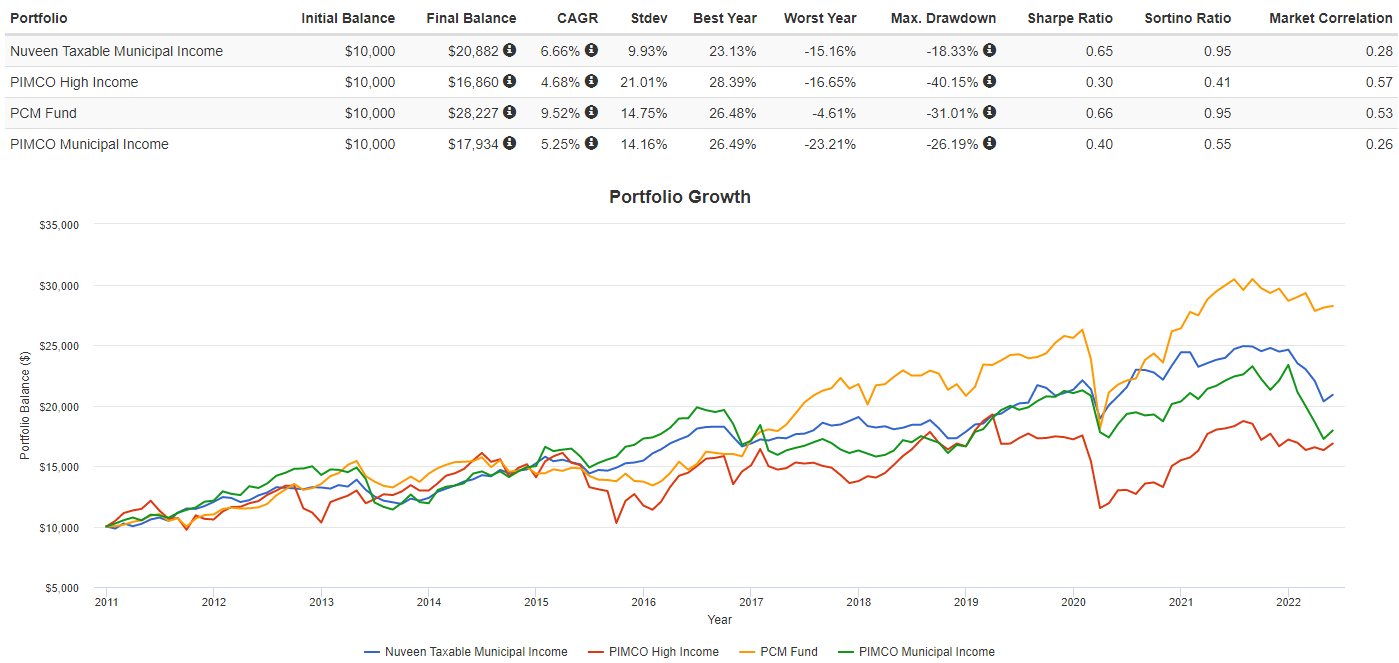
Based on returns, the “best” fund has changed over time as one might expect. Since 2017, the multi-sector fund, PCM, has provided the best results. Whether NBB’s 141bps higher CAGR versus PMF is still the better after-tax Municipal bond performer requires adjusting for taxes paid on NBB’s payouts.
Final thoughts
For current holders of PMF or PMX, I would say they are Holds. Investors looking to add to their fixed income allocation have plenty of choices presented by multiple Seeking Alpha contributors, some of whom specialize in such investment vehicles. More than most investment sectors, taxes play an important part in that decision; increasingly so as one’s marginal tax rates climb.
In the current environment, short duration funds should do better, along with ones with a high percent of their portfolio maturing in the next 1-3 years. I am working on an article that highlights such a fund. Keep in mind that things will change, and when rates peak, switching to a longer-duration fund would be worth considering.
Be the first to comment