

Petmal
Price Action Thesis
We follow on our previous Speculative Buy thesis on Plug Power Inc. (NASDAQ:PLUG), as there were noteworthy developments in its price action. Our thesis has progressed well, with PLUG significantly outperforming the market over the past month.
In early June, we upgraded our rating (from Sell) as we noted a bear trap (significant rejection of selling momentum) predicated on May lows. Therefore, we were confident it could offer experienced investors a reasonable risk/reward profile on a near-term Buy set-up, leveraging a counter-trend speculative opportunity.
However, we lower our near-term price target (PT) to $23. Also, investors considering cutting some exposure from the previous set-up can do so at the current levels.
As such, we reiterate our Speculative Buy rating on PLUG, with a reduced PT of $23, implying a potential upside of 16%. However, given the lowered potential upside, investors can consider waiting for a deeper retracement before adding exposure.
PLUG – The Bears Were Eviscerated in June
Shortly after we published our article in early June, the bears had initially assumed control as it attempted to re-test PLUG’s May lows. Coupled with the general market’s bearish bias, the bears were seen to have a field day leveraging the downside bias.
PLUG 1M performance % (Koyfin)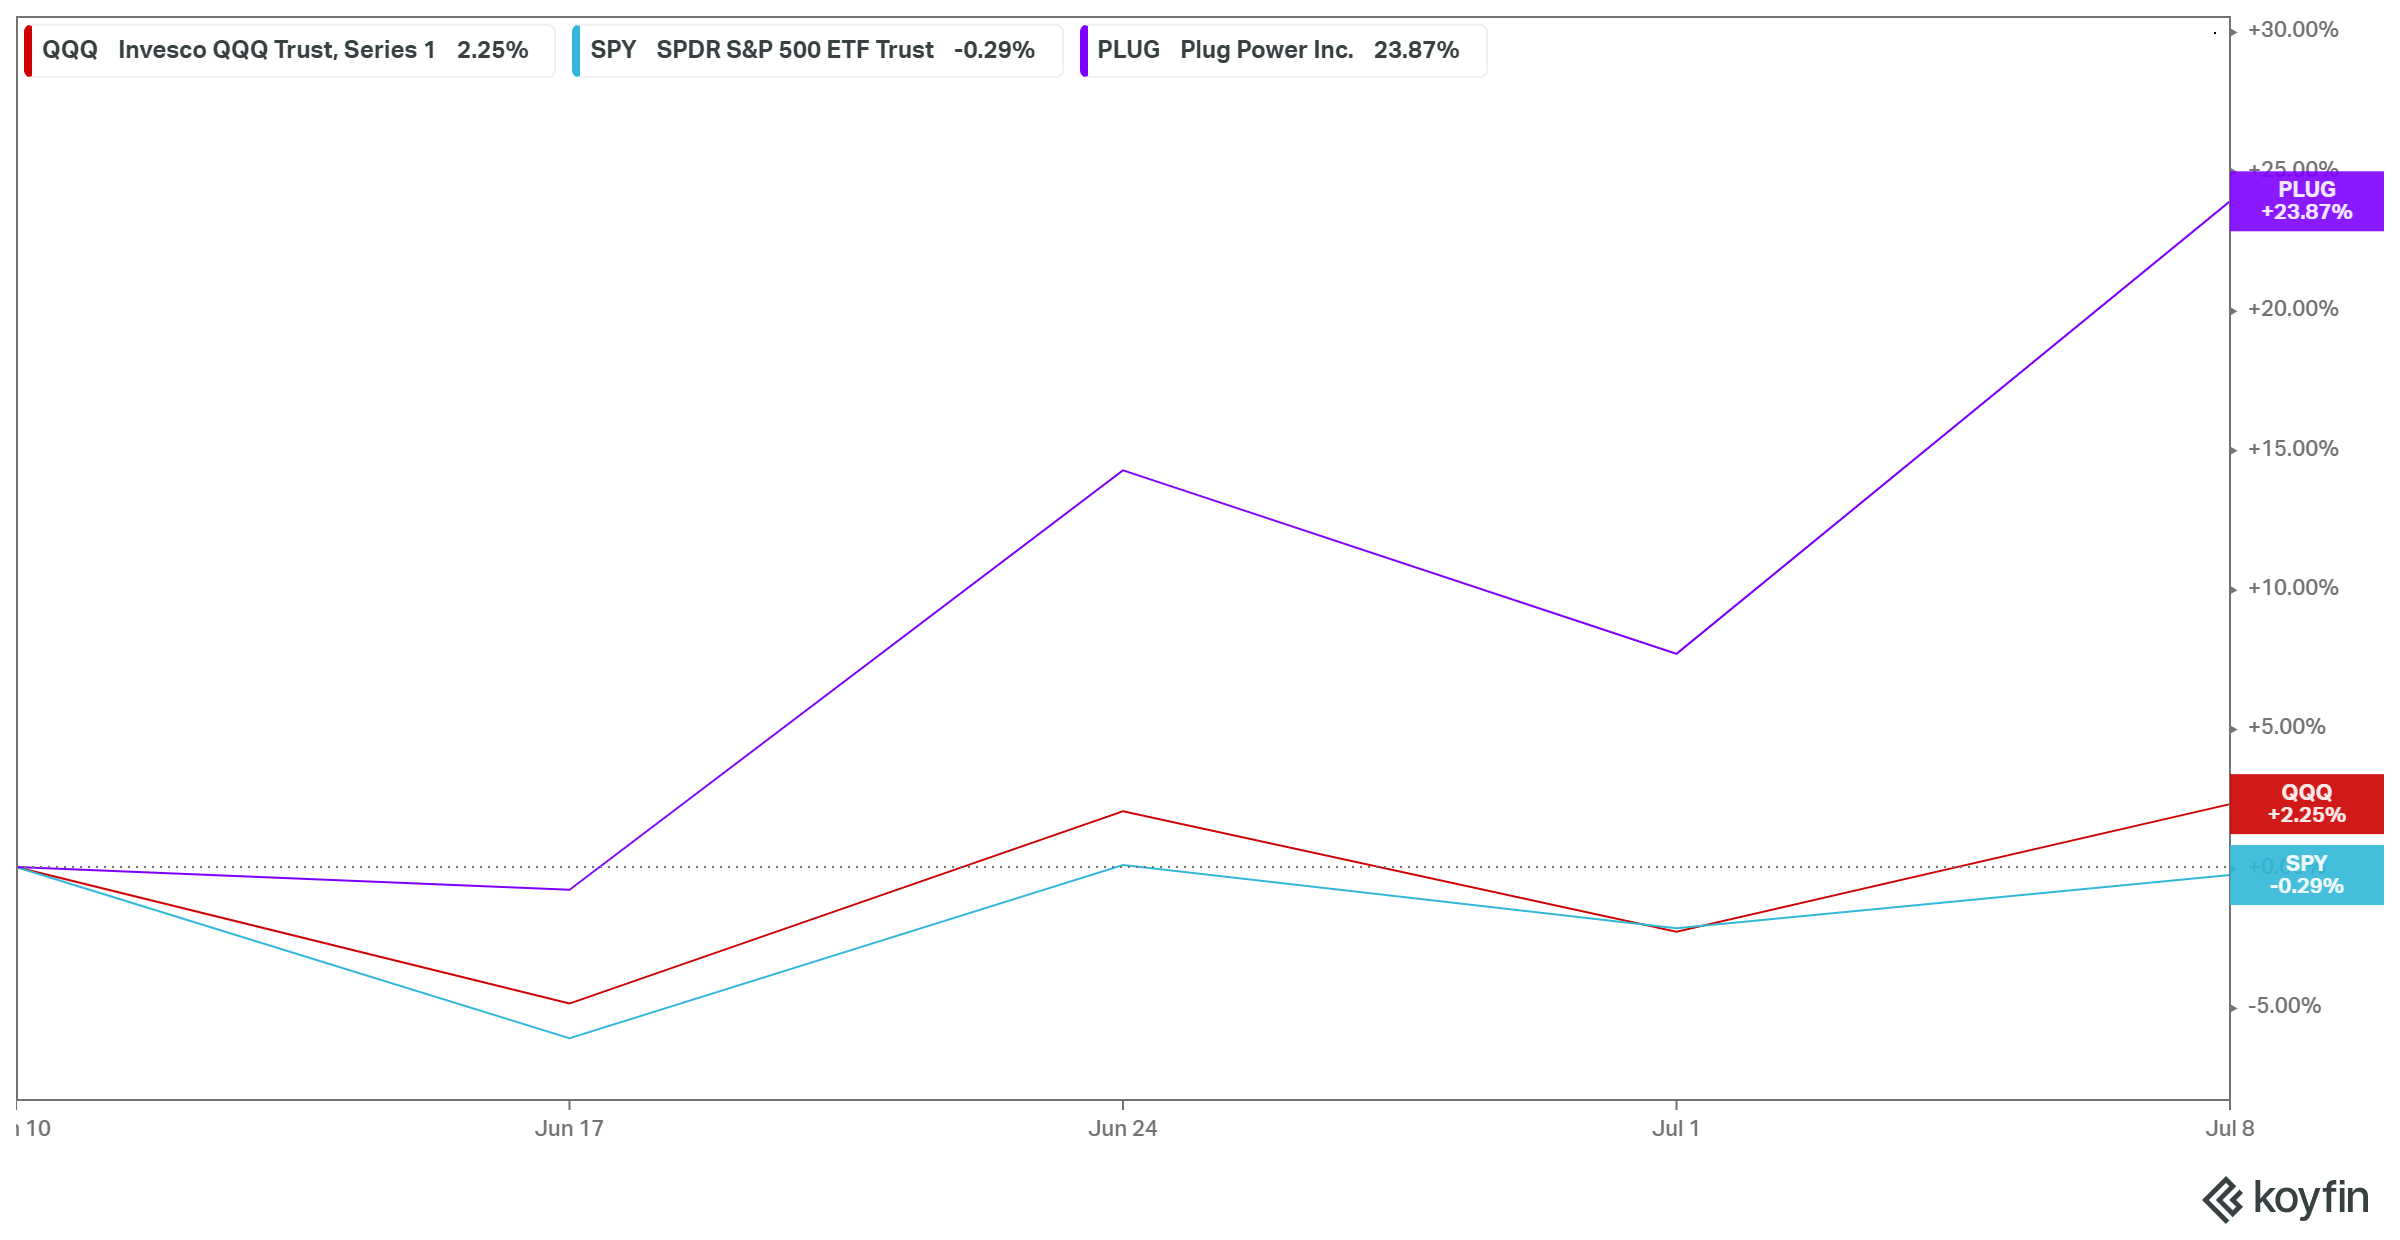
However, the potency of May’s bear trap continued to demonstrate the strength of its buying support. As a result, PLUG didn’t re-test its May lows and significantly outperformed the Invesco QQQ ETF (QQQ) and the SPDR S&P 500 ETF (SPY). Notably, PLUG posted a 1M gain of 23.87%, significantly outperforming the QQQ (2.25%) and SPY (-0.29%).
PLUG price chart (monthly) (TradingView)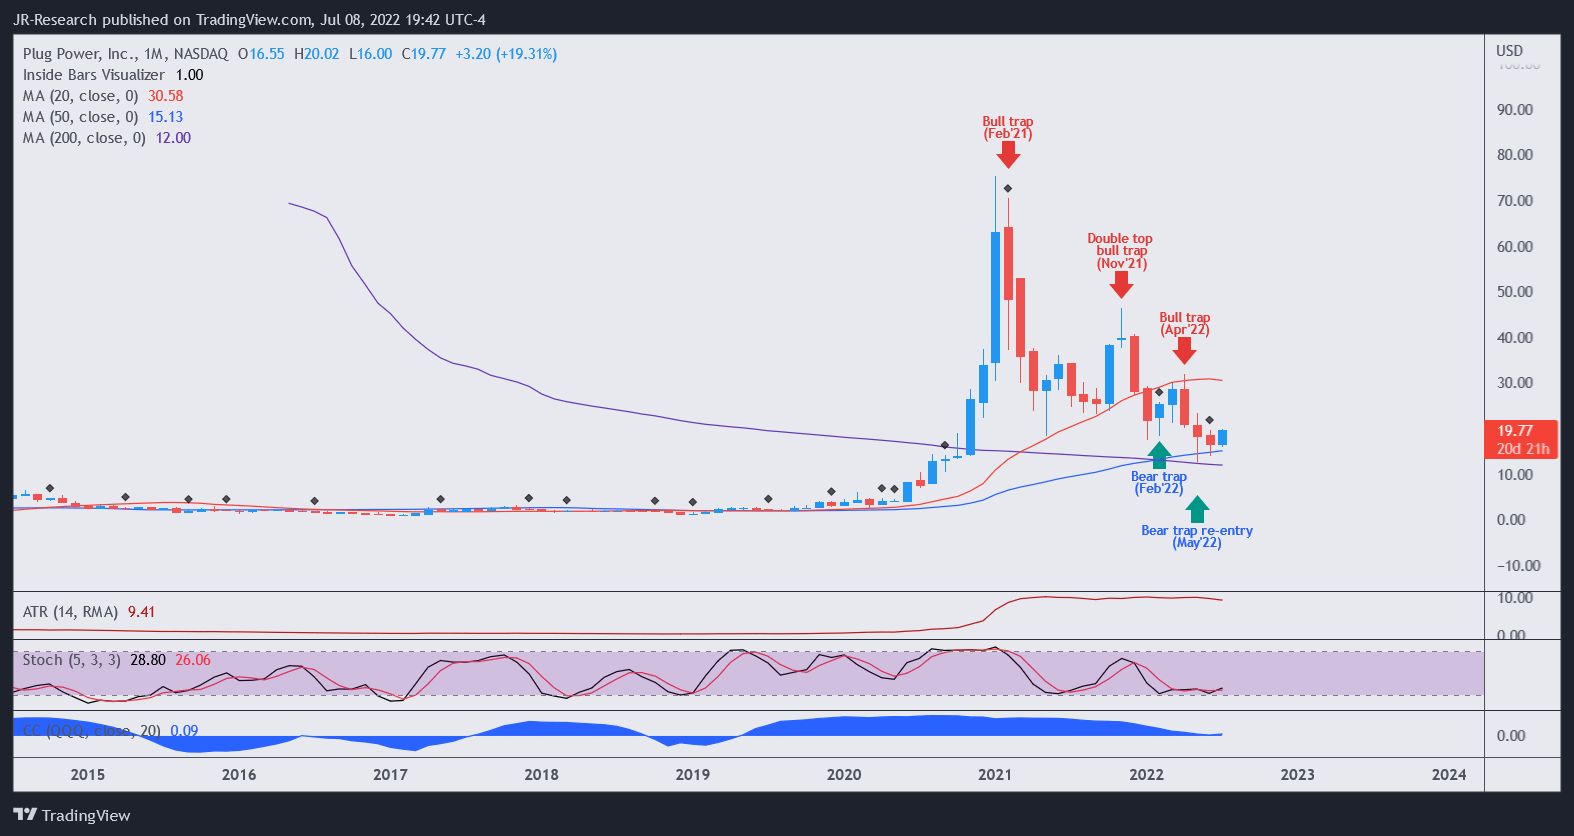
Therefore, we urge investors to pay attention to PLUG’s specific price structures and not just focus on the market’s momentum. Also, PLUG’s structures are not similar to the market’s, allowing investors to cherry-pick opportunities based on price action.
As seen in PLUG’s long-term chart above, May’s bear trap was a re-entry signal predicated on an initial bear trap in February. Re-entry signals usually corroborate the potency of the initial set-up. In addition, they indicate a revalidation of the previously failed set-up (remember, no set-ups are 100%, especially for speculative stocks) by forcing another bottom subsequently.
Furthermore, plenty of bad news in June tested PLUG’s buying momentum. For instance, JPMorgan (JPM) lowered its PT to $28 (our previous PT) in late June, as it cited “persistent margin headwinds in Plug Power’s fueling and service business as a result of elevated natural gas prices.” But, these did not break May lows, as June formed a higher low, indicating the market absorbed selling pressure at the critical support levels.
Of course, some bears could point to positive developments for renewable companies in early July that indicated that the “US would lift tariffs on Canadian solar products, settling a dispute on trade in solar products under the USMCA agreement.”
However, PLUG has already been setting up a resilient bottom since May. Therefore, we believe the market has priced in significant headwinds into its May bear trap. If investors waited until positive news appeared, the price action would have moved significantly (remember, price action is forward-looking).
PLUG price chart (weekly) (TradingView)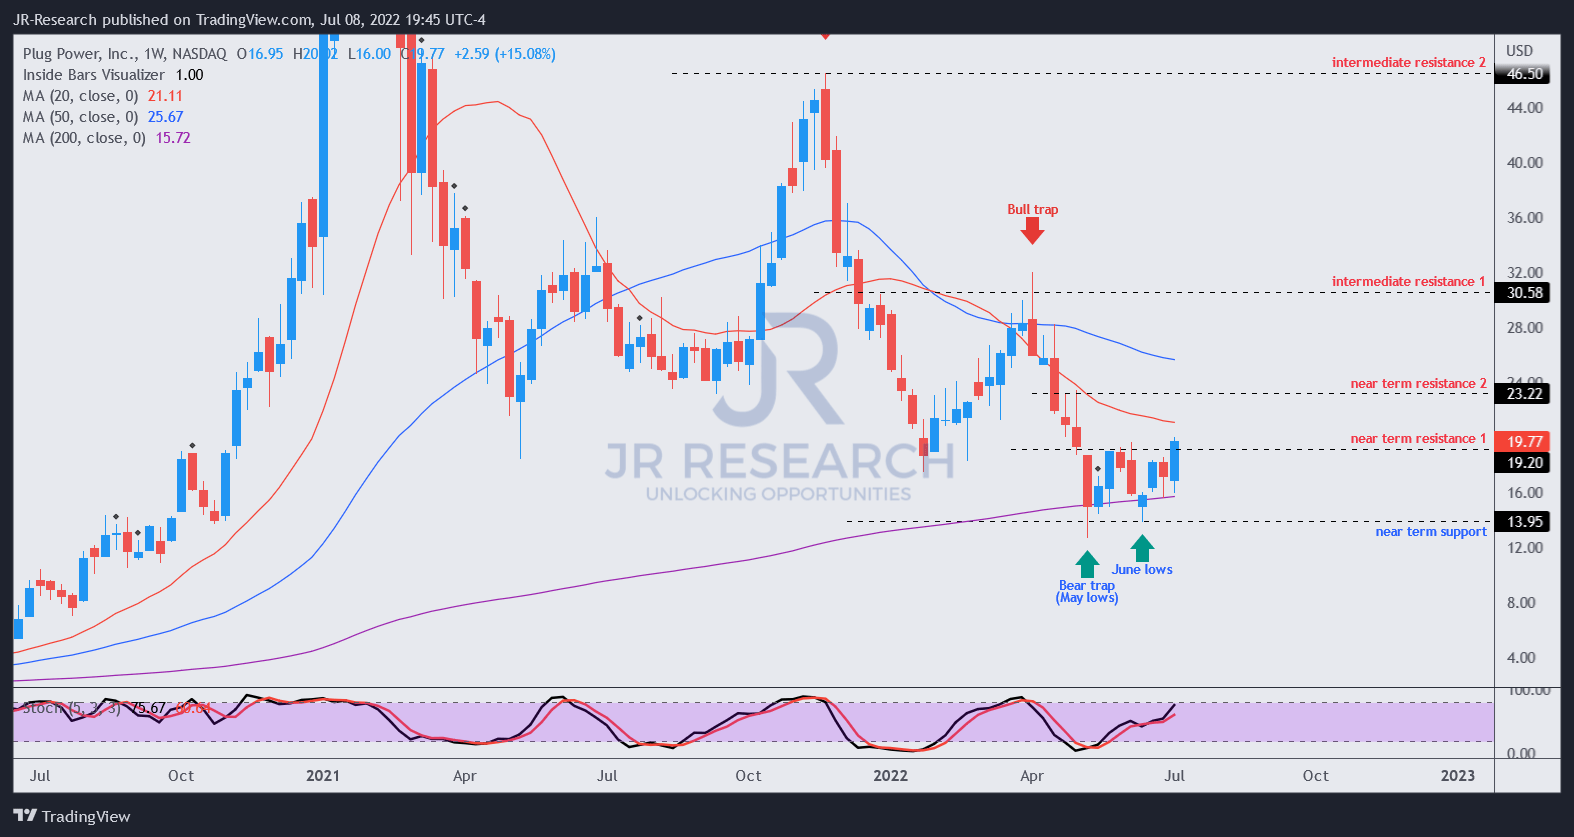
For instance, investors can observe the most recent blue mark-up price bar on the right, indicating a flush-up buying momentum. So, if you wait for the news, you would have missed the lower-risk entry points in May or June. Also, it’s re-testing its “near-term resistance 1,” which was a source of buying momentum failure in early June.
Accordingly, we don’t usually enter directionally bullish set-ups relying on breakout (price action breaking above a critical resistance zone) price structures. The market could use them to draw investors into a possible bull trap (significant rejection of buying momentum).
Therefore, it remains tentative whether PLUG can retake its $19 resistance level. However, if it can do so decisively, reaching our near-term PT of $23 seems likely.
Notwithstanding, we encourage investors to wait for a retracement first to proffer them a more attractive risk/reward set-up.
Is PLUG Stock A Buy, Sell, Or Hold?
We reiterate our Speculative Buy rating on PLUG for experienced investors only. In addition, we revise our near-term PT to $23, implying a potential upside of 16% as of July 8’s close.
Furthermore, investors who used our set-up in early June can consider cutting exposure or using a trailing stop to protect gains if PLUG fails to reach our $23 near-term PT before forming a bull trap.
But, we must highlight that we don’t usually trade in a breakout set-up and would urge investors to wait for a meaningful retracement first. The market could use the recent price action to set up another potential bull trap, denying further upward momentum.
Also, investors are urged to use appropriate risk management strategies to protect their gains (trailing stops) or capital (stop-losses) for speculative opportunities like PLUG.
Notwithstanding, we don’t encourage less experienced investors to hold the bag on PLUG due to its weak fundamentals and medium-term bearish bias.
Be the first to comment