

Bet_Noire
We all now know the stock market’s quick jump upward from mid-June to mid-August was simply a bear-market rally that quickly fizzled out and has already given back almost all the gains. And, as mentioned in the bullets above, the macro-environment appears to just keep getting worse, with Putin now weaponizing energy supplies to the EU and China’s continuing covid-19 lockdowns. As a result, it’s very hard to get bullish on the markets despite the 13.7% pullback in the S&P 500 so far this year. As a result, investors that are over-weight growth and/or the broad market averages should consider allocating some capital to the Vanguard S&P 500 Value ETF (NYSEARCA:VOOV). VOOV is a relatively cost-efficient fund (0.10% fee), yields 2.1%, and has an attractive 10.8% average annual total return over the past 10-years.
Investment Thesis
The Value sector has significantly outperformed most others during the 2022 bear-market:
Seeking Alpha Homepage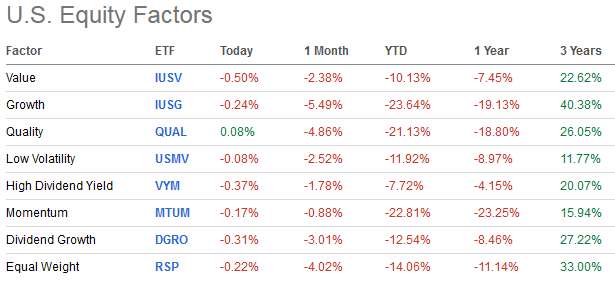
As shown in the graphic above, the Value Sector has outperformed all other sectors with the exception of the high dividend yield segment. While still down 7.45% over the past year – as measured by the iShares Core S&P U.S. Value ETF (IUSV) – that is still 6% better than the S&P 500.
The fact is, in times of turbulent, volatile, and weak equity markets, the value sector can add ballast to a portfolio in the same way that the consumer staples (XLP) or utilities (XLU) sectors can (those two are up 0.3% and 9.1% over the past year, respectively).
So, today let’s take a closer look at the Vanguard S&P 500 Value ETF to see how it has positioned investors for success going forward.
Top-10 Holdings
The top-10 holdings in the Vanguard S&P 500 Value ETF are shown below and equate to only 18.4% of the entire portfolio and is therefore what I consider to be a very well diversified fund:
Vanguard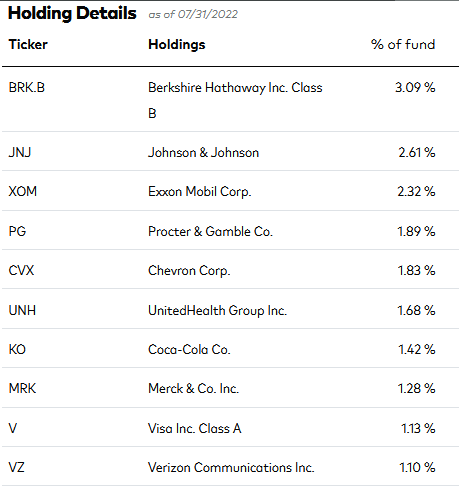
The #1 holding is Berkshire Hathaway Class B (BRK.B) with a 3.1% weight. Berkshire is a conservative and well-diversified company whose largest current holding is Apple (AAPL) with a 40.8% weight (a $122.3 billion position). The top-5 holdings in Berkshire are shown below and the entire BRK portfolio can be found here, and is generally defensive in nature.
hedgefollow.com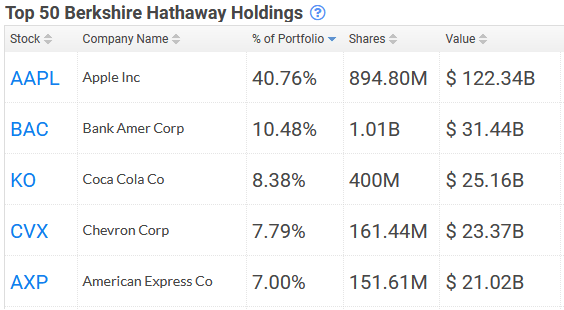
Berkshire Hathaway currently has $146.7 billion in cash and short-term investments and is therefore ideally positioned to play offense once the markets turnaround (or tanks).
In aggregate, typically defensive healthcare stocks like Johnson & Johnson (JNJ), UnitedHealth Group (UNH), and Merck (MRK) equate to 5.6% of the VOOV portfolio. These three stocks yield 2.78%, 1.28%, and 3.2%, respectively. The following chart shows these three stocks’ performance versus the S&P 500 over the past year:
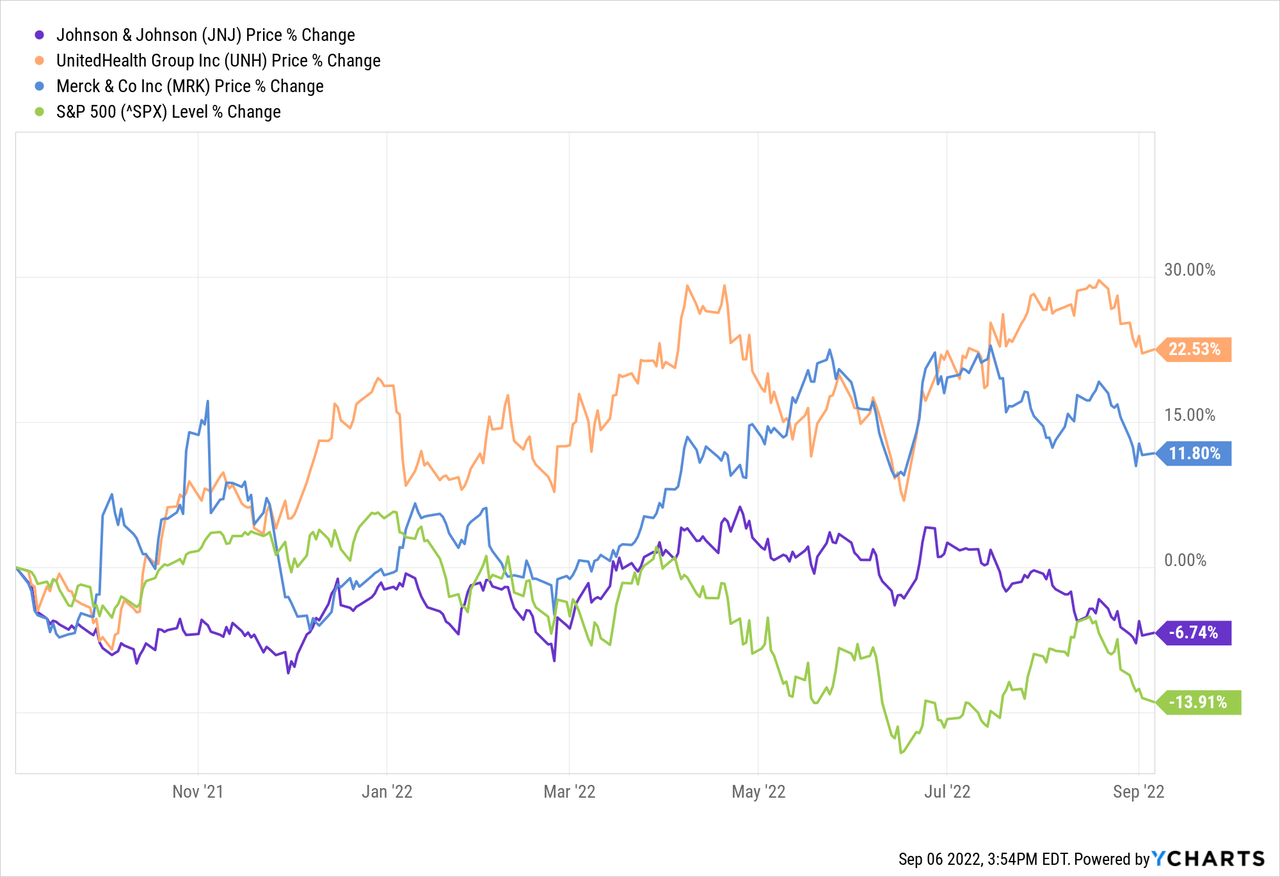
As can be seen, all three have significantly outperformed the S&P 500, with UNH being the star performer: +22.5%.
The #3 and #5 holdings are integrated international major energy companies Exxon (XOM) and Chevron (CVX), with a combined weight of 3.2%. Exxon and Chevron both had monster Q2 earnings reports and generated free-cash-flow of $16.9 billion and $10.6 billion, respectively. Both these companies have global production portfolios that are ideally positioned to benefit from strong oil, natural gas, and LNG pricing.
Exxon shareholders have arguably benefited from the fact that activist hedge-fund Engine #1 won three seats on Exxon board-of-directors and has, as a result, totally changed Exxon’s structure and strategy going forward (see How Tiny Engine #1 Was Able To Turnaround Exxon). Exxon currently yields 3.68% after raising the quarterly dividend by only a penny last year, while Chevron yields 3.60% after a 6% dividend increase ($0.08/share). Both companies are using the current up-cycle to put in place significant share buyback plans (Exxon’s is $30 billion by the end of 2023, Chevron’s is $15 billion per year).
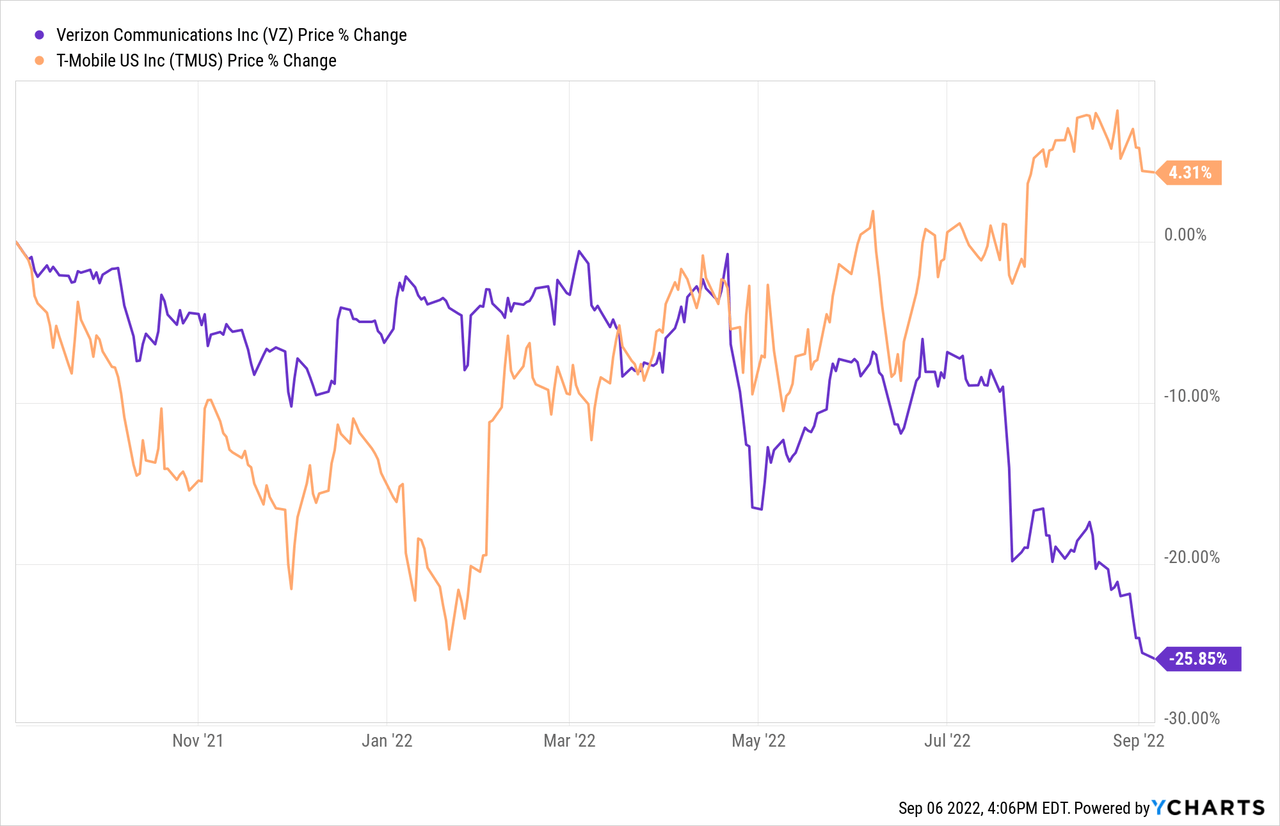
Verizon (VZ) rounds out the top-10 holdings with a 1.1% weight. The good news here is that VZ yields 6.2%. The bad news is that T-Mobile (TMUS) is eating Verizon’s lunch with a newer and arguably better performing network:
From an overall portfolio perspective, the largest allocation of capital are to the HealthCare (16.9%), Financials (14.6%), and Industrials (12.3%) sectors. Financials, in particular, typically do well in a rising rate environment because they can profit of the interest rate spread (i.e. the difference between the rate they can borrow at versus the higher rate they can lend at).
Performance
VOOV’s long-term performance versus the S&P 500 is shown below:
Vanguard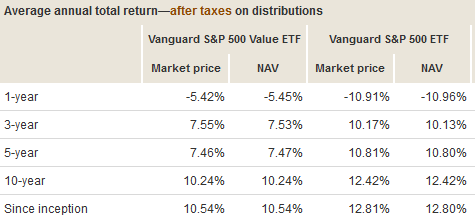
Source: Vanguard Fund Comparison Tool
VOOV’s long-term 10.54% average annual return is quite attractive in a weak market considering its lower risk profile (see below in “Risks” section). However, the long-term returns of the Vanguard S&P 500 ETF (VOO) are 2.3% higher and, for that reason alone, I advise investors to always own a significantly higher allocation to the VOO fund as compared to a value oriented fund like VOOV.
The graphic below compares the VOOV to some direct competitors: the Vanguard Value ETF (VTV), the iShares Russell 1000 Value ETF (IWD), and the iShares Core S&P Value ETF over the past year:
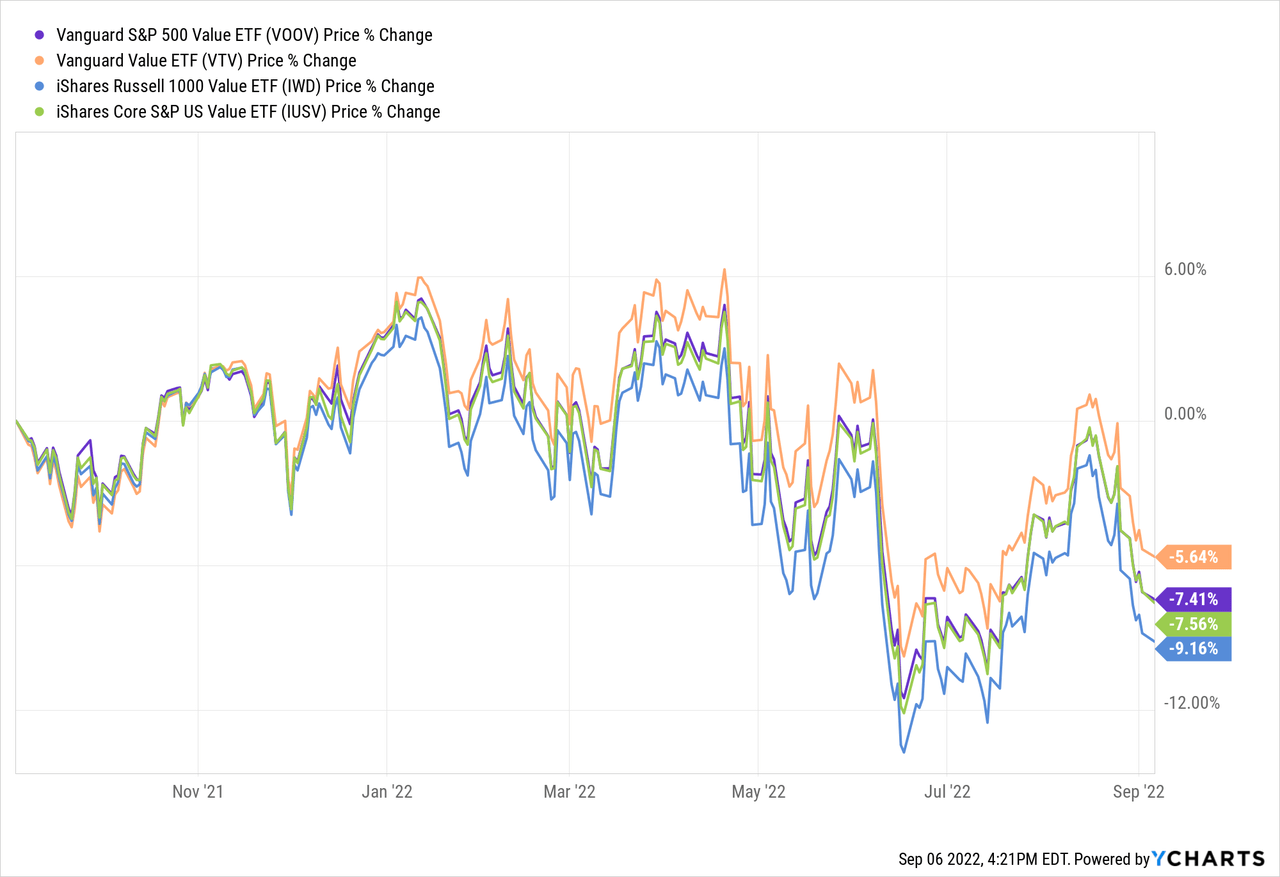
Clearly the VTV ETF is the star of the show in that it is down the least amount. The VTV ETF has a significantly lower expense fee (0.04%) than does the VOOV ETF, a very similar portfolio, and a better 10-year performance track record (11.73%).
Risks
Obviously the VOOV fund is not immune to the negative headwinds from the macro-investment environment discussed earlier – after all, the ETF is still down 6.7% YTD. However, in a challenging market where rising interest rates threaten valuation levels, note that the VOOV ETF’s portfolio trades at a significant discount to the overall S&P 500:
Vanguard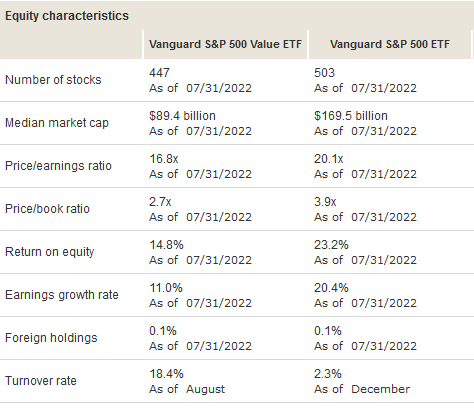
Clearly, VOOV’s P/E and price-to-book ratios are significantly lower as compared to the broad S&P 500 as measured by the Vanguard S&P 500 ETF. However, also note how – as expected – VOOV’s ROE and EPS growth rates are also significantly lower as compared to the VOO ETF. And this is the trade-off investors make when investing in value versus the overall market and/or growth stocks.
Summary & Conclusion
The Vanguard S&P 500 Value ETF is a sleep-well-at-night (“SWAN”) fund that can add ballast to a portfolio in times of weak market performance. However, as shown above, the Vanguard VTV Value ETF appears to be a superior choice with lower fees, better performance, and a similarly defensive portfolio. While VOOV is an attractive ETF (I rate it a HOLD) at the present time, the VTV ETF is the BUY.
Be the first to comment