

FreezeFrames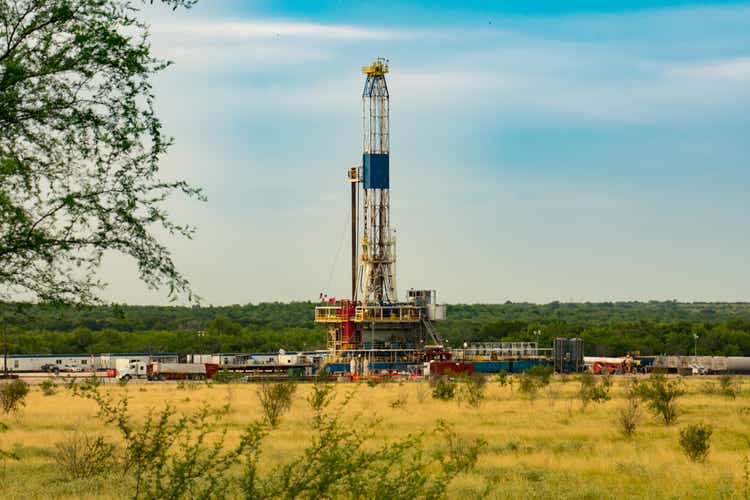
Introduction
Pioneer Natural Resources Company (NYSE:PXD) is one of the largest independent E&P companies in the United States.
The company produces exclusively in the Permian Basin and owns extensive acreage. The company said it holds a deep inventory of high-quality locations in the Midland Basin.
PXD inventory of high-quality locations (PXD Presentation)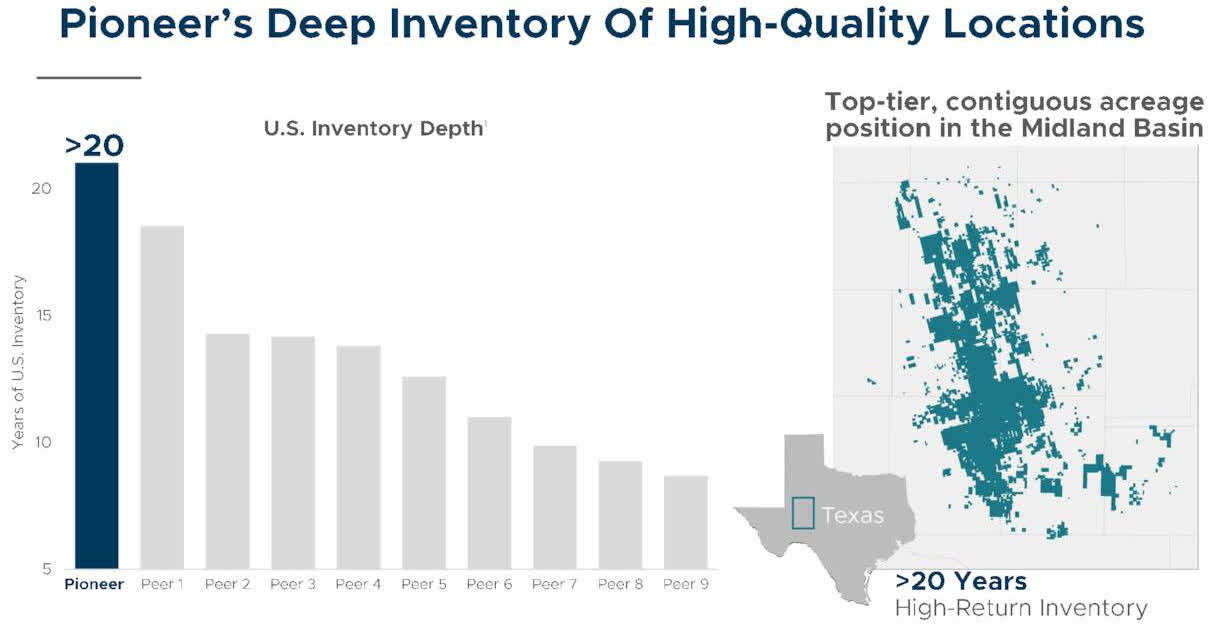
This solid oil company has been added to my domestic E&P, which includes EOG Resources (EOG), Occidental Petroleum (OXY), Devon Energy (DVN), and two US supermajors, Chevron Corp (CVX) and Exxon Mobil (XOM).
However, one great advantage of PXD is its very generous dividend policy, with a yield of 10.4% today.
PXD Dividend Presentation (PXD Presentation)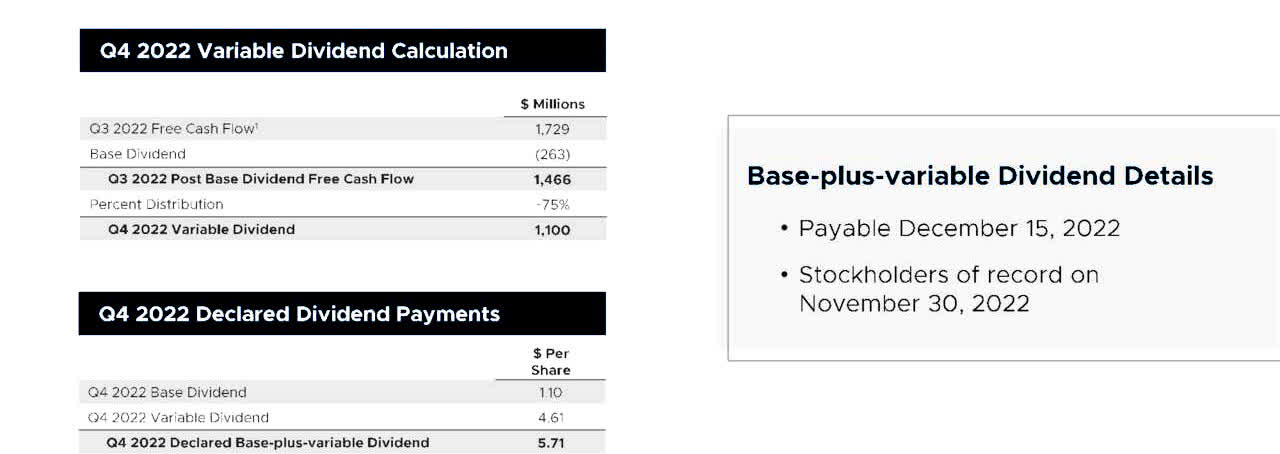
1 – Investment Thesis
Pioneer Natural Resources came out with adjusted quarterly earnings of $7.48 per share in 3Q22, beating analysts’ expectations slightly, compared to earnings of $4.13 per share a year ago.
The company estimates production for 2022 between 350K Boep/d and 365K Boep/d and an estimated $8+ billion in free cash flow.
PXD 2022 guidance (PXD Presentation)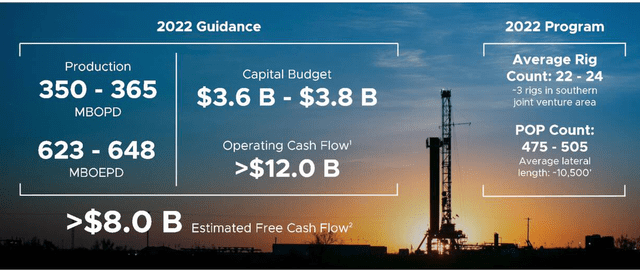
However, oil prices have been highly volatile recently and retraced significantly due to rampant inflation forcing the FED to hike interest rates numerous times in 2022.
On December 14, 2022, Goldman Sachs cut its oil price forecasts for 2023, saying it expects a market surplus early next year, easing risks of winter price spikes.
The bank said there was less risk of oil prices spiking this winter with China consuming less than previously expected, Russia exporting near pre-war levels, and production issues easing in Kazakhstan and Nigeria.
Still, oil and gas prices are up on a one year-basis but significantly down from their high in June, as shown below:
PXD Chart Oil and NG one-year (Fun Trading StockCharts)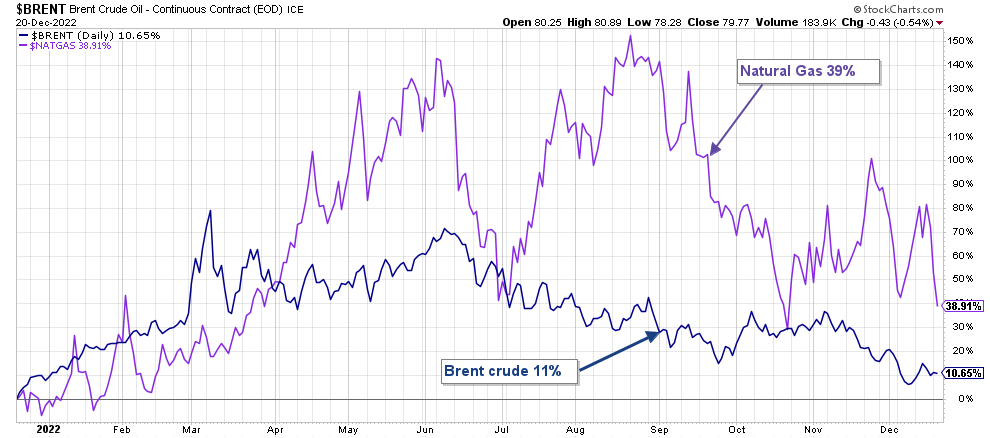
In short, the fourth quarter earnings will likely be down significantly quarter over quarter, with liquids prices going down potentially 15% to 20%. I estimate generic free cash flow in 4Q22 is down to $1.2 billion from $1.9 billion in 3Q22. Analysts expect a slight recovery for oil in 2023, but I am not convinced, especially after learning what is happening in China.
While the US economy is expected to slow, a contraction in European and UK economies are also likely to stifle oil demand. OPEC forecasts suggest that the largest increases to demand are likely to come from China and India. These economies are expected to grow somewhere between 5% and 6% respectively in 2023. The easing of lockdown restrictions in China, if furthered through a softening of zero-tolerance policy could provide more support to demand (upside risk). An increase in petrol (gasoline) and diesel through industrial demand suggests a modest increase in world demand forecast by OPEC of 2.3% (2.25million barrels per day) in 2023.
Thus, it is crucial to use any upticks to take short-term profit LIFO as I have advocated for many years in my marketplace, “the Gold and oil corner.”
2 – Stock Performance And Commentary
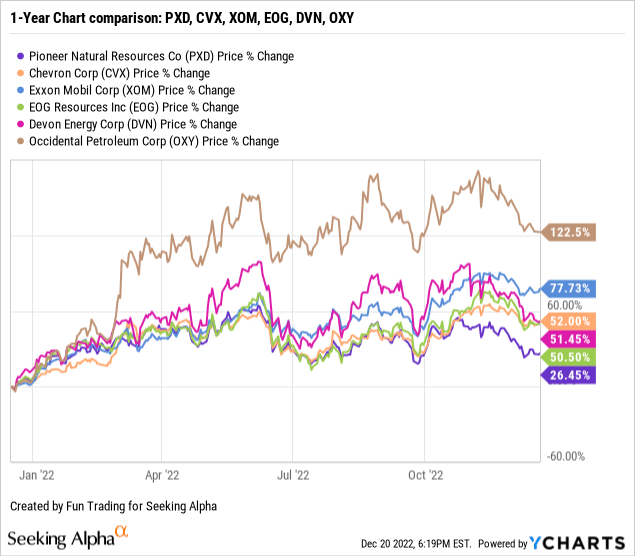
PXD continues to underperform its peers significantly, especially Occidental Petroleum, up 123% on a one-year basis. However, PXD rewards shareholders with a very high dividend policy, unlike Occidental Petroleum (OXY). PXD is now up 26% on a one-year basis.
CEO Scott Sheffield said in the conference call:
Pioneer delivered strong results, generating over $1.7 billion in free cash flow during the third quarter, contributing to the return of $1.9 billion back to the shareholders. The majority of this capital is being returned through our base plus variable dividend of $5.71 per share, which will be paid in mid-December. Additionally, we continue to execute on opportunistic share repurchases, with $500 million of shares retired in the third quarter at an average price of $218, representing approximately 2.3 million shares.
Pioneer Resources – Financial Table 3Q22 – The Raw Numbers
| Pioneer Natural Resources | 3Q21 | 4Q21 | 1Q22 | 2Q22 | 3Q22 |
| Revenues in $ Million | 4,961 | 5,576 | 6,147 | 7,005 | 6,057 |
| Total Revenues + other in $ Million | 4,463 | 4,317 | 6,172 | 6,920 | 6,093 |
| Net Income in $ Million | 1,045 | 763 | 2,009 | 2,371 | 1,984 |
| EBITDA $ Million | 2,081 | 1,693 | 3,212 | 3,681 | 3,164 |
| EPS diluted in $/share | 4.07 | 2.97 | 7.85 | 9.30 | 7.93 |
| Operating cash flow in $ Million | 1,992 | 2,225 | 2,584 | 3,221 | 2,945 |
| CapEx in $ Million | 998 | 978 | 917 | 917 | 972 |
| Free Cash Flow in $ Million | 994 | 1,246 | 1,667 | 2,304 | 1,973 |
| Cash and cash equivalent $ Million | 725 | 4,040 | 3,256 | 3,252 | 1,822 |
| Total Debt in $ Million | 6,929 | 6,932 | 5,690 | 5,693 | 5,214 |
| Dividend per share in $ | 2.07 | 3.64 | 3.78 | 7.38 | 8.57 |
| Shares outstanding (diluted) in Millions | 257 | 258 | 256 | 254 | 250 |
| Oil Production | 3Q21 | 4Q21 | 1Q22 | 2Q22 | 3Q22 |
| Oil Equivalent Production in K Boep/d continuing operations) | 675.793 | 687.143 | 637.756 | 642.844 | 656.582 |
| Global Natural gas price ($/MMBtu) | 4.05 | 5.20 | 4.81 | 6.72 | 7.58 |
| Price per $/Boe | 52.79 | 58.78 | 68.48 | 79.31 | 69.93 |
Source: PXD press release Q3
Analysis: Revenues, Earnings Details, Free Cash Flow, Debt, An Oil & Gas Production
1 – Total Revenue and Others was $6,057 million in 3Q22
PXD Quarterly Revenues history (Fun Trading)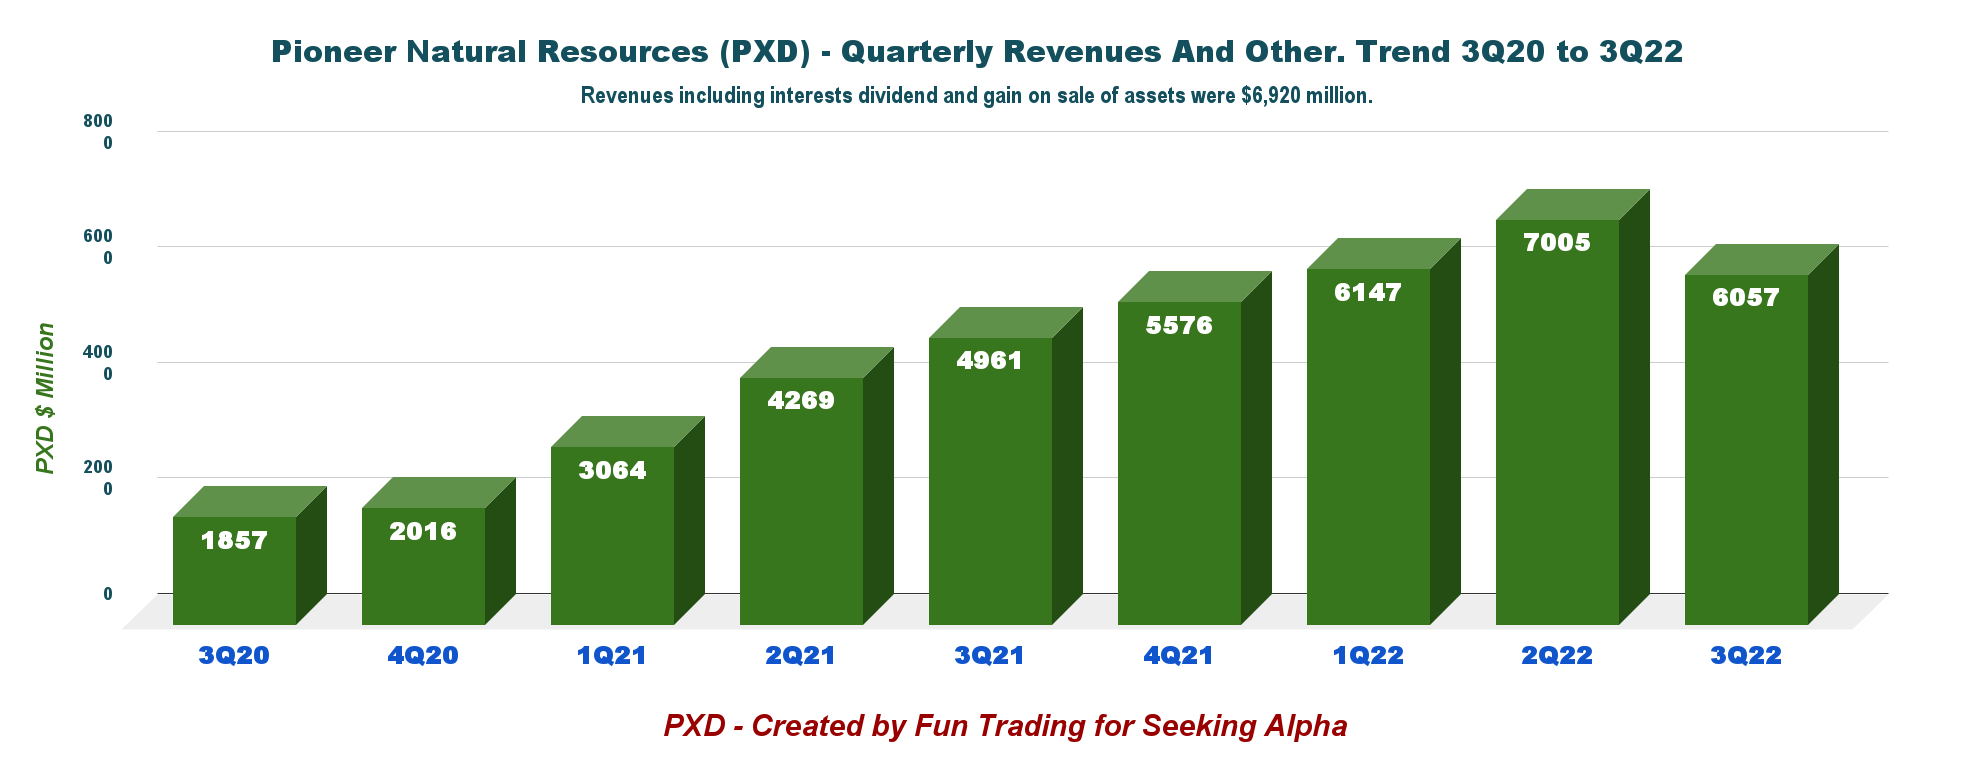
Note: Revenues from oil and gas and others were $6,093 million in 3Q22.
Pioneer Natural Resources reported a net income of $1,984 million, or $7.93 per diluted share, for the third quarter of 2022 compared to $1,045 million or $4.07 in 3Q21.
The net cash provided by continuing operations activities in 3Q22 was $2,945 million, compared with $1,982 million in 3Q21.
2 – Free Cash Flow was $1,973 million in 3Q22
PXD Quarterly Free cash flow history (Fun Trading) Note: The generic free cash flow is cash from operating activities minus CapEx. The company used another way to calculate the Free cash flow, which came to $1,729 million in 3Q22. The generic free cash flow was $1,973 million in 3Q22. The trailing 12-month free cash flow is $7,190 million.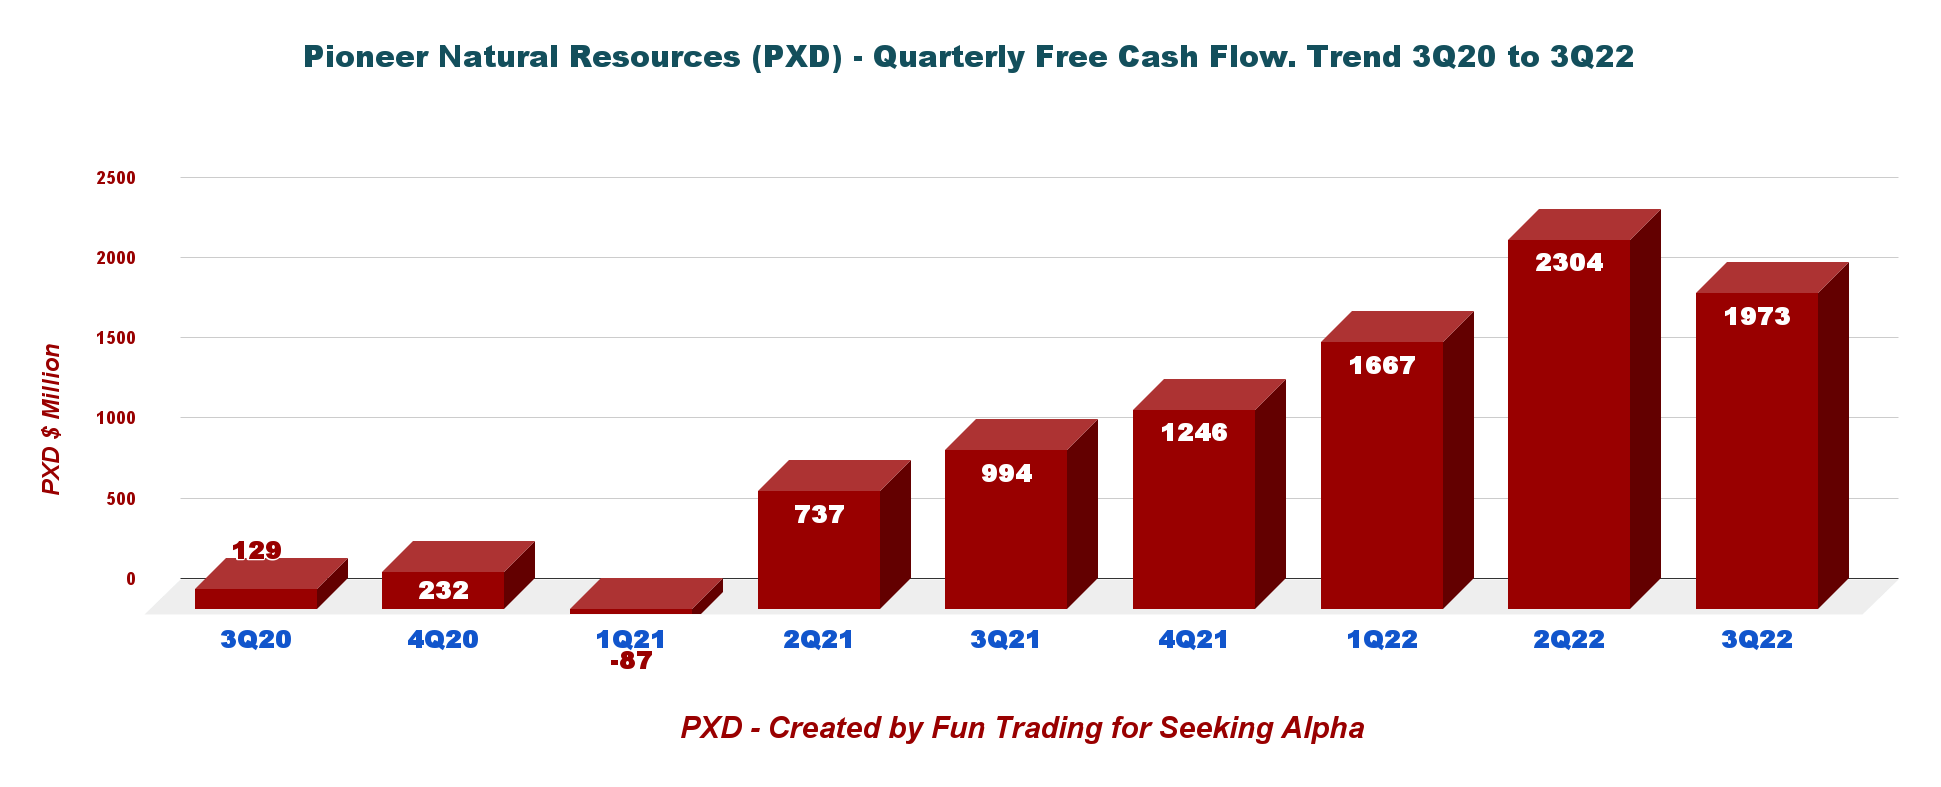
For the fourth quarter of 2022, the Company’s Board of Directors (Board) has declared a quarterly base-plus-variable dividend of $5.71 per share, comprised of a $1.10 base dividend and a $4.61 variable dividend.
It is a significant decline from the 3Q22 dividend of $8.57 per share paid on December 15, 2022. However, the fourth quarter dividend represents a dividend yield of 10.4%.
Also, Pioneer Resources has an ongoing $4 billion share buyback program and bought $500 million worth of shares in 3Q22 with already $1.5 billion executed.
PXD Shares repurchased (PXD Presentation)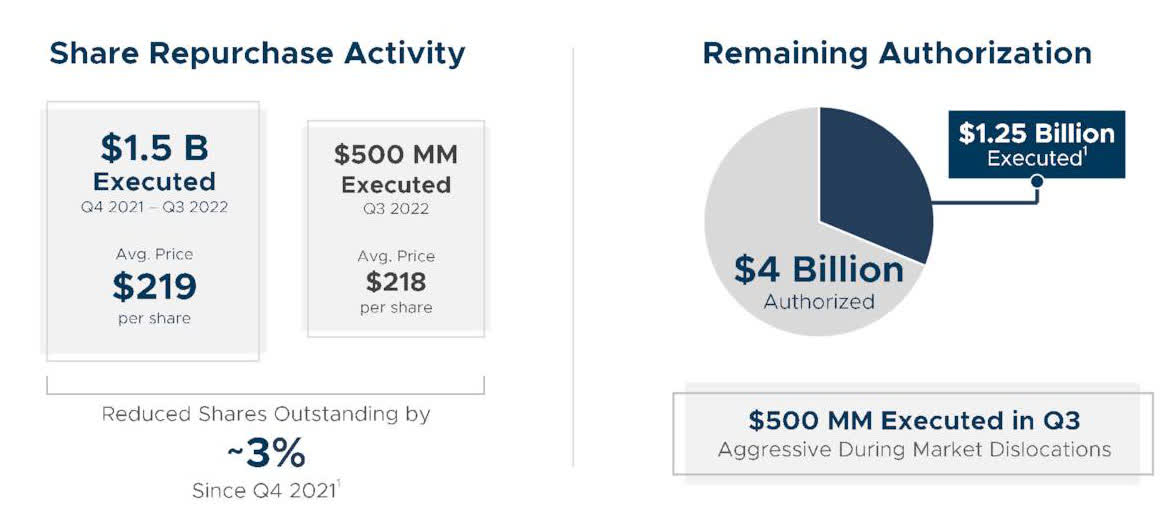
3 – Production was a Total of 656.582k Boep/d in 3Q22
- 3.1 – Quarterly Oil Equivalent Production
PXD Quarterly production oil equivalent history (Fun Trading)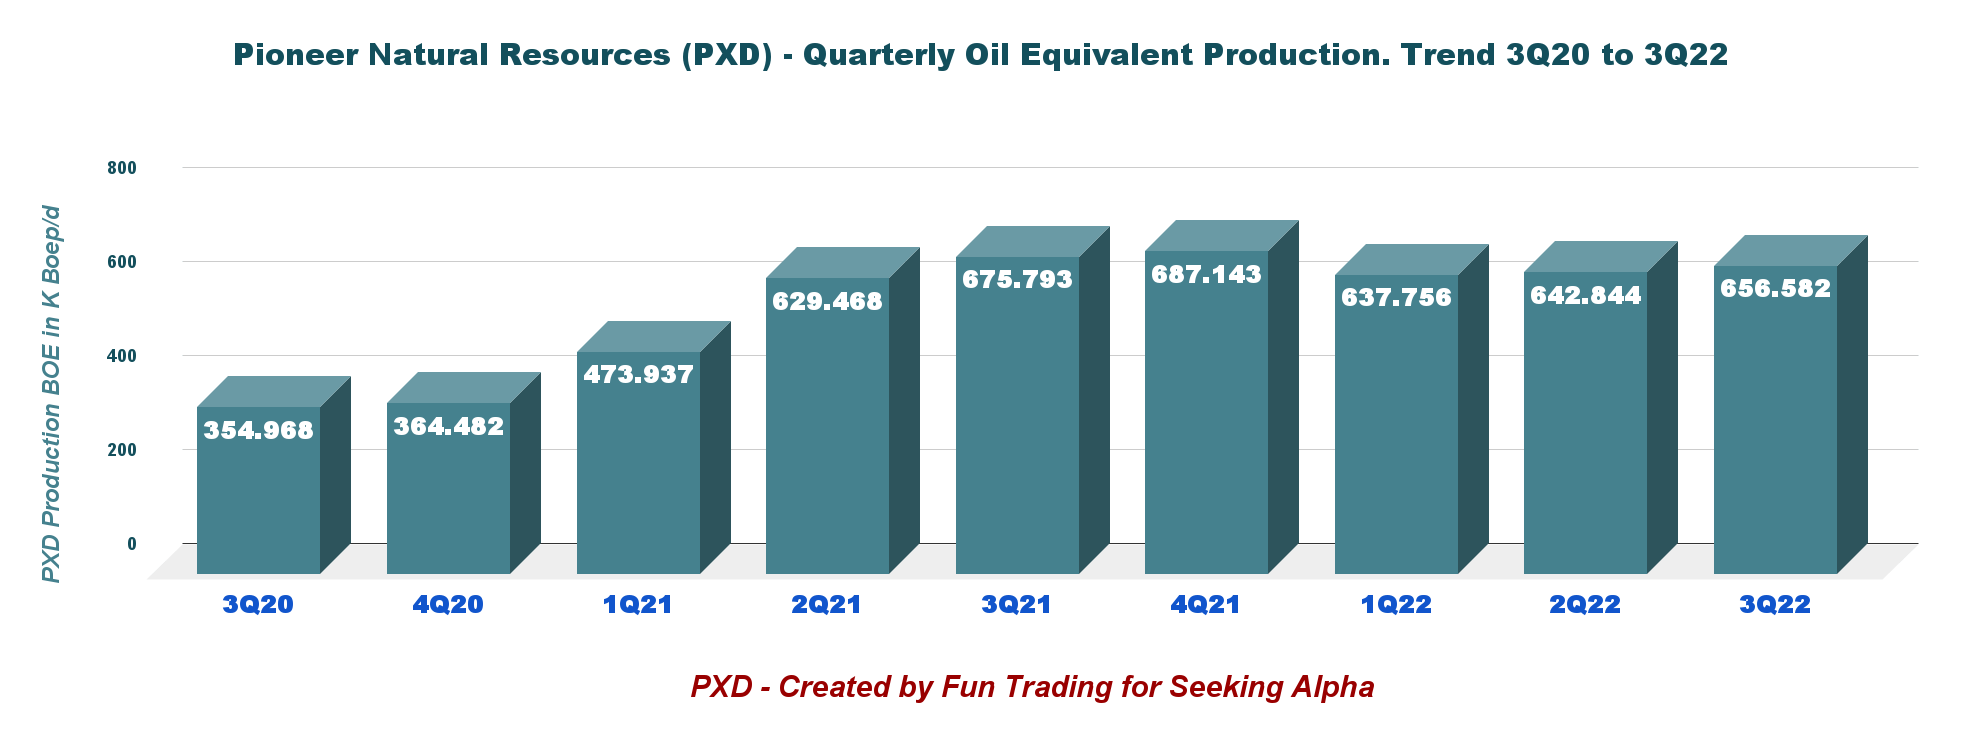
The company produced 656.582K Boep/d in the third quarter, comprising 78.7% of liquids (Oil+NGL). Production comes from the Permian Basin.
Production costs, including taxes, averaged $13.62 per barrel of oil equivalent.
In the press release, CEO Scott Sheffield said:
To further enhance our top-tier free cash flow generation and return of capital, we have increased the return thresholds for wells to be included in our future development programs, which is expected to improve our program well productivity in 2023 and subsequent years, surpassing 2021 productivity levels
- 3.2 – Equivalent production is spread between oil, NGL, and natural gas.
Liquids represent 77.4% of the total input.
PXD Quarterly Production oil, NGL, and NG (Fun Trading)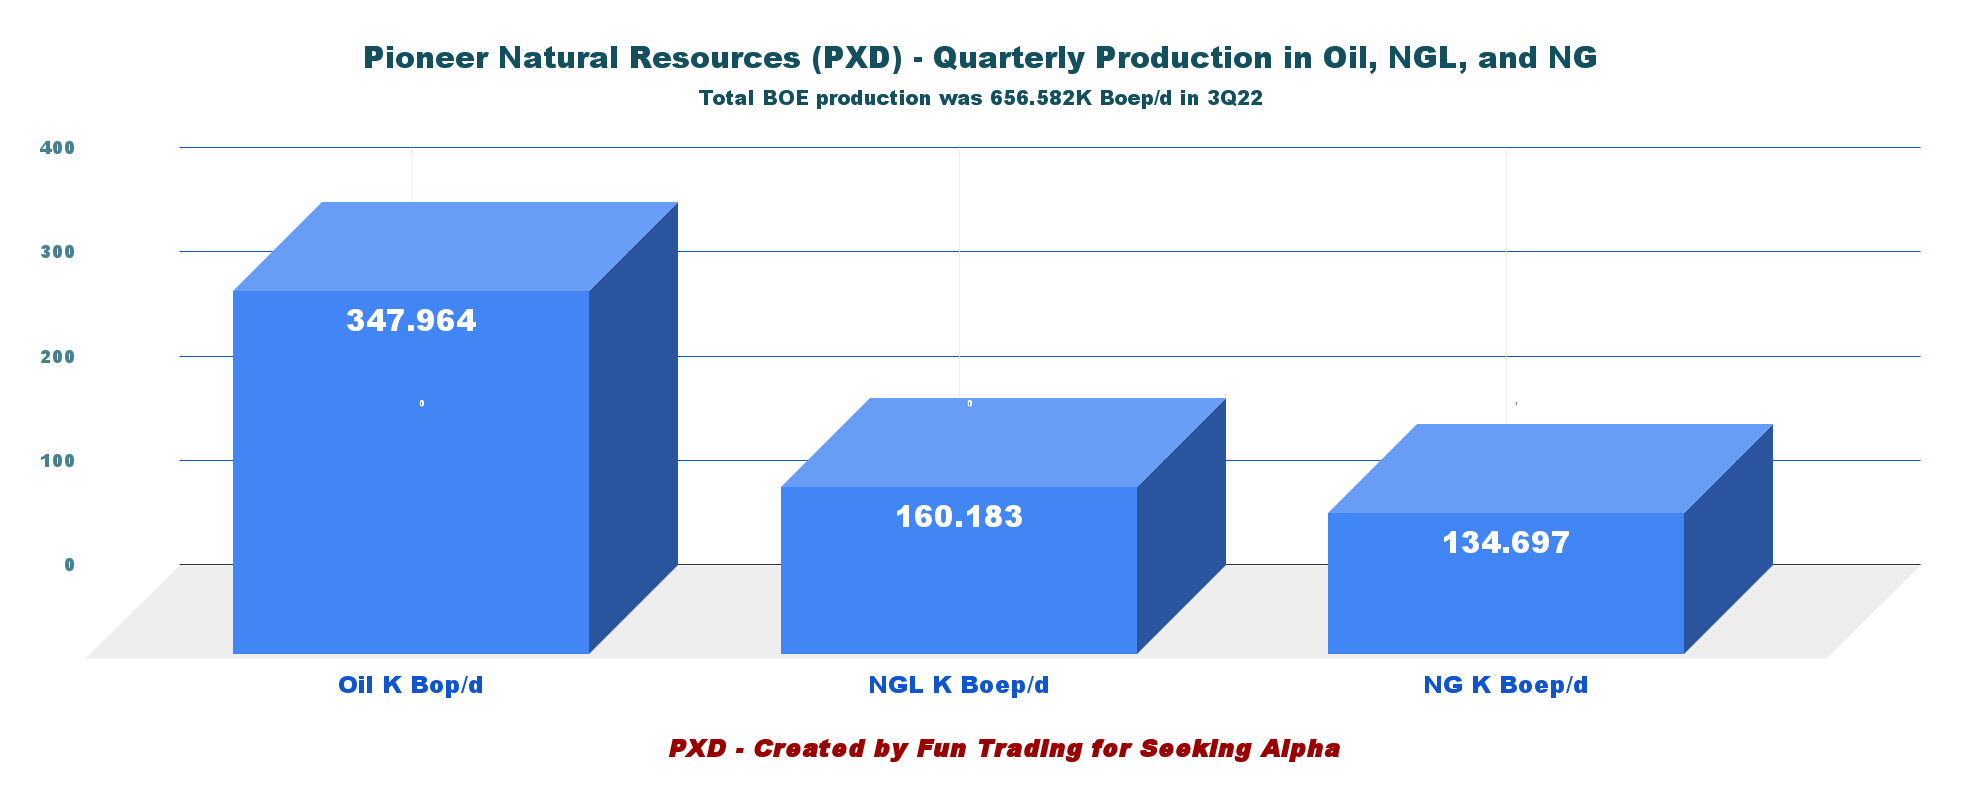
- 3.3 – Realized prices per Boe
PXD Quarterly Price history Liquids and NG. (Fun Trading)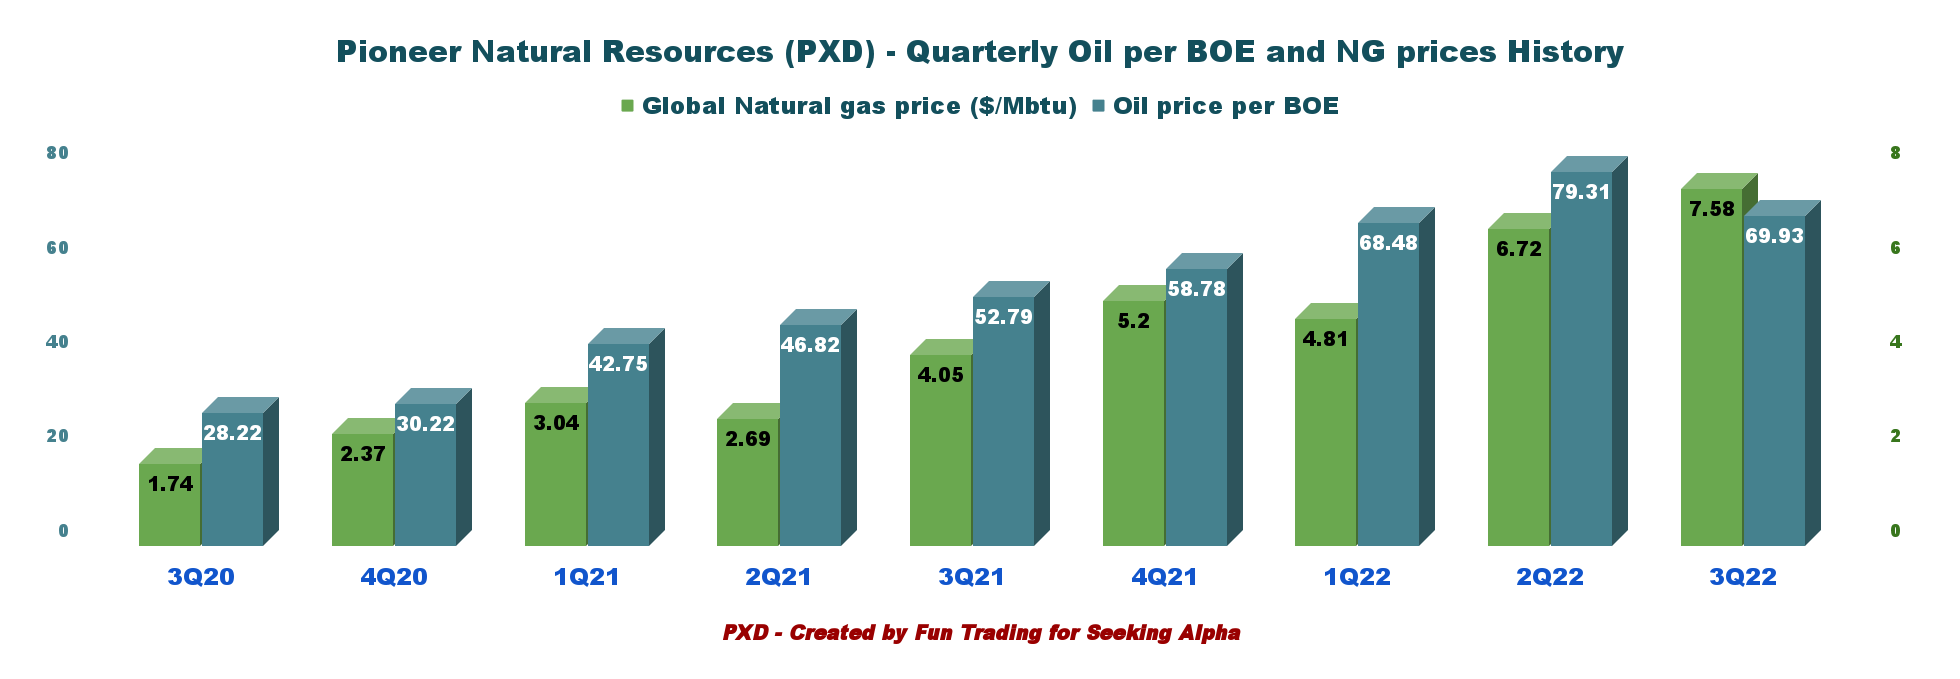
Prices of oil and NG have been strong the past few quarters and have nearly doubled on a year-over-year basis. However, oil prices have dropped significantly since 2Q22 and will be even lower for 4Q22.
- 3.4 – Production Costs per Boe – Inflationary pressures.
PXD Production costs in 3Q22 (PXD Presentation)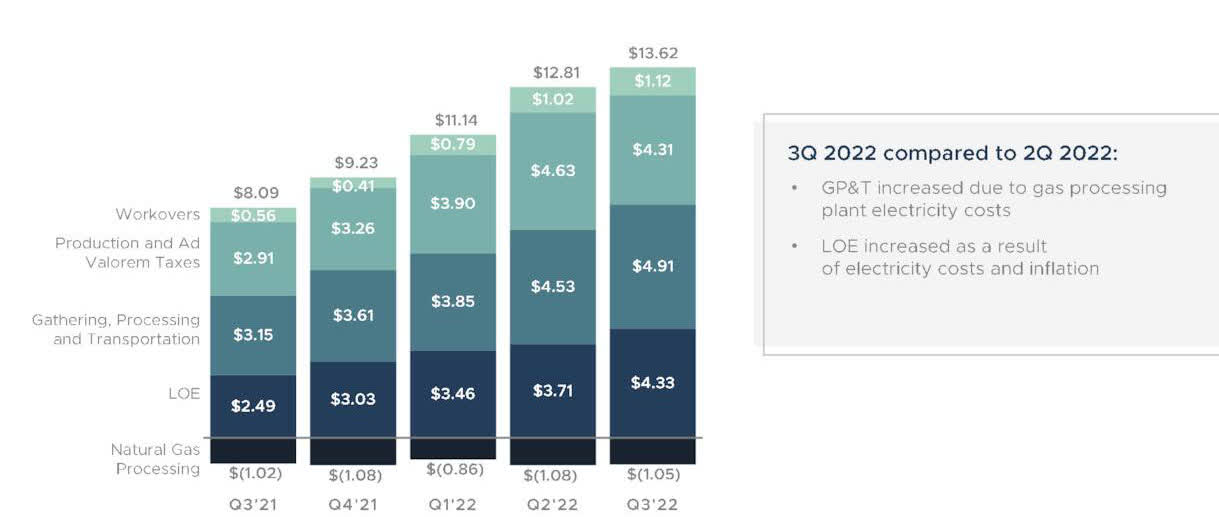
Production costs are expected to average $12.00 per Boe to $13.50 per Boe in the 4Q22. It is slightly lower than what was realized in 3Q22, which is good progress.
4 – Net Debt was $3.4 billion in 3Q22
Pioneer Natural Resources had cash and cash equivalents of $3,252 million as of June 30, 2022, compared with $245 million as of June 30, 2021. A considerable increase year-over-year.
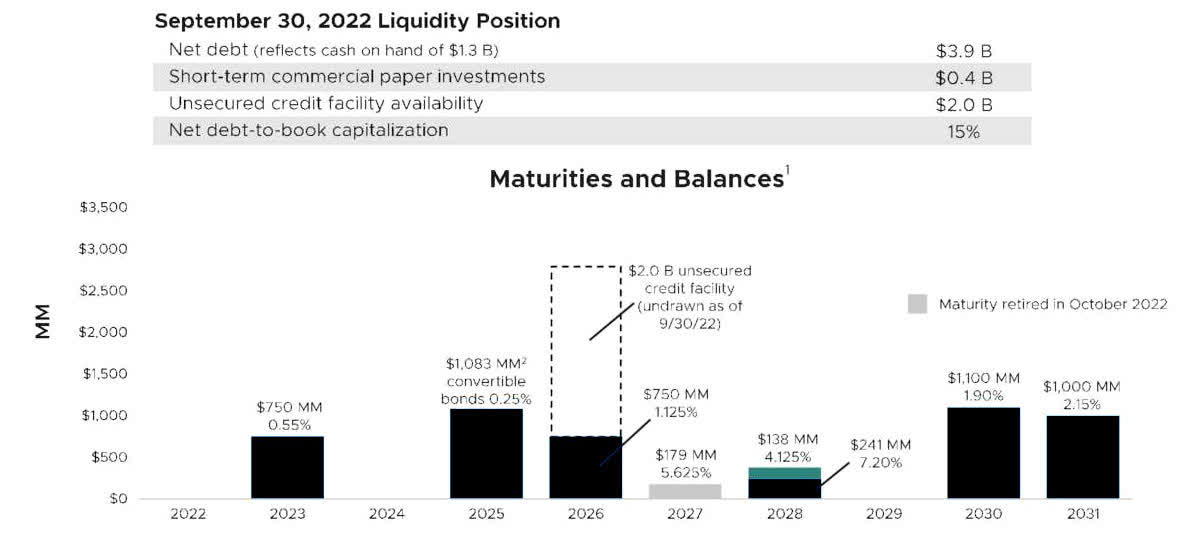
PXD Quarterly Cash versus Debt history (Fun Trading) The total Debt was $5,214 million at the end of September 2022, including current. Net Debt to book capitalization was 15% in 3Q22, which is excellent. Total liquidity is $3.7 billion. Below are shown debt maturities and balances. The difference in Net Debt comes from the cash on hand used by the company, which is only a part of the total cash I use. PXD Balance sheet liquidity Presentation (PXD Presentation)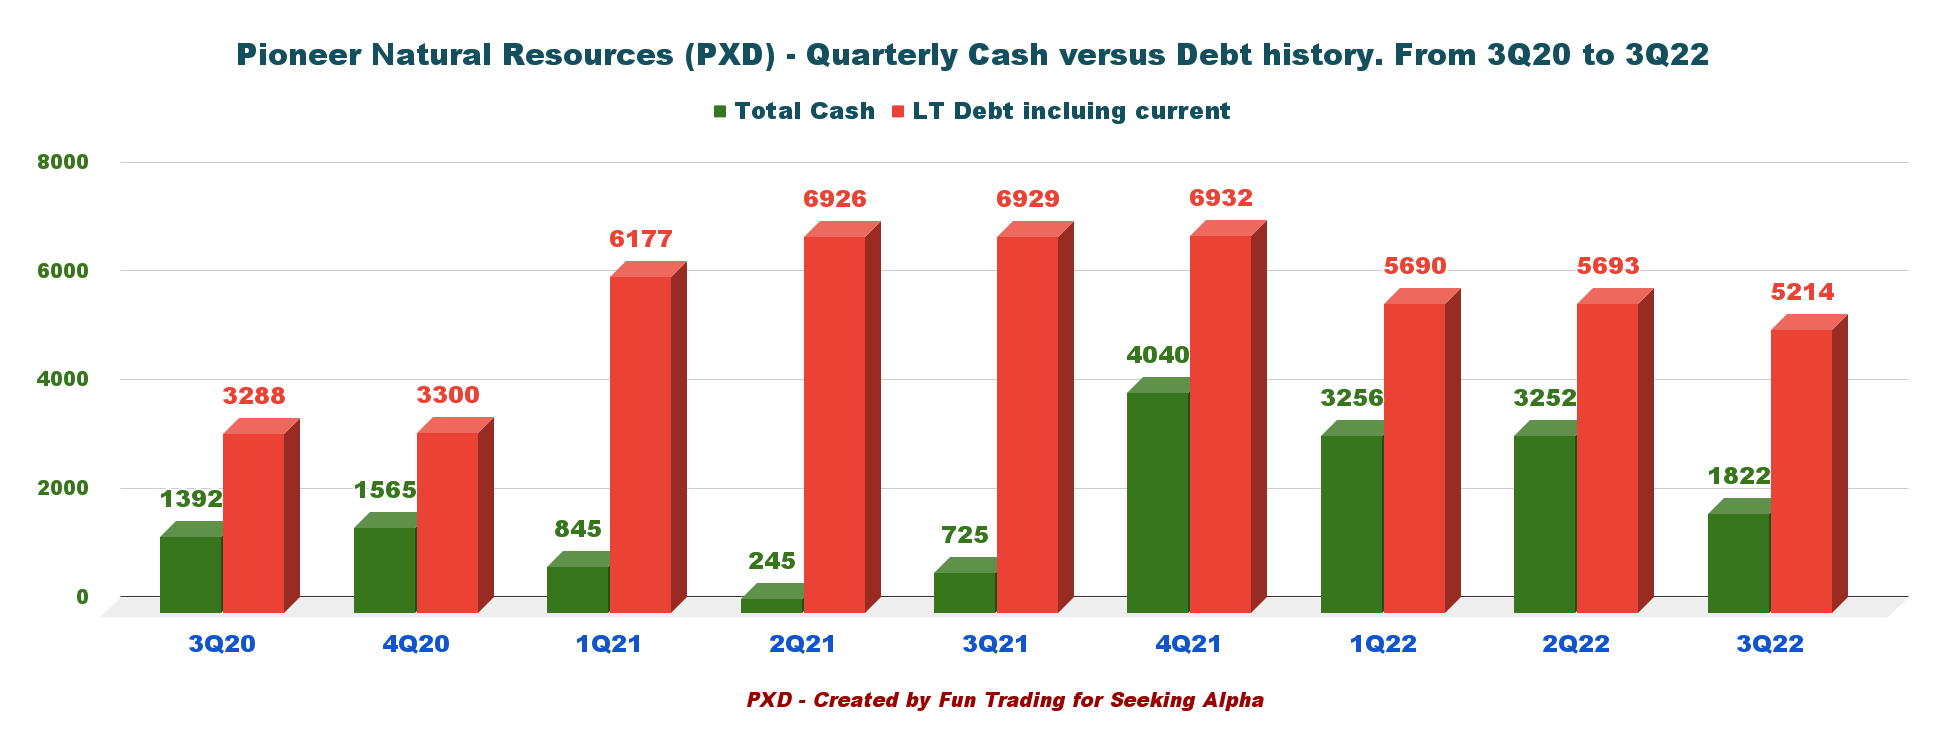
5 – 4Q22 Oil Equivalent Production Guidance is expected at 667.5K Boep/d (mid-point)
PXD 4Q22 guidance (PXD Presentation)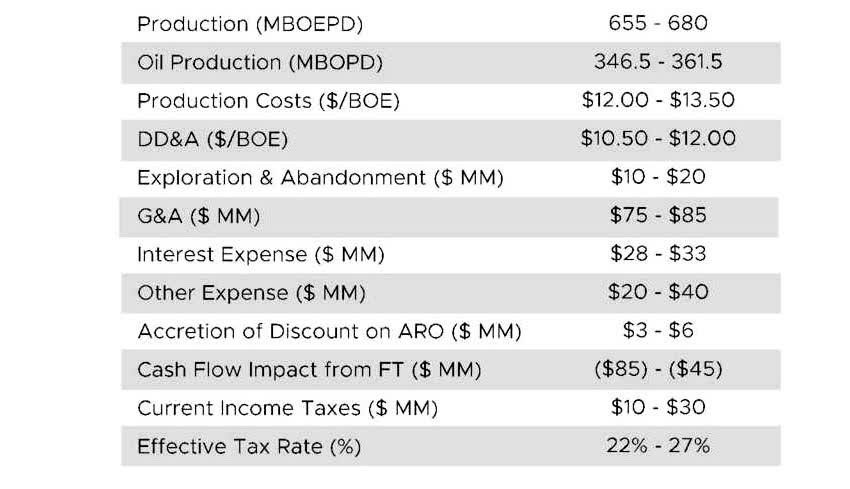
Revenues for the fourth quarter of 2022 will probably go down again between 9% to 12% sequentially due to oil prices that have retreated from their record high in June.
Technical Analysis (Short Term) And Commentary
PXD TA Chart short-term (Fun Trading StockCharts)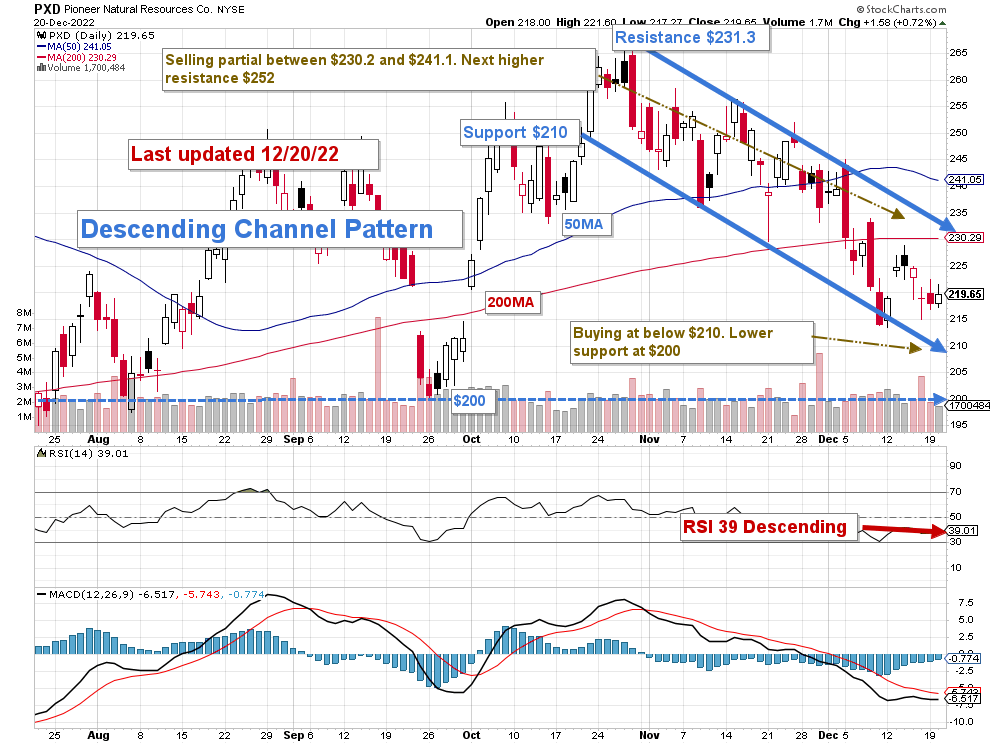
Note: The chart is adjusted for the dividend.
PXD forms a descending channel pattern with resistance at $231.3 and support at $210.
Descending channel patterns are short-term bearish in that a stock moves lower within a descending channel, but they often form within longer-term uptrends as continuation patterns.
I recommend selling PXD between $230.2 and $241.1 with possible higher resistance at $252. Conversely, I think it is safe to accumulate PXD between $215 and $210 with possible lower support at $200, as indicated in the chart above. However, it is crucial to base your expectation on oil and gas prices and adjust depending on the forecast.
I indicate a range with lower support/resistance to help you size your buying/selling lots and avoid buying too much in one transaction. With oil prices down significantly, the stock will experience some headwinds in 2023 and a lower dividend payout as free cash flow goes down.
Thus, trading LIFO is the most suitable solution, in my opinion. It lets you keep a long-term position providing a sizeable dividend and allowing you to trade short-term fluctuations and increase your profit.
We cannot ignore those early signs and must protect our investment by adopting a strategy that takes the “best of both worlds.” It is what I promote in my marketplace, “The Gold and Oil corner.”
Warning: The TA chart must be updated frequently to be relevant. It is what I am doing in my stock tracker. The chart above has a possible validity of about a week. Remember, the TA chart is a tool only to help you adopt the right strategy. It is not a way to foresee the future. No one and nothing can.
Author’s note: If you find value in this article and would like to encourage such continued efforts, please click the “Like” button below to vote of support. Thanks.
Be the first to comment