

Maria Vonotna/iStock via Getty Images
Thesis
The PIMCO Dynamic Income Fund (NYSE:PDI) experienced some turbulent times since 2020 after the pandemic broke out. As you can see from the following chart, the fund had delivered handsome returns to its investors in the past. Its annualized returns (dividends included) have been on average 9.3% CAGR since inception and 4.36% CAGR in the past five years. In stark contrast, its total return in the past three years has been a negative 1.83%, and investors have suffered a sizable loss of 8.9% YTD.
Such a sizable correction has brought the valuation and dividend yield to an attractive level. Currently, the fund is yielding 12.8% and its premium is near a multi-year low. However, my thesis in this article is to caution readers to not be allured by the cheap valuation and high yield on the surface. As you will see next, there are substantial interest rate risks ahead, and the valuation is not that cheap when adjusted for risk-free rates.
www.portfoliovisualizer.com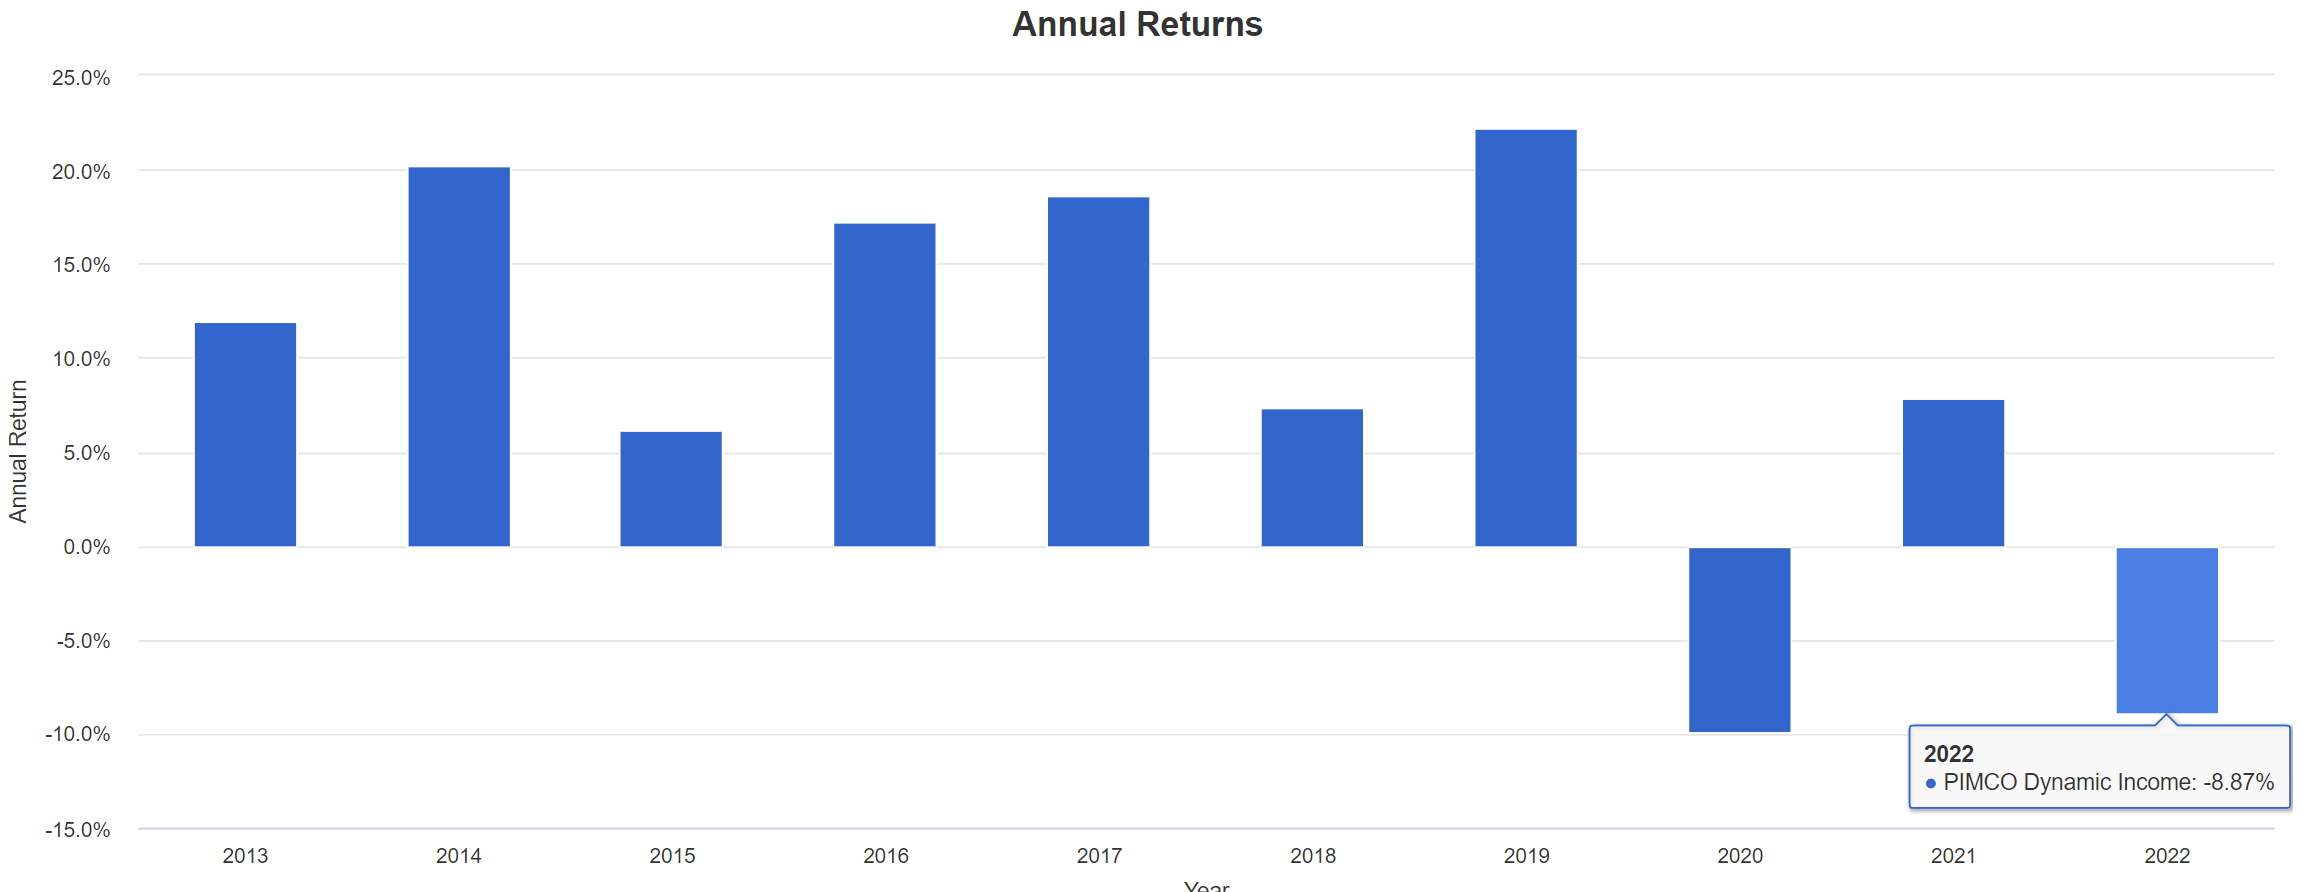
Z-score and dividends are attractive
The price declines in the recent past have brought PDI’s valuation to an attractive level. The fund used to be a flagship fund (maybe still is) in its own space and has always enjoyed a considerable pricing premium. As you can see from the following chart, its average premium has been steadily above 10% in the past until 2020. Its premium has been about 10.2% on average in the past five years and 11% in the past three years. Due to the recent price contractions, its premium is now only 3.46% as of this writing. Such a premium has brought the Z-score to the current value of -0.77 on an annual basis, indeed a quite attractive level.
In terms of dividends, the fund now yields 12.8%. It is not only substantially higher than most of the benchmark rates such as 10-year Treasury rates (about 3.2%), the S&P 500 (about 1.6%), or the BAA yield (about 5.4%). It is also at an attractive level compared to its own historical record. In the past three years, the fund has been yielding an average of 10.6%. And, in the past five years, it has been yielding on average 10.4%. Its current yield of 12.8% is more than 20% above such historical averages.
So, if you are attracted to PDI, these are certainly good reasons. However, my view is that you should not be allured by the cheap premium and high yield. The premium is only cheap in relative terms. The fund is still selling above its NAV. In terms of profit, as you will see immediately next, there are substantial headwinds ahead to pressure its income in the near future.
www.cefconnect.com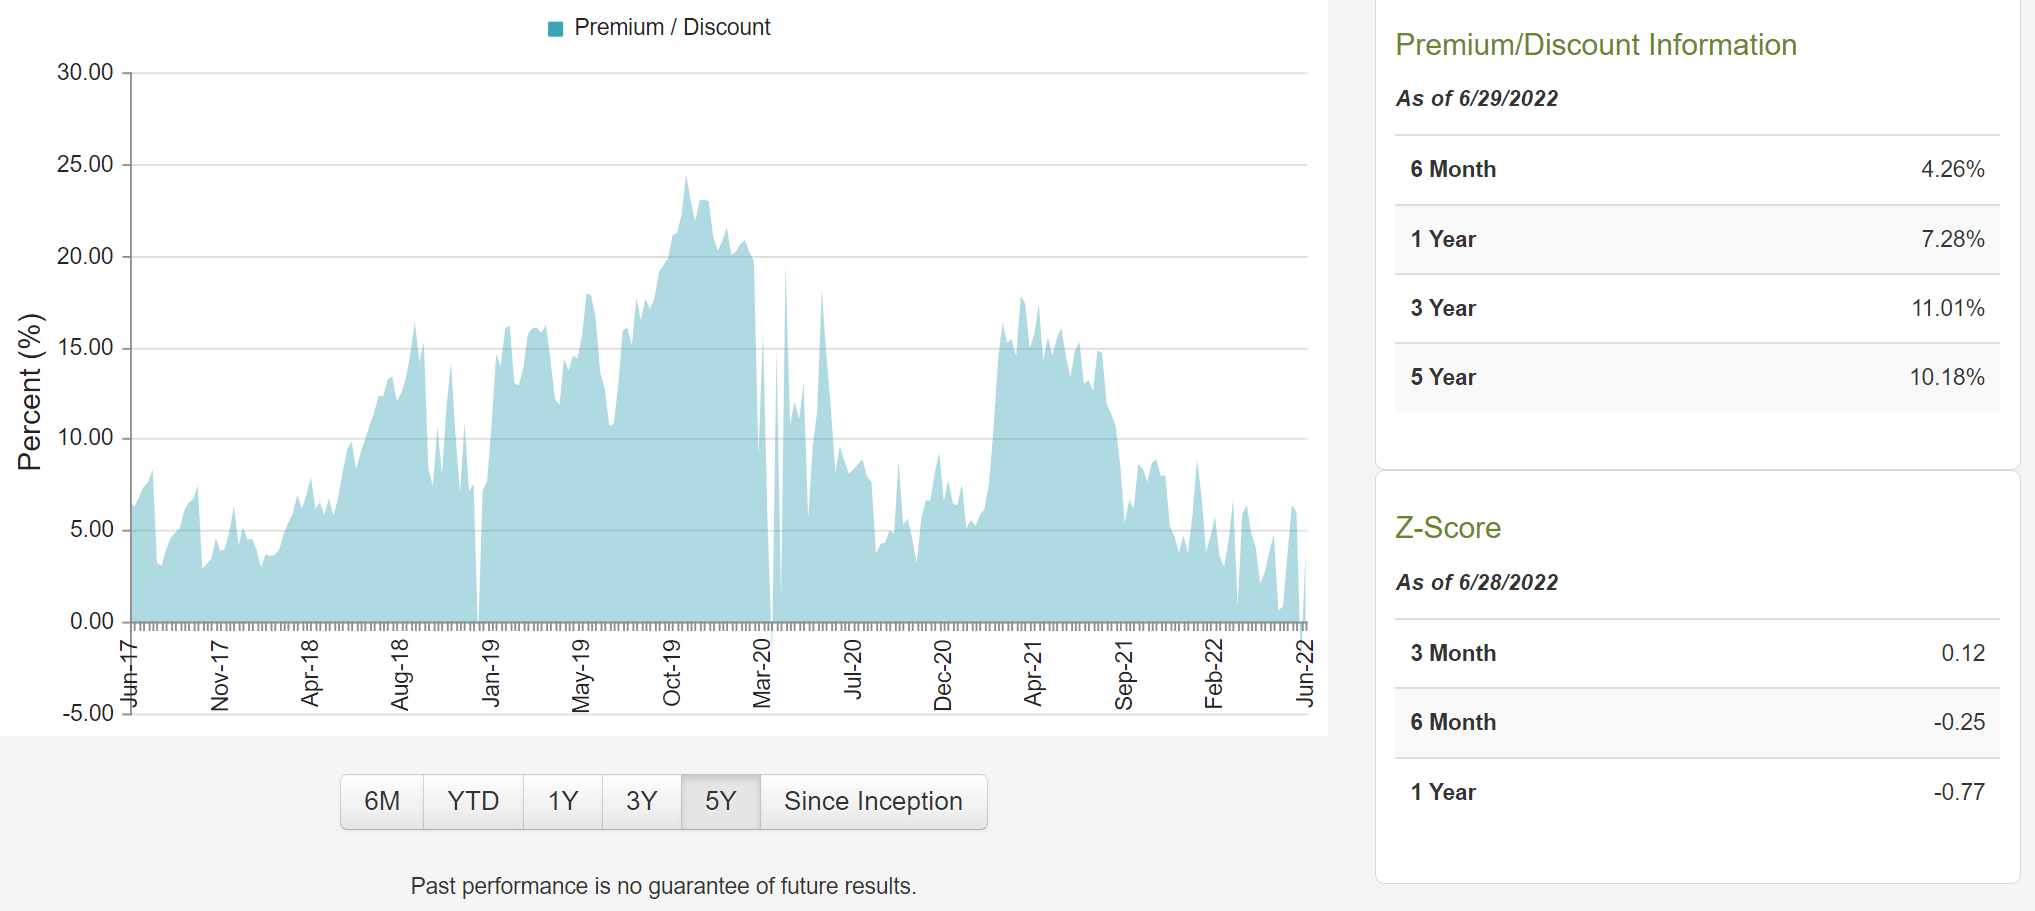
Headwind 1: Yield curve might invert
The fund’s first priority is to seek high current income (and capital appreciation is a secondary priority). Under such a priority, the fund primarily invests in debt obligations as detailed in the following fund description (the emphases were added by me):
The fund normally invests worldwide in a portfolio of debt obligations and other income-producing securities of any type and credit quality, with varying maturities and related derivative instruments. The fund’s investment universe includes mortgage-backed securities, investment grade, and high yield corporates, developed and emerging markets corporate and sovereign bonds, other income-producing securities and related derivative instruments.
The fund will be pressured twice under the current inflationary environment. First, all its exposures are sensitive to interest rates. Take its mortgage exposure as an example. The mortgage sector is its largest exposure, representing about 30.2% of its total assets. Under an inflationary environment, the mortgage sector will be under tremendous pressure as the yield spread narrows or even invert. And the yield curve, defined as the yield spread between 10-year and 2-year treasury rates, has indeed briefly invested in April 2022.
Second, rising interest rates will also pressure the fund’s profit by increasing its borrowing costs. A large reason for its success in the past is attributed to its use of significant leverage and the declining borrowing rates. As of this writing, the fund has a total investment exposure of $8,386M, total common assets of $4,488M, and therefore a total debt of $3,897. Such a debt level translates to a relatively high effective leverage ratio of 46.48% and makes it sensitive to further increases in borrowing rates.
PDI fund description
Headwind 2: Relatively thin yield spread
In terms of dividend yields, PDI’s current yields are not that high when adjusted for risk-free rates. An effective way (and in my mind the only reasonable way) to assess dividend yield is to evaluate valuation against risk-free interest rates. Details of these concepts and approaches were provided in our earlier article:
Dividend yields and yield spread are what we first check before making any investment decisions. We’ve fortunately had very good success with this approach because of:
- Dividends provide a backdoor to quickly estimate the owners’ earnings. Dividends are the most reliable financial information and least open to interpretation.
- The dividend yield spread (“YS”) is based on a timeless intuition. No matter how times change, the risk-free rate serves as the gravity on all asset valuations and consequently, the spread ALWAYS provides a measurement of the risk premium investors are paying relative to risk-free rates.
With this background, you will see below that when adjusted for interest rates, PDI’s current dividends are less attractive than on the surface.
The first chart below shows the yield spread between PDI and the 10-year treasury since 2014. The dividend yield is calculated based on the TTM dividends. As can be seen, the spread is bounded and tractable most of the time. The spread has been in the range between about 7.0% and 12.0% most of the time. Suggesting that when the spread is near or above 12.0%, PDI is significantly undervalued relative to 10-year treasury bonds (i.e., I would sell treasury bonds and buy PDI). And when the yield spread is near or below 7.0%, it means the opposite.
Now the spread is about 9.6%, close to the mid of this historical range. Hence, even though the 12.8% dividend yield is attractive in absolute terms, there is no apparent margin of safety in terms once risk-free rates are adjusted for.
Author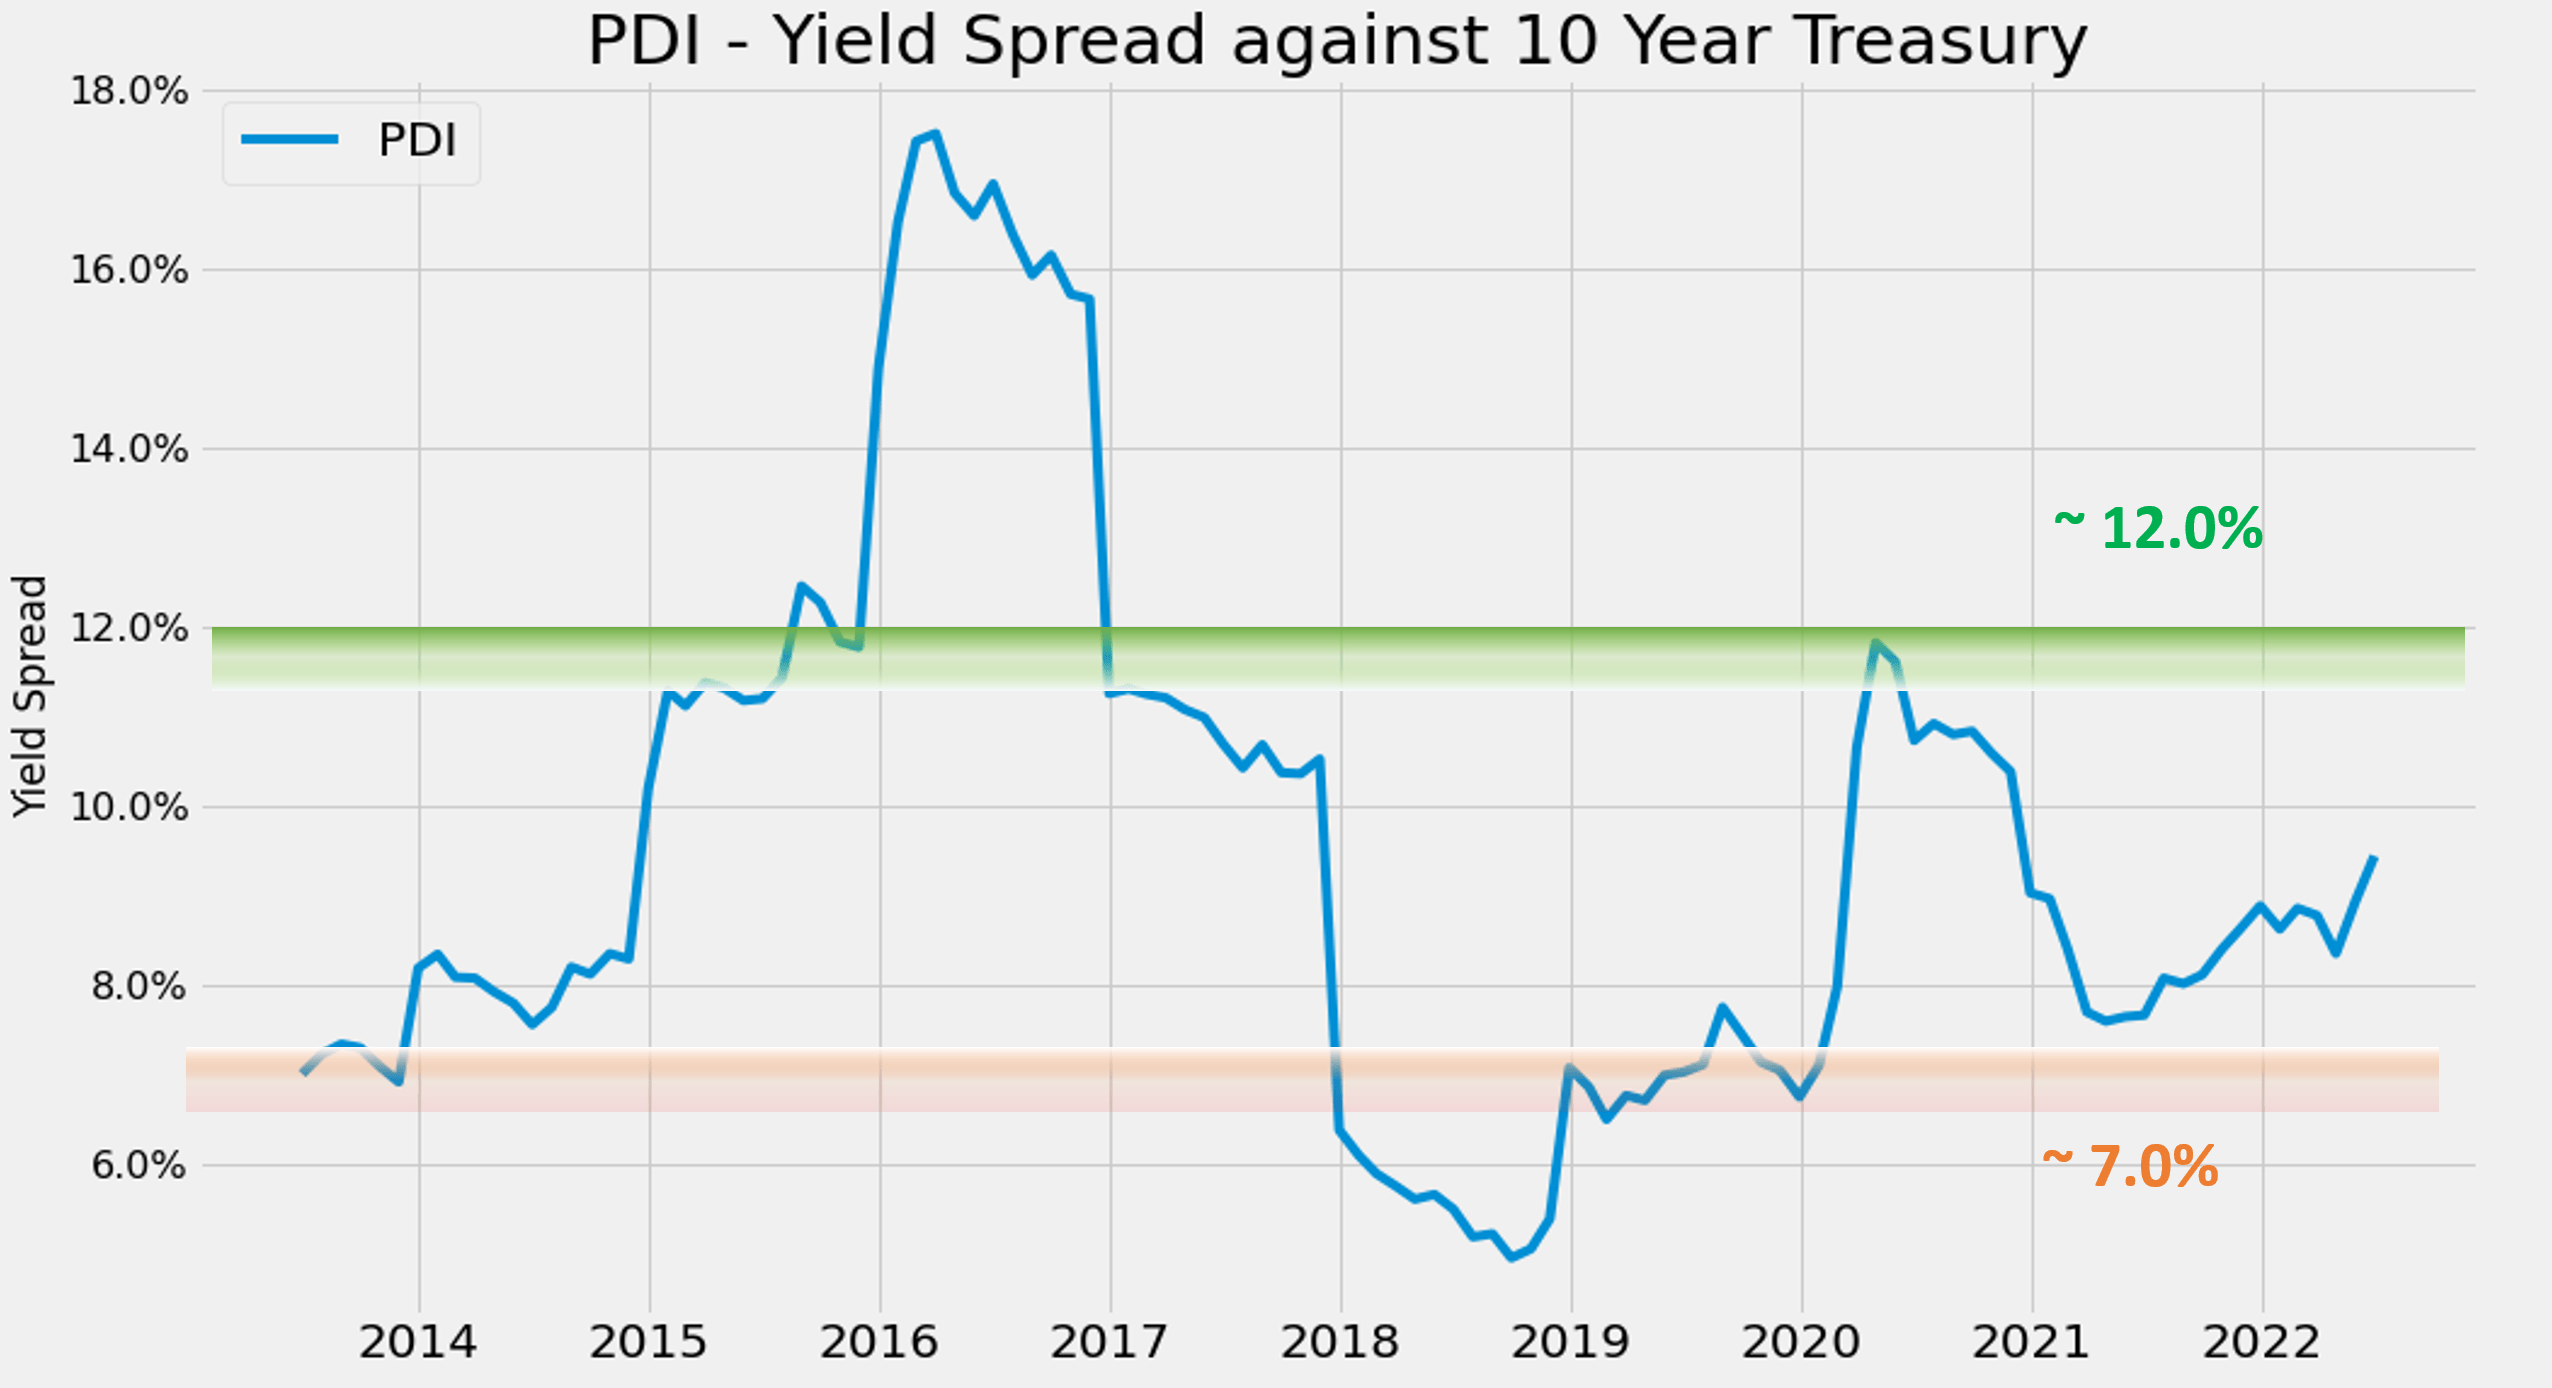
Finally, for readers familiar with our analyses, you know that the short-term returns are closely correlated with the yield spread for funds or stocks that have demonstrated stable earning powers and dividends. It is also true for PDI. The chart below shows the 2-year total return (including price appreciation and dividend) from PDI when the purchase was made under different yield spreads. You can see that there is a clear positive trend, and the Pearson correlation coefficient is 0.85. And again, the current yield spread of 9.6% does not provide a clear buying signal.
Author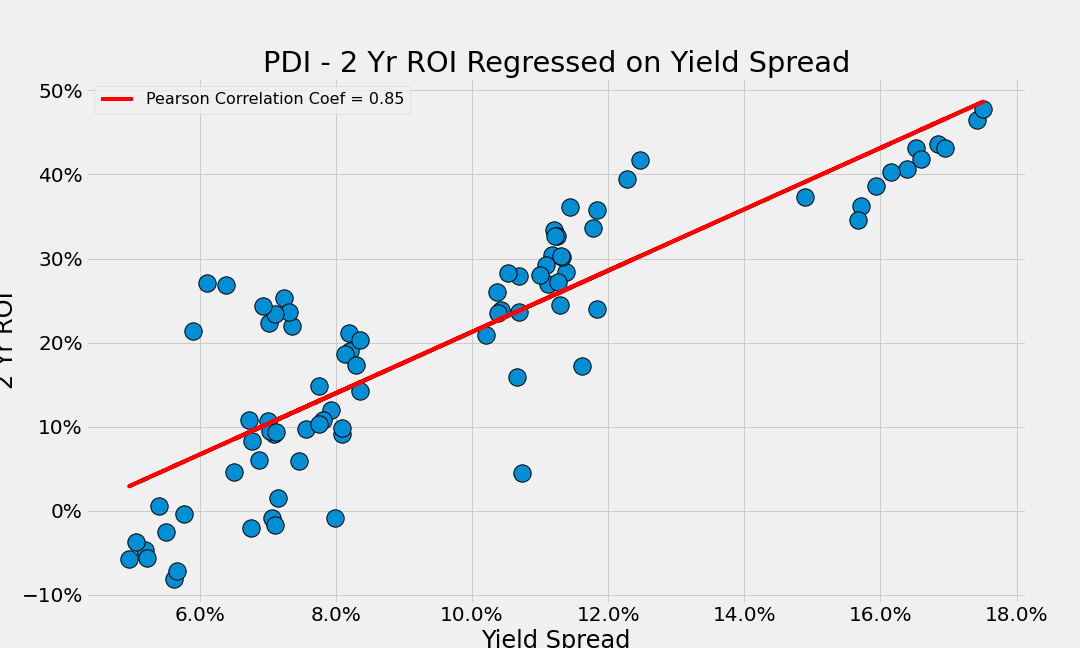
Summary and other risks
There are good reasons for PDI to catch your attention now. Its 12.8% yield is more than 20% above its historical averages in the past 3 or 5 years. Its premium over NAV is near a multi-year low. However, the thesis here is to caution you to not be allured by the cheap valuation and high yield on the surface.
Its profits will be pressured twice under the current inflationary environment. First, all its exposures are sensitive to interest rates. And second, it uses relatively high leverage (with an effective leverage ratio of 46.48%) and rising interest rates cause higher borrowing costs.
Its dividend yield is about 9.6% above risk-free interest rates, close to the mid of this historical range, hence offering no apparent margin of safety.
Finally, note the higher expense ratio from PDI will keep creating a structural headwind going forward. The Management Fee is 1.1% alone, and the total Expense Ratio (excluding interest expense) is a whopping 2.04%. Relative to its long-term annual return of 9.3%, the fees represented almost 12% and 22% of its pretax returns already. When the borrowing costs are included, the total Expense Ratio is 2.78%. And as aforementioned, the borrowing cost can further increase in the future should inflation persists, and interest rates keep climbing.
PDI fund description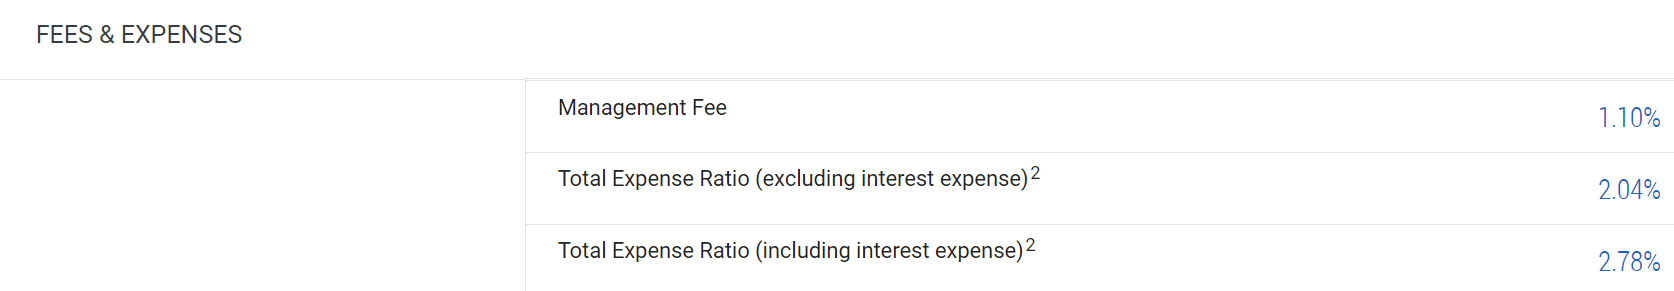
Be the first to comment