

IDFK303/iStock via Getty Images
In the midst of the pandemic, Pennsylvania Real Estate Investment Trust (NYSE:PEI) filed for Chapter 11 bankruptcy in 2020. The company faces $1.47 billion in debt payments this year, which is more than 4 times the company’s $277.6 million projected yearly revenue.
Share price continues to plummet, down (-71.3)% year-to-date, to a mere $0.31 per share as of this writing.
Seeking Alpha Premium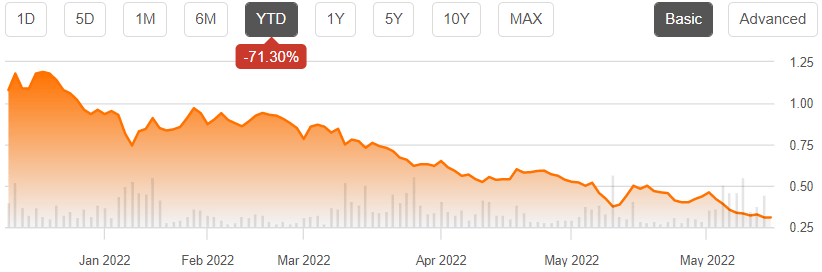
Is there any hope for this company to survive?
Meet the company
Founded in 1960, and among the first REITs ever established, Pennsylvania Real Estate Investment Trust is headquartered in Philadelphia. The company owns 19 regional malls totaling some 16 million square feet, in dense urban areas, and claims an average household income of just $85,000 in the surrounding communities. The national average is $104,000. The properties are located in the eastern half of the U.S., with one outlier in Michigan.
Geographic Distribution of PEI assets (Company investor presentation)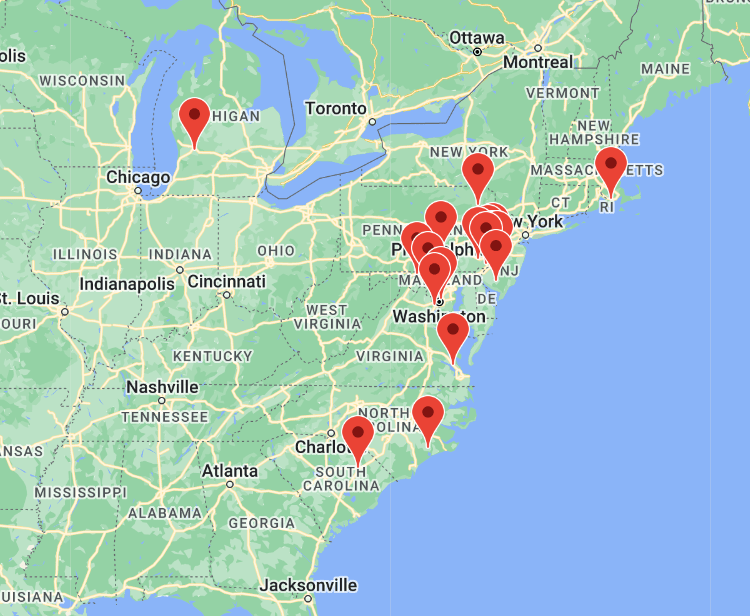
According to the company’s website, Joseph F Coradino was named CEO in 2012, with a mandate to ” [improve] portfolio quality and the balance sheet while enhancing operating performance to position the company for growth.” The company says they are striving to transform “the future of the American mall into mixed-use districts. . . [turning] it into a multi-generational community hub.” The plan does not seem to be working, as we will see below.
Quarterly results look grim
The company’s 10-Q for Q1 2022 reflect these findings:
- Total revenues of $69.4 million, up 6.2% YoY (year over year).
- Total expenses of $105.7 million, resulting in a loss of $39.3 million ($0.49 per share), which is more than half the company’s quarterly revenues.
- Net cash from operations of $8.4 million, down 47.9% YoY.
- $850 million in assets in unconsolidated partnerships, which posted a net operating loss of $394,000 on 84.5% occupancy, versus $951 million in liabilities in those partnerships.
- Quarterly interest expenses of $23.1 million, roughly one-third of revenue.
- Overall occupancy of 92.7%, including 94.3% on consolidated properties, both up about 500 basis points YoY.
- FFO and AFFO per share of (-$0.01) and (-$0.06) per share, a major improvement over the respective (-$0.14) and (-$0.15) a year ago, but still underwater. (The company’s investor presentation touts its 13 cents per share improvement in FFO.)
- Renewal leasing spreads of 3.7%.
Projecting the company’s revenues at 4 times Q1, we arrive at an estimate of $277.6 million.
PEI 10-Q for Q1 2022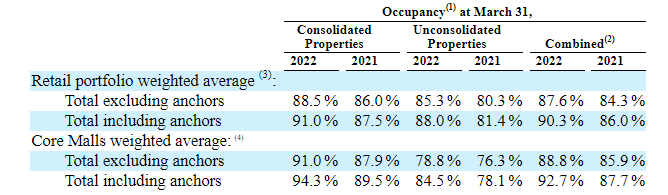
Management reports that 95% of revenue comes from tenant rent and tenant- related activities. PEI’s pipeline of fixed contractual lease payments over the next 5 years totals $663 million, with an additional $248 million thereafter.
PEI 10-Q for Q1 2022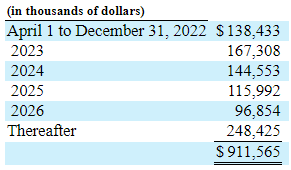
The company announced it has established a $275 million pipeline of much-needed asset sales.
More recent developments
Four Corners Property Trust (FCPT) announced in June 9 it will buy 11 outparcel properties from PEI, for $32.5 million. Meanwhile, FTSE Russell has deleted PEI from the Russell Microcap Index.
Growth metrics
Here are the 3-year growth figures for FFO (funds from operations), TCFO (total cash from operations), and market cap.
| Metric | 2018 | 2019 | 2020 | 2021 | 3-year CAGR |
| FFO (millions) | $111.5 | $104.6 | $(-1.7) | $4.4 | — |
| FFO Growth % | — | (-6.2)% | (-100.0)% | NA | (-66.0) |
| FFO per share | $1.54 | $1.04 | (-$0.01) | (-$0.04) | — |
| FFO per share growth % | — | (-32.5)% | (-100.0)% | NA | (-100.0) |
| TCFO (millions) | $134.9 | $111.4 | $5.9 | $69.0 | — |
| TCFO Growth % | — | (-17.4)% | (-94.7)% | 1069.5 | (-20.0) |
| Market Cap (billions) | $0.41 | $0.41 | $0.07 | $0.08 | — |
| Market Cap Growth % | — | 0.0 | (-83.0) | 14.3% | (-42.0)% |
Source: Hoya Capital Income Builder, TD Ameritrade, CompaniesMarketCap.com, and author calculations
As you can see, PEI was already struggling with falling FFO and cash flow when the pandemic hit, and the company has not recovered, even though 2021 did see a sharp uptick in cash from operations.
Thanks to the 73% sell-off in share prices in 2022, market cap has fallen to a microscopic $0.02 billion, so even the (-42.0)% 3-year average decline in market cap shown in the table above overestimates the company’s performance.
Meanwhile, here is how the stock price has done over the past 3 twelve-month periods.
| Metric | 2019 | 2020 | 2021 | 2022 | 3-yr CAGR |
| PEI share price June 10 | $6.69 | $1.86 | $2.97 | $0.31 | — |
| PEI share price Gain % | — | (-72.2) | 113.4 | (-89.6) | (-64.1) |
| VNQ share price June 10 | $88.73 | $83.18 | $105.50 | $92.62 | — |
| VNQ share price Gain % | — | (-6.3) | 26.8 | (-12.2) | 4.4 |
Source: MarketWatch.com and author calculations
In price gain alone, the market-cap weighted Vanguard Real Estate ETF (VNQ) has gained an average of 4.4% over the past 3 years, while PEI has lost an unfortunate (-64.1)%.
Balance sheet metrics
This is the worst balance sheet I have ever seen, in a company I have reviewed on Seeking Alpha. Even in the Mall REIT sector, which is characterized by battered balance sheets, PEI’s stands out from the crowd. Its debts virtually match its assets, and run 14 times EBITDA.
| Company | Liquidity Ratio | Debt Ratio | Debt/EBITDA | Bond Rating |
| PEI | 1.00 | 81% | 14.1 | — |
Source: Hoya Capital Income Builder, TD Ameritrade, and author calculations
The company was holding $61.1 million in cash, restricted cash, and cash equivalents as of March 31, against $2.06 billion in debt. Debt maturities are a staggering $1.47 billion in 2022, and interest rates are high. Weighted average variable interest rate is 7.44%, and fixed rate a still-high 3.96%. Maturities drop off sharply in 2023, as currently structured.
PEI 10-Q for Q1 2022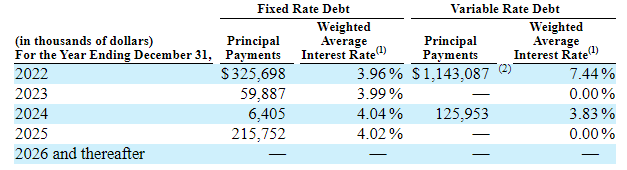
The company reports total liquidity of $110.5 million for Q1 2022.
Dividend metrics
In a sector noted for its fat dividend Yields, PEI pays no dividend at all, has not paid a dividend in two years, and prospects for the resumption of a dividend in the foreseeable future appear poor.
| Company | Div. Yield | Div. Growth | Div. Score | Payout Ratio | Div. Safety |
| PEI | 0.00% | -100% | 0.00 | NA | NA |
Source: Hoya Capital Income Builder, TD Ameritrade, Seeking Alpha Premium
Dividend Score projects the Yield three years from now, on shares bought today, assuming the Dividend Growth rate remains unchanged.
Valuation metrics
Even at a miserable $0.31 per share, PEI is expensive, judged by its Price/FFO ratio of 40.0. If you consider low-priced, high yielding REITs a bargain, you should be loading up on Mall REITs right now. But not PEI.
| Company | Div. Score | Price/FFO |
| PEI | 0.00 | 40.0 |
Source: Hoya Capital Income Builder, TD Ameritrade, and author calculations
What could go right?
The company could . . .
- radically refinance its debt, and
- greatly step up the pace at which it is selling its assets.
Both of these seem necessary, if this company is to survive. Given the level of risk to the lender, and the rising interest rate environment, whether they can find a lender willing to take on the risk at an interest rate lower than what they are currently paying remains to be seen. Not sure what their options are at this point. Your thought on this would be welcome in the Comments section.
Investor’s bottom line
The company’s website says, “Since 2012, the company has driven a transformation guided by an emphasis on balance sheet strength, high-quality merchandising and disciplined capital expenditures.” Doesn’t look that way to me.
Seeking Alpha Premium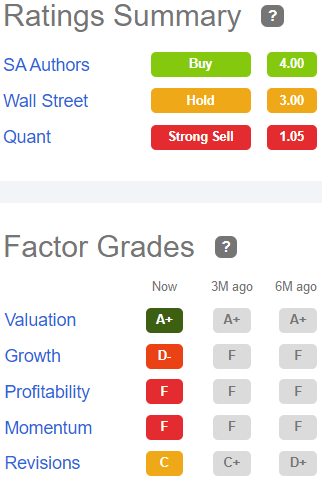
It’s hard to come up with a good reason to buy shares of this company. The $275-300 million pipeline of asset sales seems woefully inadequate to address the huge amount of near-term, high-interest debt payments the company is facing. A radical restructuring of their debt in the very near future seems mandatory. Hard to see how they stay in business otherwise.
Any investment in shares would be purely speculative. In case you are considering a speculative Buy, just note that those who tried this two months ago have lost about 50%. On the other hand, if you have been holding shares in PEI for more than a few months, your position is down so far that selling may not be worthwhile either.
One of my tech stocks is down about 90%, and the little bit of cash I could raise by selling it seems unimportant. Seems like a better idea to just hold, in hopes it can rally. But then, that company’s assets more than double its liabilities, and it has enough cash to retire about two-thirds of its debt. The same cannot be said about PEI. Probably best to sell your shares, use the proceeds to buy yourself a proverbial beer, and chalk it up as a lesson learned.
Be the first to comment