


Zhanna Danilova/iStock via Getty Images
Written by Nick Ackerman, co-produced by Stanford Chemist. This article was originally published to members of the CET/ETF Income Laboratory on Oct. 10, 2022.
2022 hasn’t been kind to too many investments. Even PIMCO Dynamic Income Opportunities Fund (NYSE:PDO) and XAI Octagon Floating Rate & Alternative Income Term Trust (NYSE:XFLT) are getting slammed this year. Despite this, I find both of these investments worthwhile, and I think there’s an opportunity to add these names to one’s portfolio. Though, these aren’t without risks that need to be weighed.
The main two risks against both of these names are the interest rate risks and the credit risks. Interest rates are being increased aggressively by the Fed. That means PDO’s underlying portfolio of bonds is taking some big hits on their prices.
According to CEFConnect, the average bond price in PDO’s portfolio is down to $84.66. That being said, they aren’t totally susceptible to higher interest rates. They have taken some actions to hedge against them with various derivatives. With XFLT, this is less of an impact due to the floating rate nature of the portfolio.
However, both are still impacted meaningfully by credit risks. Both of the funds invest in portfolios that are heavily invested in below investment-grade offerings. Those are the sorts of companies that falter first and are more likely to falter when the economy starts to go poorly. So there’s certainly risk here.
On top of these, both of these closed-end funds run elevated levels of leverage. That means that any downside is further exacerbated by the leverage applied to increase their investment exposure.
If we enter into a deep recession, the main risks outlined here are only set to worsen things for the funds. That being said, historically, the default rates have been low for bonds and loans. Naturally, the default rates ramped up during times of economic stress, such as the GFC, the 2016 debt crisis and 2020 COVID.
Those that do default or go bankrupt don’t mean a complete loss as a portion is recovered. Loan defaults and recovery rates have been more favorable as they’re higher in the capital stack.
The idea also is now that some of this should be priced in and reflected. Both of these funds are trading at attractive discounts and offer enticing distribution yields for investors. Both pay monthly distributions too.
PIMCO Dynamic Income Opportunities Fund
- 1-Year Z-score: -0.84
- Discount: 7.63%
- Distribution Yield: 11.42%
- Expense Ratio: 2.12%
- Leverage: 47.82%
- Managed Assets: $3.286 billion
- Structure: Term (anticipated term date Jan. 27, 2033)
PDO is designed to provide “current income as a primary objective and capital appreciation as a secondary objective.” This is pretty standard for the PIMCO funds and most CEFs. They go on to mention how they will attempt to achieve this;
The fund will normally invest at least 25% of its total assets in mortgage-related assets issued by government agencies or other governmental entities or by private originators or issuers. The fund may invest up to 30% of its total assets in securities and instruments that are economically tied to “emerging market” countries; however, the fund may invest without limitation in short-term investment grade sovereign debt issued by emerging market issuers. The fund may normally invest up to 40% of its total assets in bank loans (including, among others, senior loans, delayed funding loans, covenant-lite obligations, revolving credit facilities and loan participations and assignments). It is expected that the fund normally will have a short to intermediate average portfolio duration (i.e., within a zero to eight year range), although it may be shorter or longer at any time depending on market conditions and other factors.
Including the leverage expenses, the fund’s total expense ratio comes to a fairly lofty 2.79%. That being said, that’s about where the whole PIMCO suite comes in, with higher expenses. They’ve traditionally outperformed despite this, too, historically.
One area that’s usually the case for PIMCO is high premiums on their funds. These have now come down across the board. Even more so for PDO, as they’re a newer fund. It seems to be getting a newer fund discount relative to its sister funds.
At one point earlier in July this year, the fund touched a premium once again. Even when the fund first launched for the first several months, it enjoyed a premium. The discount is a function of the share price dropping faster and further than the NAV itself.
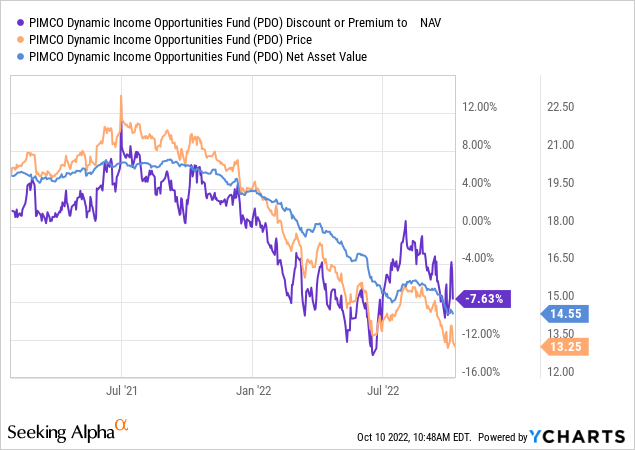
Ycharts
The discount for PDO might be more unusual because it’s a term fund. Only the new funds launched from PIMCO after around 2018 are structured this way. Term funds are now the standard. PIMCO Access Income Fund (PAXS), which launched more recently, also is an example of a PIMCO term fund, which is another interesting name at this time, appropriate for its own article.
The last time we touched on PDO, we noted that the strong distribution coverage led to a distribution boost. With continued strength in their coverage, we could see further boosts or a year-end special. Over the last rolling six months, PDO had the highest coverage ratio of all PIMCO funds.
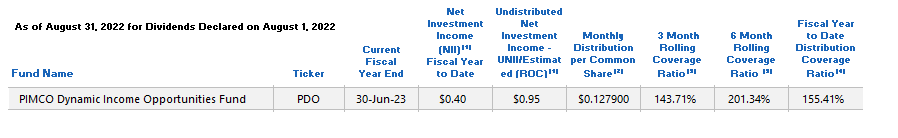
PDO August UNII Report (PIMCO)
The total leveraged-adjusted effective duration comes to 2.88 years. That would indicate that any 1% increase in interest rates would result in a decline of 2.88% for PDO. As we can see, the fund has experienced sharper losses than that YTD. That’s where the credit risk and the price of the underlying bonds come into play. That would see a further decline in the NAV.
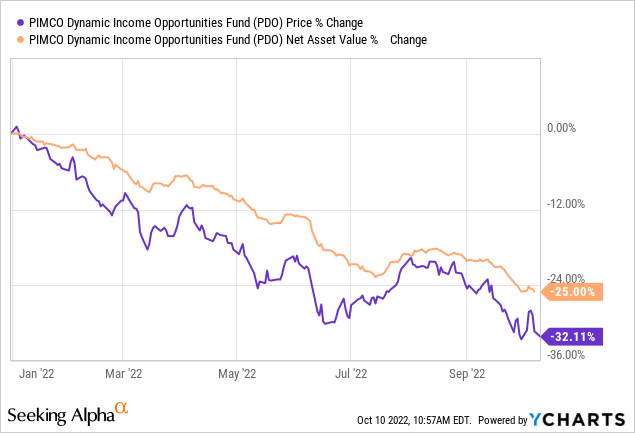
Ycharts
Despite the portfolio leaning to more speculative junk-rated debt, PIMCO has shown historically they’ve been able to navigate successfully in this area of the market. Therefore, the bonds, while being discounted at this time, still have a good chance of receiving par back at maturity.
Their diversification across the board as a multi-sector bond fund could help see them navigate through difficult periods too.
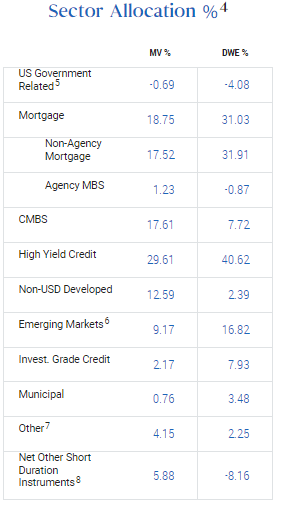
PDO Allocations (PIMCO)
XAI Octagon Floating Rate and Alternative Income Term Trust
- 1-Year Z-score: -2.35
- Discount: -3.11%
- Distribution Yield: 14.04%
- Expense Ratio: 3.72%
- Leverage: 41.63%
- Managed Assets: $391.63 million
- Structure: Term (anticipated liquidation date Dec. 31, 2029)
XFLT’s objective is to “seek attractive total return with an emphasis on income generation across multiple stages of the credit cycle.”
They will do this through “a dynamically managed portfolio of floating-rate credit instruments and other structured credit investments within the private markets. Under normal market conditions, the Trust will invest at least 80% of managed assets in senior secured loans, CLO debt and equity.”
The expense ratio here might look incredibly high, which would be a fair criticism. It’s even higher than PDO’s expense ratio. However, compared to the other CLO-related funds, this is lower. One of the reasons is that they don’t have incentive fees, which would help provide better performance over the long run for investors.
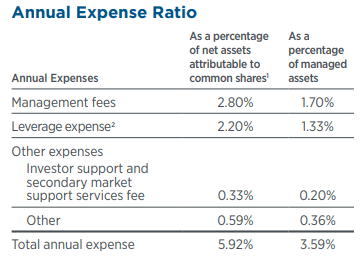
XFLT Expenses (XA Investments)
As an example, Oxford Lane Capital (OXLC) last reported an expense ratio of 10.76% to finish off fiscal 2022. That was a decline from fiscal 2021, where the expense ratio topped 12.14%. Fiscal 2016 showed an even more eye-popping 16.60% expense ratio.
So again, XFLT expenses might seem high, but it’s the nature of their underlying investments. Those are the collateralized loan obligations or CLO. They are split up in investing in both debt and equity sleeves of the CLO tranches. However, the largest exposure is to senior secured first-lien loans or floating-rate loans.
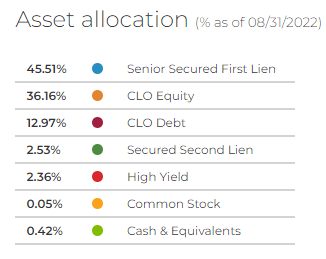
XFLT Allocation (XA Investments)
They do this through 455 holdings that can provide them with diversification across various industries. The average bond price as a percentage of par for XFLT comes to 85.96%. This is noteworthy because, despite the floating rate nature of XFLT’s holdings, they don’t seem to be getting credit for the natural protection they provide during rising rates.
The benefits of rising rates have been reflected in the net investment income, though. That resulted in an increase when they last provided a quarterly update. The ~$18 million they generated in the nine months ended June 30, 2022, compares favorably from the prior fiscal year.
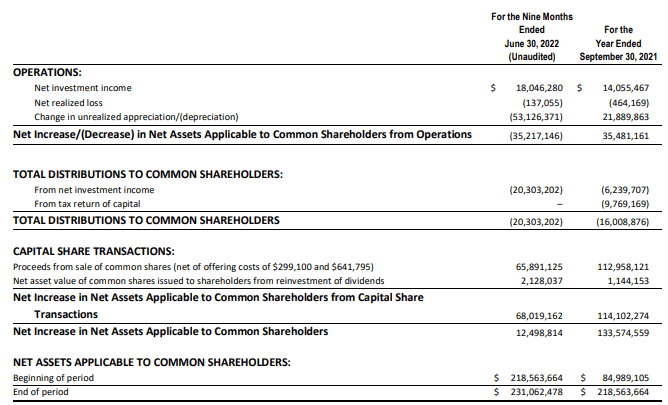
XFLT Nine-Month Report (XA Investments)
In this case, increased income can come from the additional capital they’ve invested through the proceeds of the sale of common shares and the DRIP. Additional outstanding shares mean more income generation but also more distributions to pay. NII coverage in the latest period was 88.8% from 87.8%.
Not a massive increase, but interest rate increases weren’t fully reflected by June 2022 either. Senior loans have a floor to breach first, which was likely only hit after the first couple of raises in most of these investments. With subsequent increases, the income generation should start rolling in.
Another way to look at this to reflect the dilution of added shares would be looking at NII per share in the financial highlights. In that case, we see an NII of $0.58 for the nine months compared to the prior fiscal year 2021 of $0.76. If we annualized out that latest figure, we would come out to $0.7733. Again, reflecting that the income generation wasn’t overly accretive at this point, but it should start ramping up in subsequent reports.
I believe that’s why the current discount in the fund presents an interesting opportunity. They’re shy on NII distribution coverage, but there’s a path to get it covered, in my opinion. Since the fund launched, a premium has been more of the usual for the fund. Going to a discount when the rest of the market tanked, much as we are now.
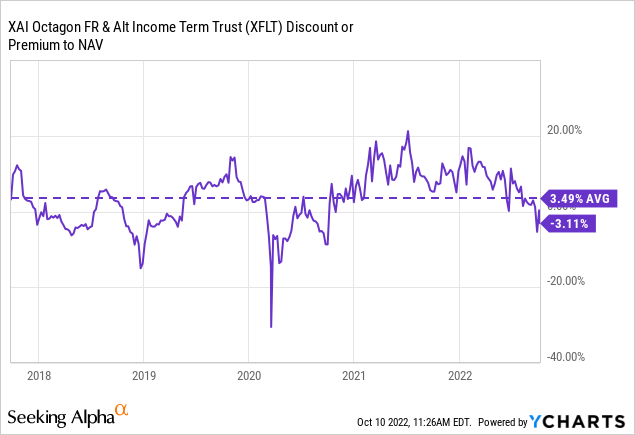
Ycharts
Helping to keep their leverage costs in line is the XAI Octagon Floating Rate & Alternative Income Term Trust 6.50% Preferred (XFLT.PA). XFLT.PA is a fairly attractive investment on its own. However, it’s currently trading above par and has done so for most of its life. It becomes callable on or after Sept. 30, 2026.
With a fixed-rate preferred making up $39.9 million of their leverage, they have a meaningful portion not exposed to floating rates. The credit facility showed they had $110.65 million in borrowings at the end of June. That was a reduced amount from the $124.15 million reflected at the end of March 31, 2022. The credit facility is subject to costs of one-month LIBOR plus 1.25%.
Conclusion
Despite what the share price and NAV might be showing on PDO and XFLT, these two funds continue to provide significant payouts to investors. These payouts are significantly covered in the case of PDO or have a path to being covered in the case of XFLT.
Besides the discounts that these funds are sporting, the underlying holdings also are discounted, which could be realized at some point when they mature. The main risk is that they default during a recession. Thus, why they’re discounted in the first place as they reflect these risks. Still, some of this seems to be priced in at this point. Admittedly, I don’t know when the bottom is or where peak interest rates are, but I think PDO and XFLT present interesting choices at this time.
Editor’s Note: This article discusses one or more securities that do not trade on a major U.S. exchange. Please be aware of the risks associated with these stocks.
Be the first to comment