

benedek
The Invesco CEF Income Composite Portfolio ETF (NYSEARCA:PCEF) uses a fund-of-funds approach to invest in high yielding closed-end-funds (“CEFs”). The PCEF focuses on fixed income and option income strategies that do not charge outrageous fees. In normal times, PCEF’s fund-of-funds approach smooths out the extremes in individual CEF fund returns, allowing the fund to earn 8.7% average annual returns from 2012 to 2021, which approximates its distribution yield.
However, when exogenous drivers such as rising interest rates impact all asset classes and strategies simultaneously, PCEF’s diversification strategy fails and the fund delivers poor total returns. Looking ahead, there is a significant risk of an impending global recession, which should have broad negative effects on credit and equity CEF funds. Therefore, I would avoid the PCEF exchange-traded fund (“ETF”).
Fund Overview
The Invesco CEF Income Composite Portfolio ETF uses a ‘fund-of-funds’ approach to provide exposure to a basket of high-yielding closed-end-funds (“CEF”). The PCEF ETF has $700 million in assets.
Strategy
To achieve its investment objective, the PCEF ETF tracks the S-Network Composite Closed-End Fund Index (“Index”). The index is designed to measure the overall performance of a universe of U.S. listed closed-end-funds that are designed to generate taxable annual yield. The underlying funds must have a stated objective of investing in taxable investment grade fixed-income securities, taxable high yield fixed-income securities, or taxable options.
In addition, the underlying funds must have a minimum capitalization of $100 million, daily turnover greater than $500,000 (greater than $300,000 daily turnover to remain in the index) and a management fee of below 1.25% for initial inclusion (management fees must be less than 1.5% to remain in the index). Finally, the underlying index constituents are weighted based on their net assets (capped at 8%), and funds trading at average premiums of 20% or more are excluded.
Portfolio Holdings
In total, the PCEF ETF holds 118 positions in CEFs, with the top 10 largest positions shown in Figure 1 below.
Figure 1 – Top 10 positions of PCEF ETF (invesco.com)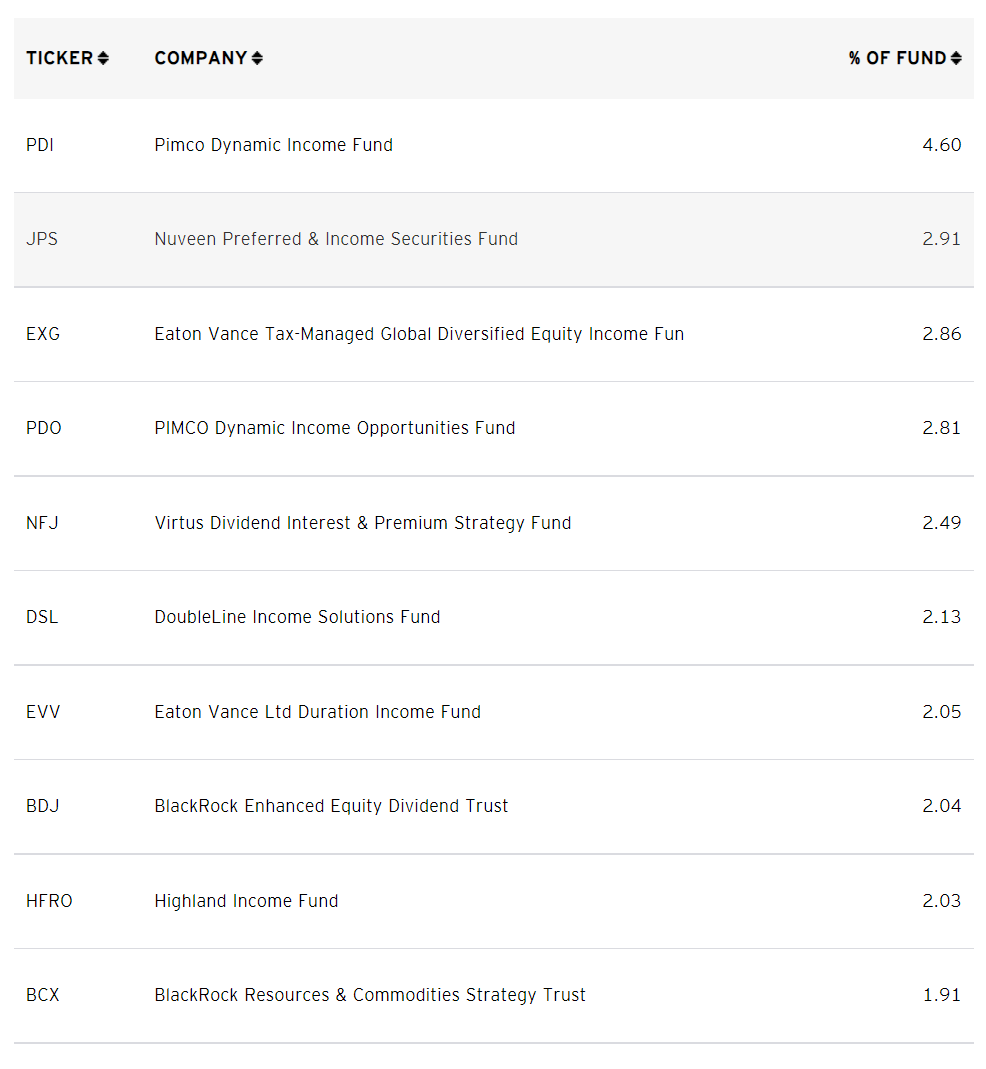
The PCEF ETF holds 37% of its assets in bond funds, 29% in high yield bond funds, and 33% in option income funds (Figure 2).
Figure 2 – PCEF strategy breakdown (invesco.com)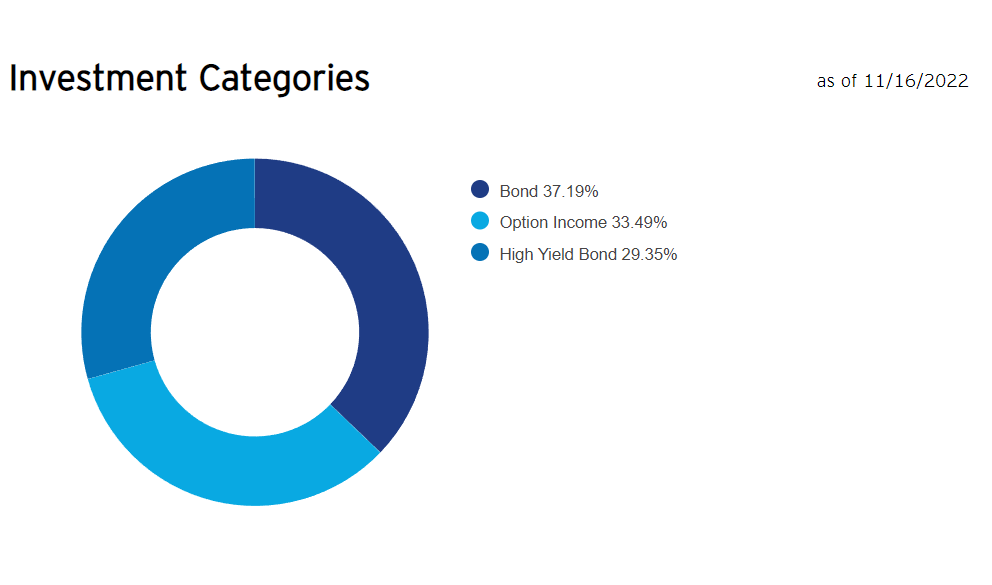
Returns
The PCEF ETF has produced modest returns over its history. It has 1/3/5/10Yr average total returns of -19.8%/0.4%/2.0%/4.5% to October 31, 2022 (Figure 3). Comparing the PCEF to the S&P 500, the PCEF ETF has lagged significantly on all timeframes.
Figure 3 – PCEF returns (invesco.com)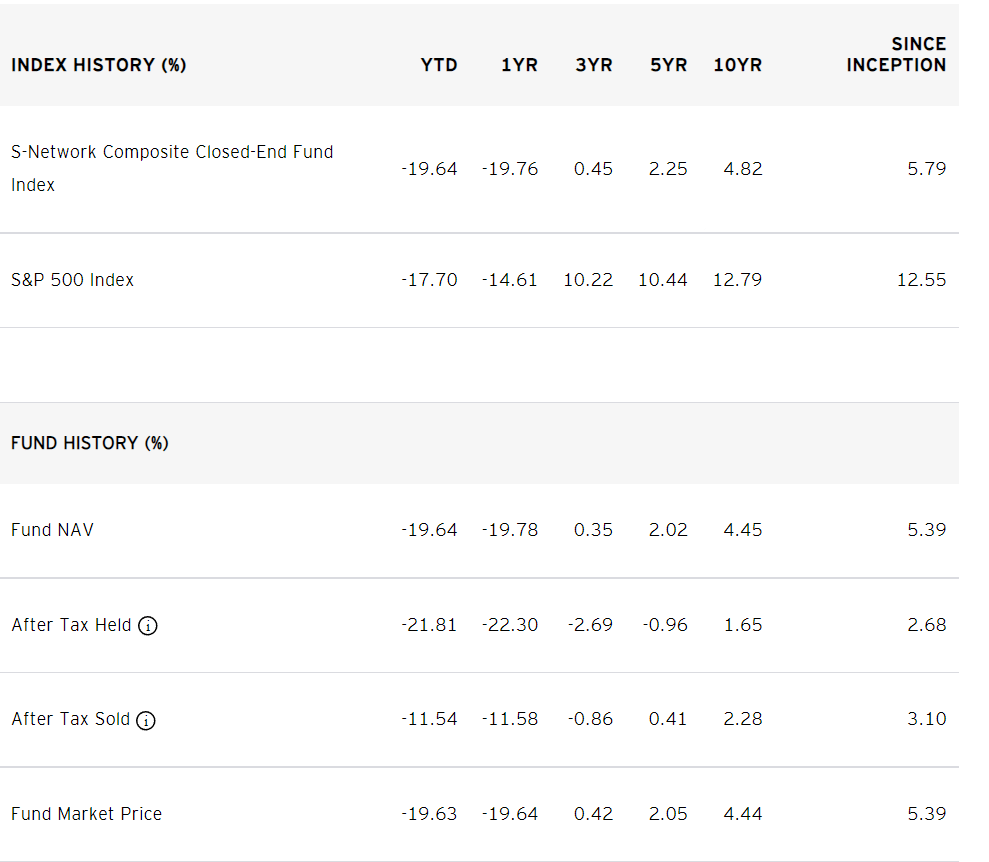
Distribution & Yield
However, investors interested in PCEF may not be looking for high total returns of a market index like the S&P 500. Many investors choose high yielding CEFs to supplement and/or replace their income. On this metric, PCEF does do an exemplary job. The PCEF pays a high distribution yield of 8.6% on a trailing 12 month basis (Figure 4). PCEF’s distribution is paid monthly.
Figure 4 – PCEF distribution yield (Seeking Alpha)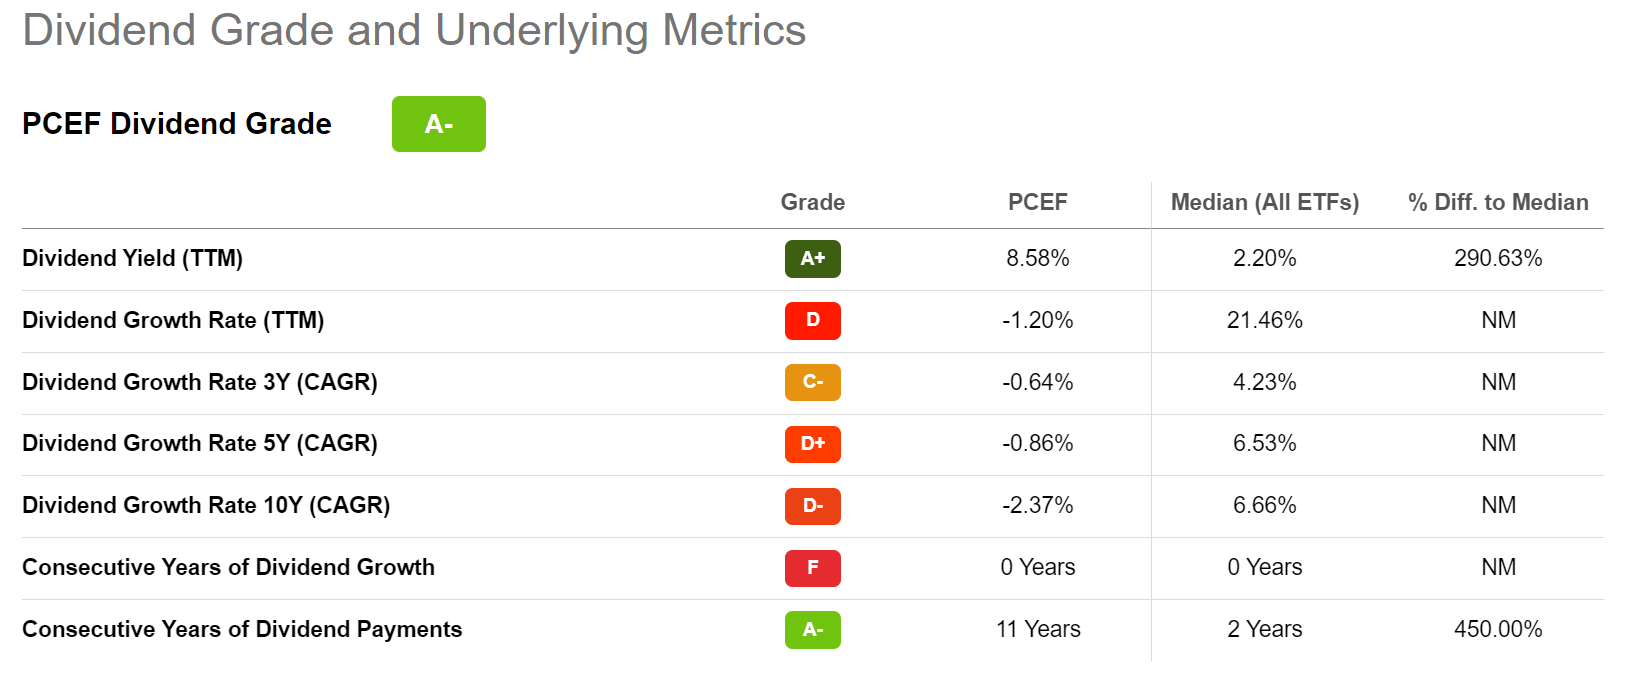
Fees
The PCEF ETF charges a 0.50% expense ratio.
Fund Of Funds Concept Applied To CEFs
Rather than try to pick and choose the “best” high yielding CEF, the PCEF ETF basically buys all of the CEFs that meet its selection criteria. Conceptually, it’s akin to an investor buying the SPDR S&P 500 ETF (SPY), because historically, only a small percentage of active funds beat the market over the long run.
Paying Fees On Top Of Fees
However, the downside of a fund-of-funds approach is that the investor is paying fees on top of fees. This is counter to the “buy the market” concept that tries to minimize fees by buying the SPY ETF instead of active funds.
For example, the PCEF’s biggest weight is the PIMCO Dynamic Income Fund (PDI). Although the PDI fund meets PCEF’s selection criteria with a management fee rate of 1.10%, if we account for trading fees and leverage fees, PDI’s total expense ratio is actually 2.64% (Figure 5).
Figure 5 – PDI fund expense ratio (pimco.com)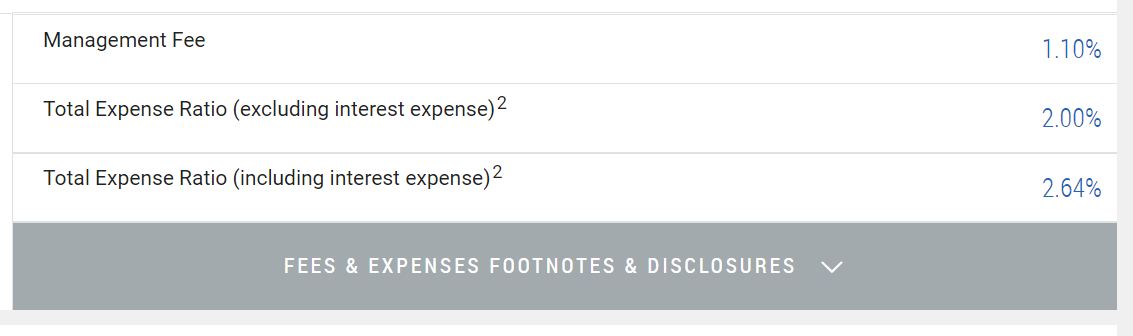
In fact, if we go through PCEF’s holdings, we find that the average fund has an expense ratio of 1.46%, with a min of 0.52% and a max of 2.82% (Figure 6).
Figure 6 – PCEF underlying fund expense ratio statistics (Author created with fund data from Seeking Alpha)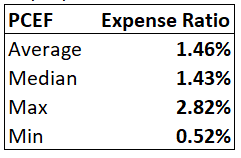
So although the PCEF ETF only charges a 0.50% management fee, the total expense ratio, after accounting for underlying fund expenses, works out to 1.97% (Figure 7).
Figure 7 – PCEF fund details (invesco.com)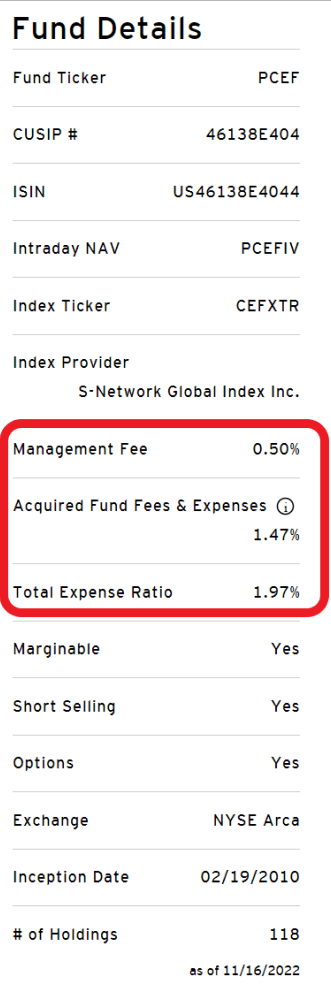
Dampened Return Volatility
On the positive side, a fund-of-funds approach does dampen the individual fund return volatility. For example, on a 1-year basis to October 31, 2022, the Blackrock Science & Technology Trust (BST), a 1.28% position in PCEF, has lost 39.6%. On the other hand, the Blackrock Energy and Resources Trust (BGR), a 0.81% position in PCEF, has gained 34.9%.
In most years, the fund-of-funds approach provides diversification benefits and allows the PCEF ETF to generate modest, if unspectacular returns. From 2012 to 2021, the PCEF ETF generated average annual returns of 8.7%, which is sufficient to pay a high monthly distribution yield (Figure 8).
Figure 8 – PCEF annual returns (morningstar.com)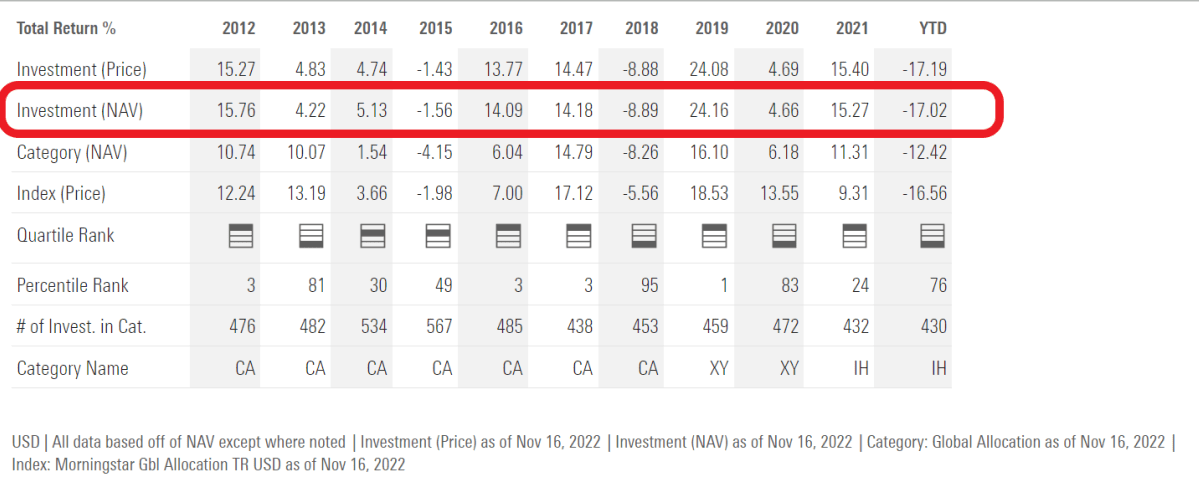
2022 has been a bit of an anomaly in that rising interest rate have hit all strategies employed by PCEF (investment grade bonds, high yield bonds, option income) equally hard, so PCEF did not enjoy any diversification benefits from its fund-of-funds approach.
The question is whether poor CEF returns will continue into 2023?
How Will PCEF’s Strategies Respond To A Recession?
With many economists and pundits forecasting a global recession for 2023, the key question to think about is how will PCEF’s strategies respond in a recessionary environment (Figure 9).
Figure 9 – Conferene Board forecasts a recession in the next 12 months (Conference Board)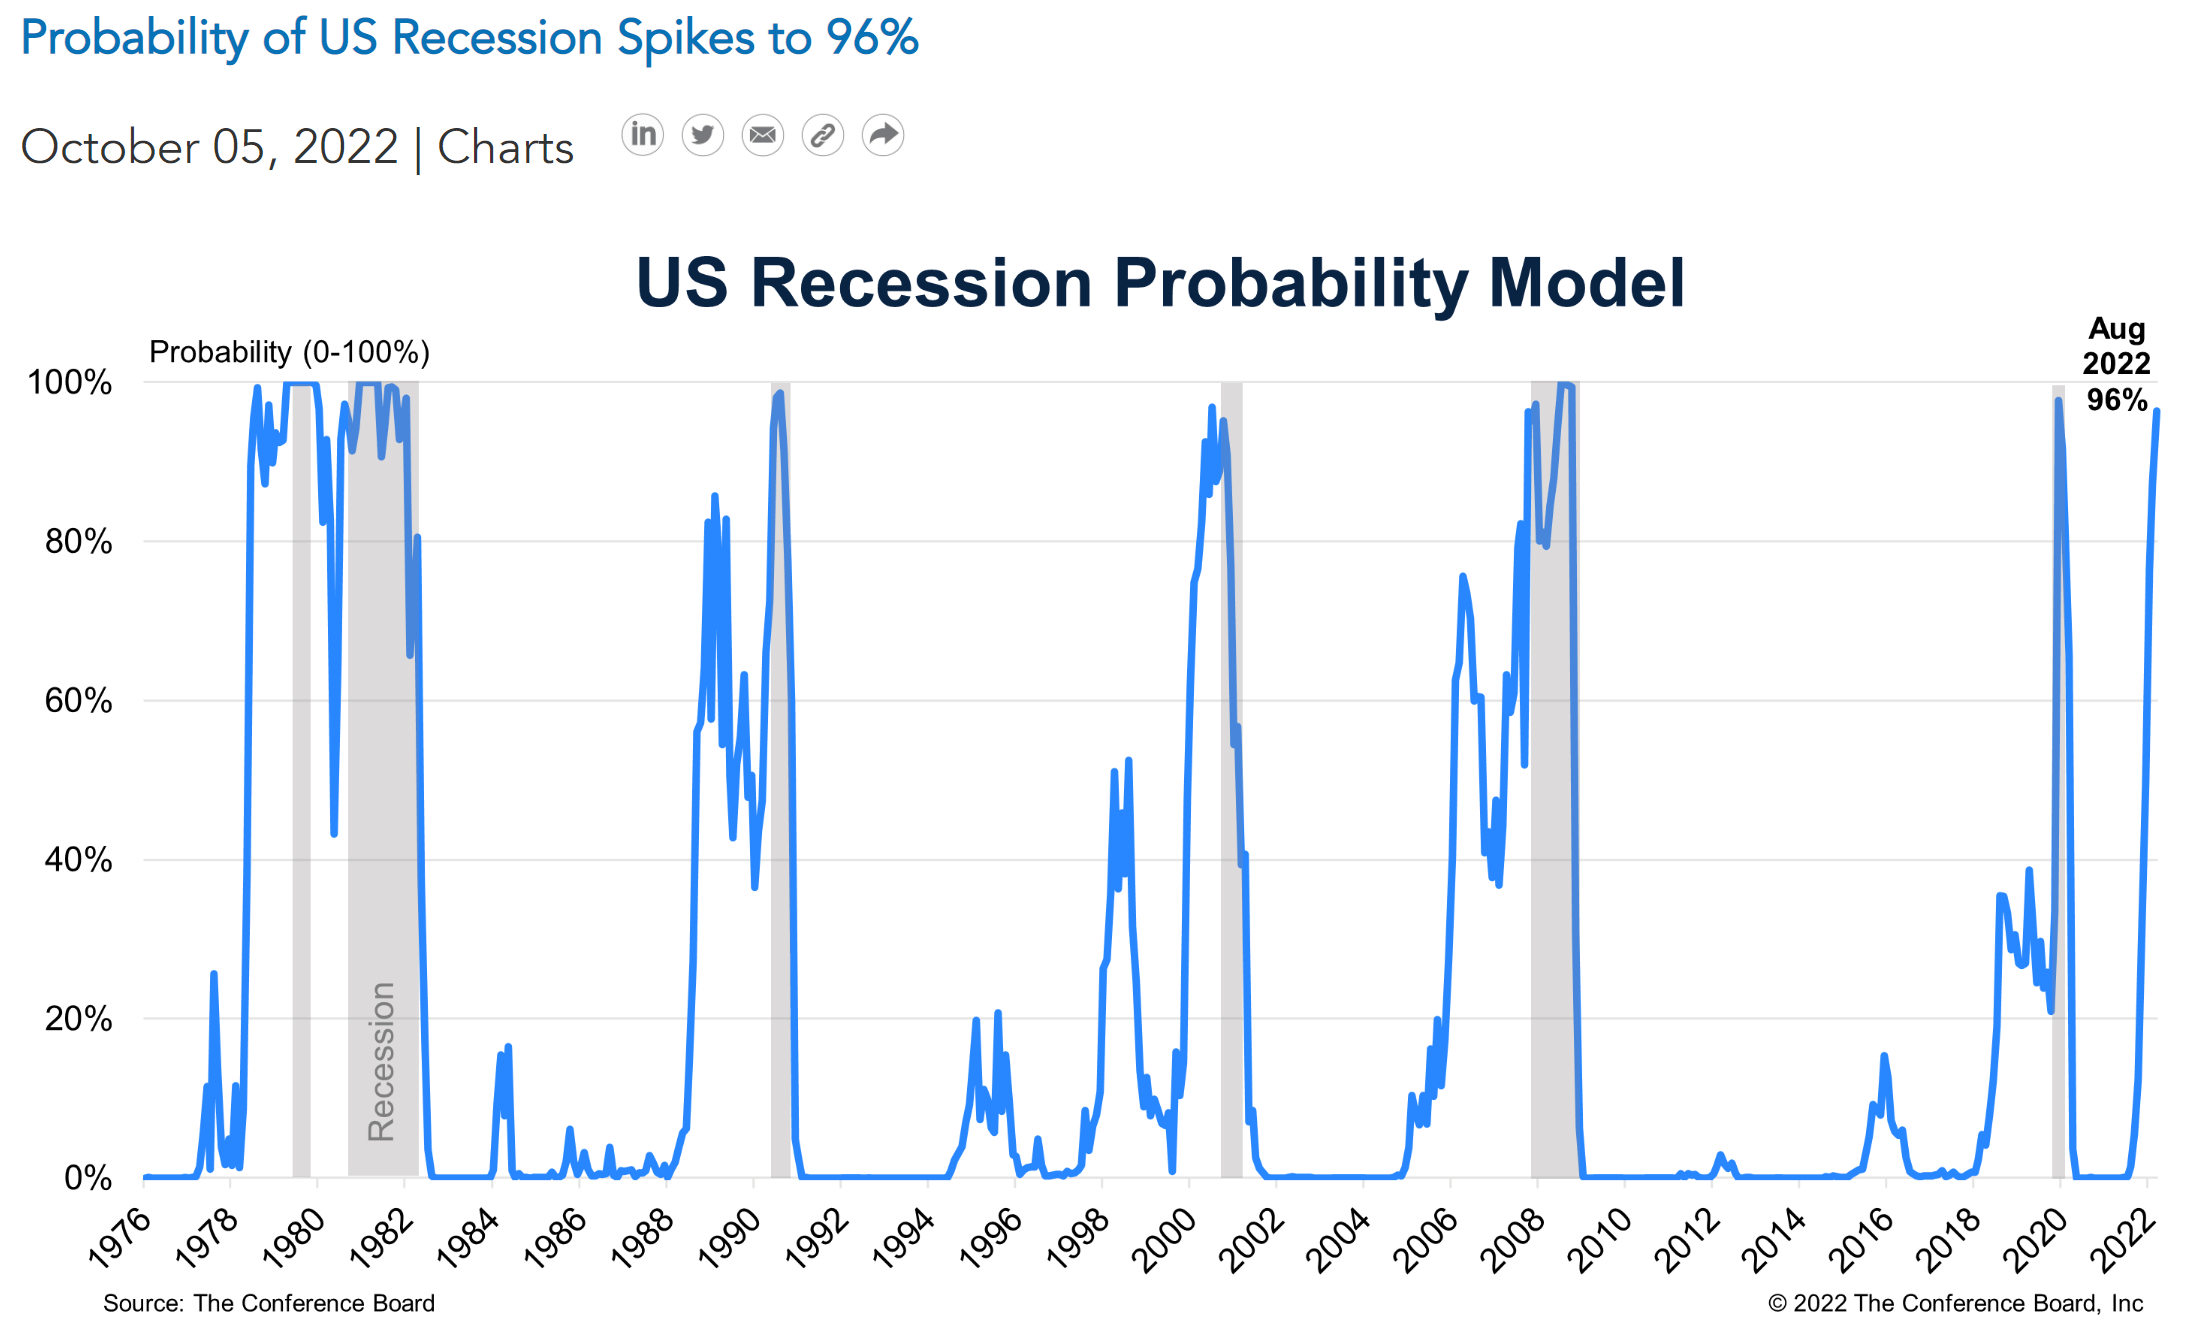
Unfortunately, the PCEF ETF was incepted in February 2010, after the last business cycle recession in 2008/2009, so we cannot directly observe PCEF’s historical performance for clues.
What we can do is think about how a recessionary environment will impact the fund’s three strategies. First, for funds that focus on investment grade (“IG”) fixed income, a recession should lead to a widening of credit spreads, which can lead to mark-to-market losses for IG fixed income funds. Figure 10 shows widening IG credit spreads during recessionary periods. On the flip side, higher spreads may lead to higher investment income, as funds can be reinvested into higher yielding securities.
Figure 10 – IG spreads tend to widen during recessions (St. Louis Fed)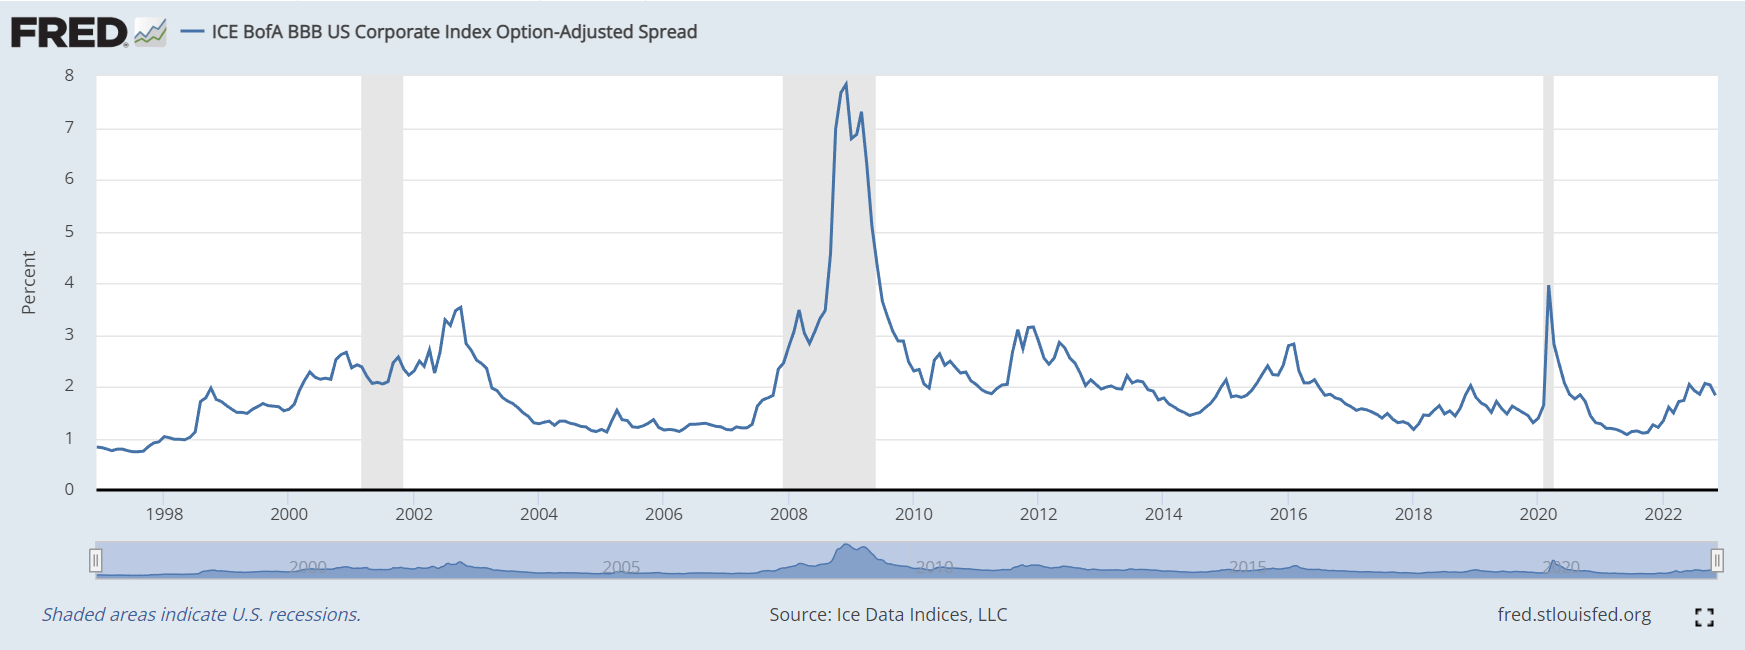
Next, a similar picture can be drawn for high-yield (“HY”) fixed income funds as high yield spreads also widen during recessions (Figure 11). The difference is that HY issuers tend to be less financial secure, so in a recession, a percentage of these issuers will go bankrupt, which may lead to credit losses for HY focused funds.
Figure 11 – HY spreads widen during recessions (St. Louis Fed)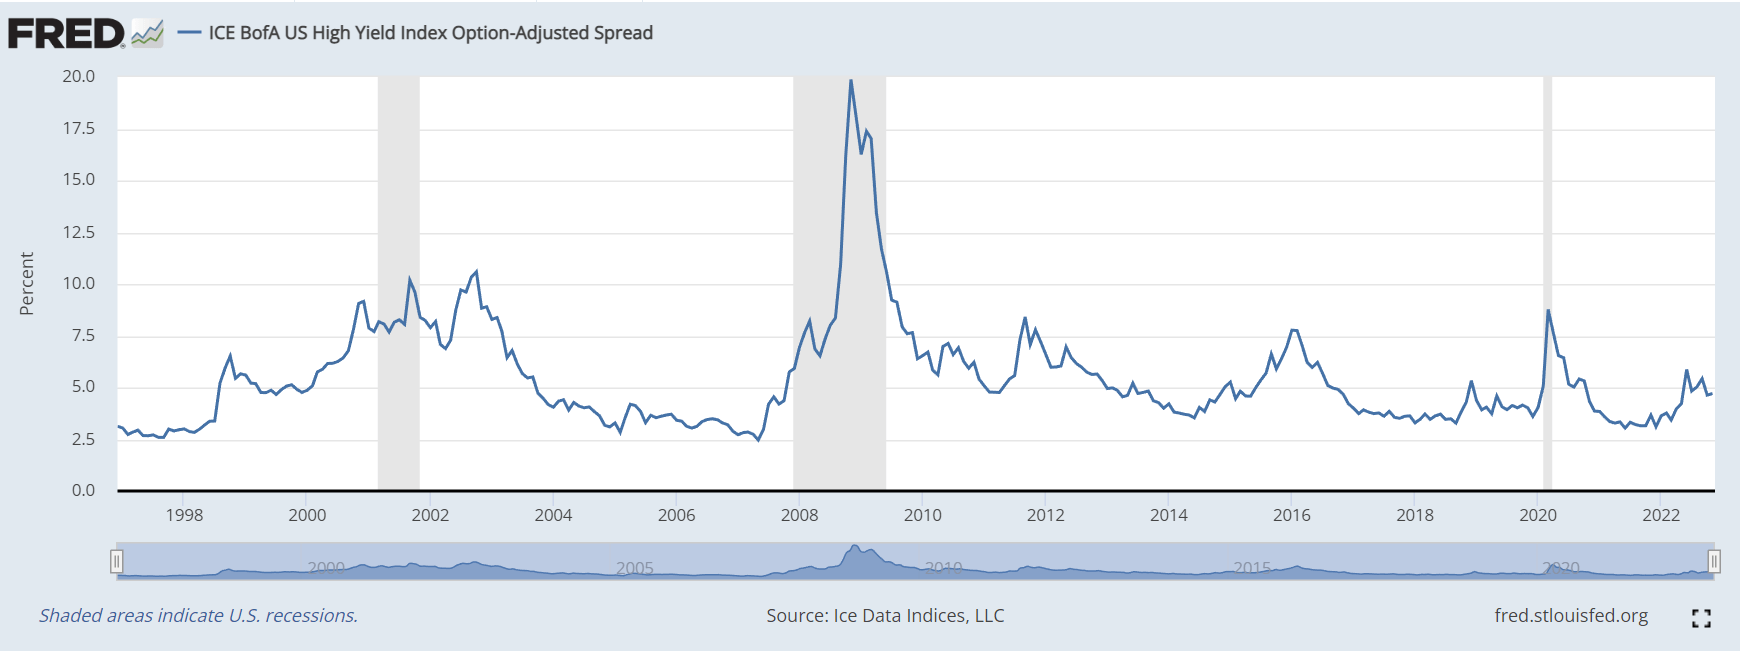
Depending on the severity of the downturn, HY funds may even have to cut their distributions. For example, the Eaton Vance Limited Duration Income Fund (EVV), a 2.05% weight in PCEF, has approximately 60% of its assets in HY bonds. In the 2008 recession, EVV had to cut its monthly distribution and the fund’s market price and NAV both fell by ~50% from peak-to-trough (Figure 12). In fact, EVV’s NAV and market price has never recovered to pre-2008 levels, so both income and capital were permanently impaired.
Figure 12 – EVV price vs. NAV (cefconnect.com)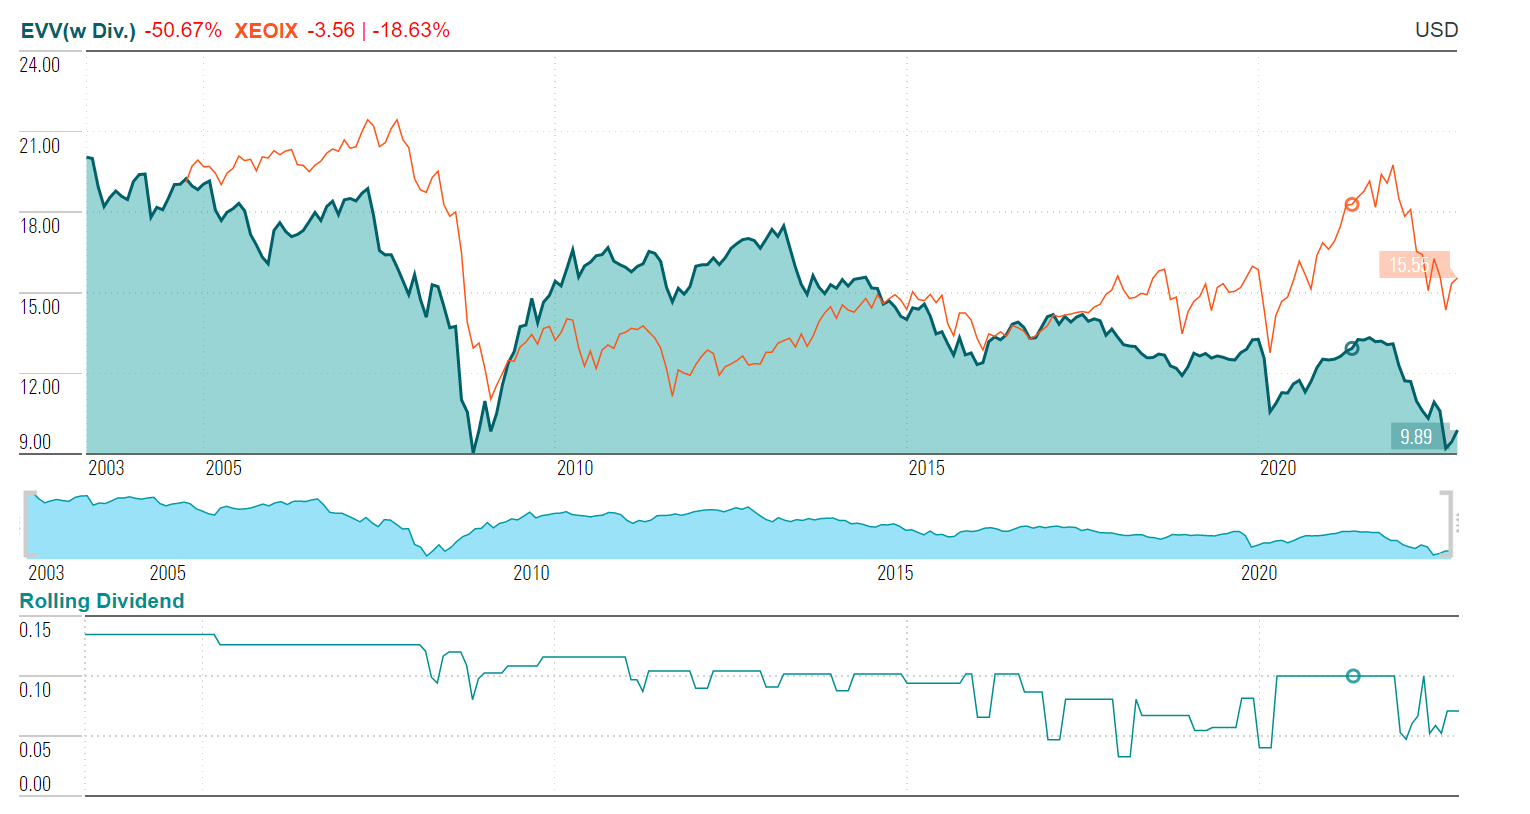
Finally, if we think about option income strategies, these funds tend to focus on selling covered call options to generate portfolio income, like the Eaton Vance Enhance Income Fund (EOI), a 0.78% weight in PCEF. Funds that sell covered calls trade away their upside for premium income. But they are not protected on the downside, i.e. during bear markets, covered call selling funds decline just as much as regular funds do.
YTD to October 31, 2022, the EOI fund has decline 17.0%, essentially the same as the S&P 500’s -17.7% return. In the 2008 recession, EOI’s NAV and market price both fell by over 50%, similar to the market’s declines (Figure 13).
Figure 13 – EOI price vs. NAV (cefconnect.com)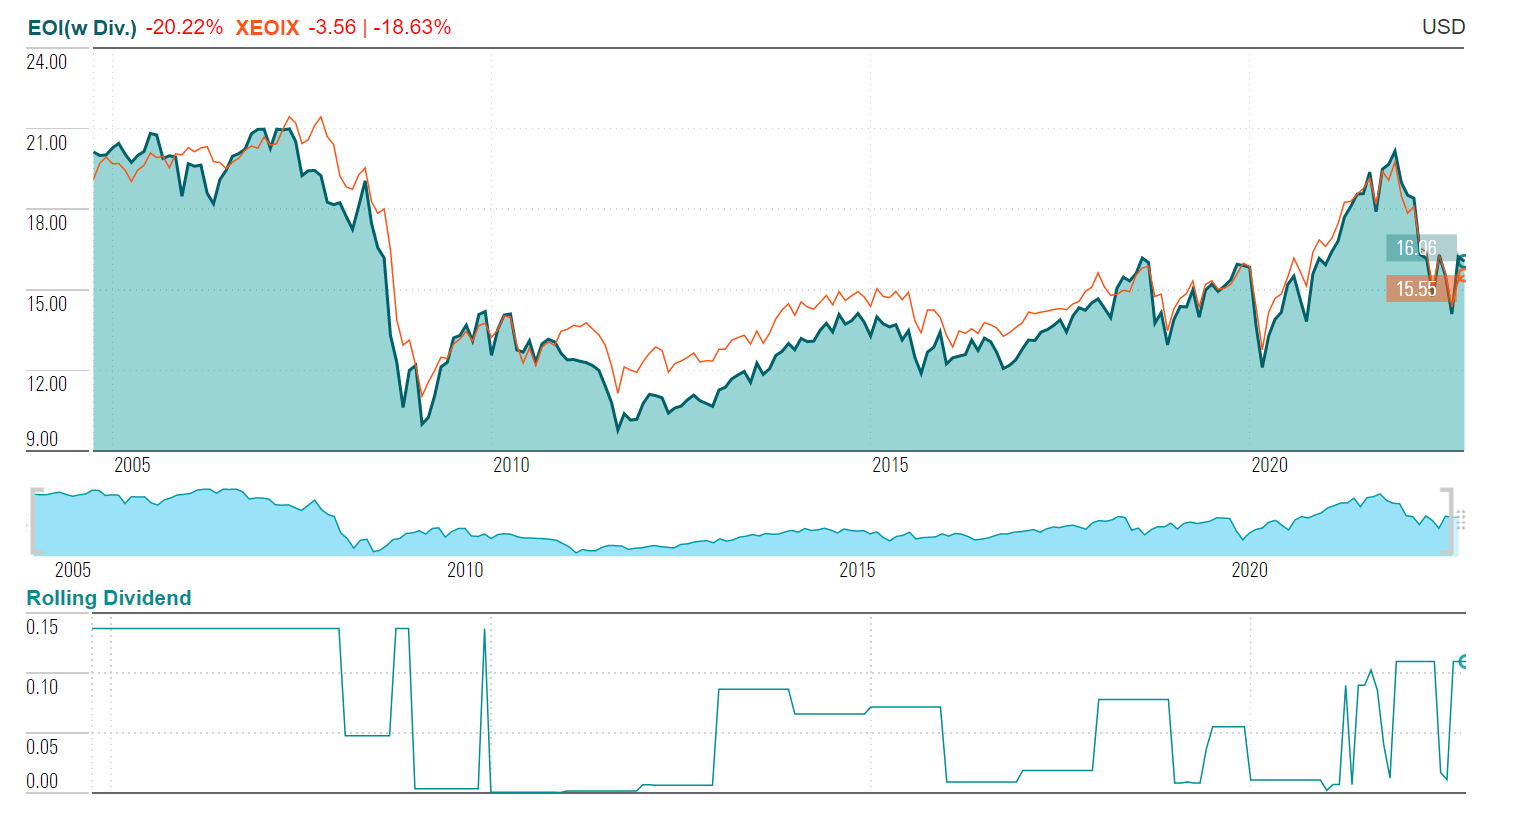
So if we do see a global recession in 2023, the PCEF ETF will likely deliver poor total returns, as the underlying CEF funds will be negatively impacted.
Conclusion
The PCEF ETF uses a fund-of-funds approach to invest in high yielding closed-end-funds. The PCEF focuses on fixed income and option income strategies that do not charge outrageous fees. In normal times, PCEF’s fund-of-funds approach smooths out the extremes in individual CEF fund returns, allowing the fund to earn 8.7% average annual returns from 2012 to 2021, which approximates its distribution yield. However, when exogenous drivers such as rising interest rates impact all asset classes and strategies simultaneously, PCEF’s diversification strategy fails and the fund delivers poor total returns.
Looking ahead, there is a significant risk of an impending global recession which will have broad negative effects on credit and equity CEF funds. Therefore, I would avoid the PCEF ETF.
Be the first to comment