

Sean Gallup
Thesis
For high-risk and high-return opportunities like PayPal (NASDAQ:PYPL), it is much better to pay attention to superinvestors than the overall market, given their independent thinking and also longer time horizon. The chart below shows the top 9 super investors who have placed the largest position on PYPL in terms of its weight in their portfolios. As you can see, only 1 of them reduced their position during the most recent 13F disclosure. And 3 of them slightly increased their exposure (by less than 1%). A total of 3 of them increased their exposure dramatically, ranging from 22% to 133%. Finally, 2 of them initiated a new position (Lone Pine Capital and Dodge & Cox).
All told, PYPL is the 35th highest-ranked holding among all superinvestors tracked by Dataroma. And indeed, you can see that several of them placed very concentrated bets on PYPL. Lindsell Train devoted 7.23% of its portfolio to PYPL, Dorsey Asset Management 6.45%, and Wedgewood Partners 4.00%. These superinvestors are holding PYPL at an average price of $69.85. With its 2022 TTM EPS of $3.85 (provided by SA), their holding price translates to a holding PE of 18.15x.
Of course, superinvestors are not always right. But next, we will see that in this case, a simple reality check would show that such a holding PE indeed provides a highly skewed return profile.
Source: Dataroma.com
Reality check
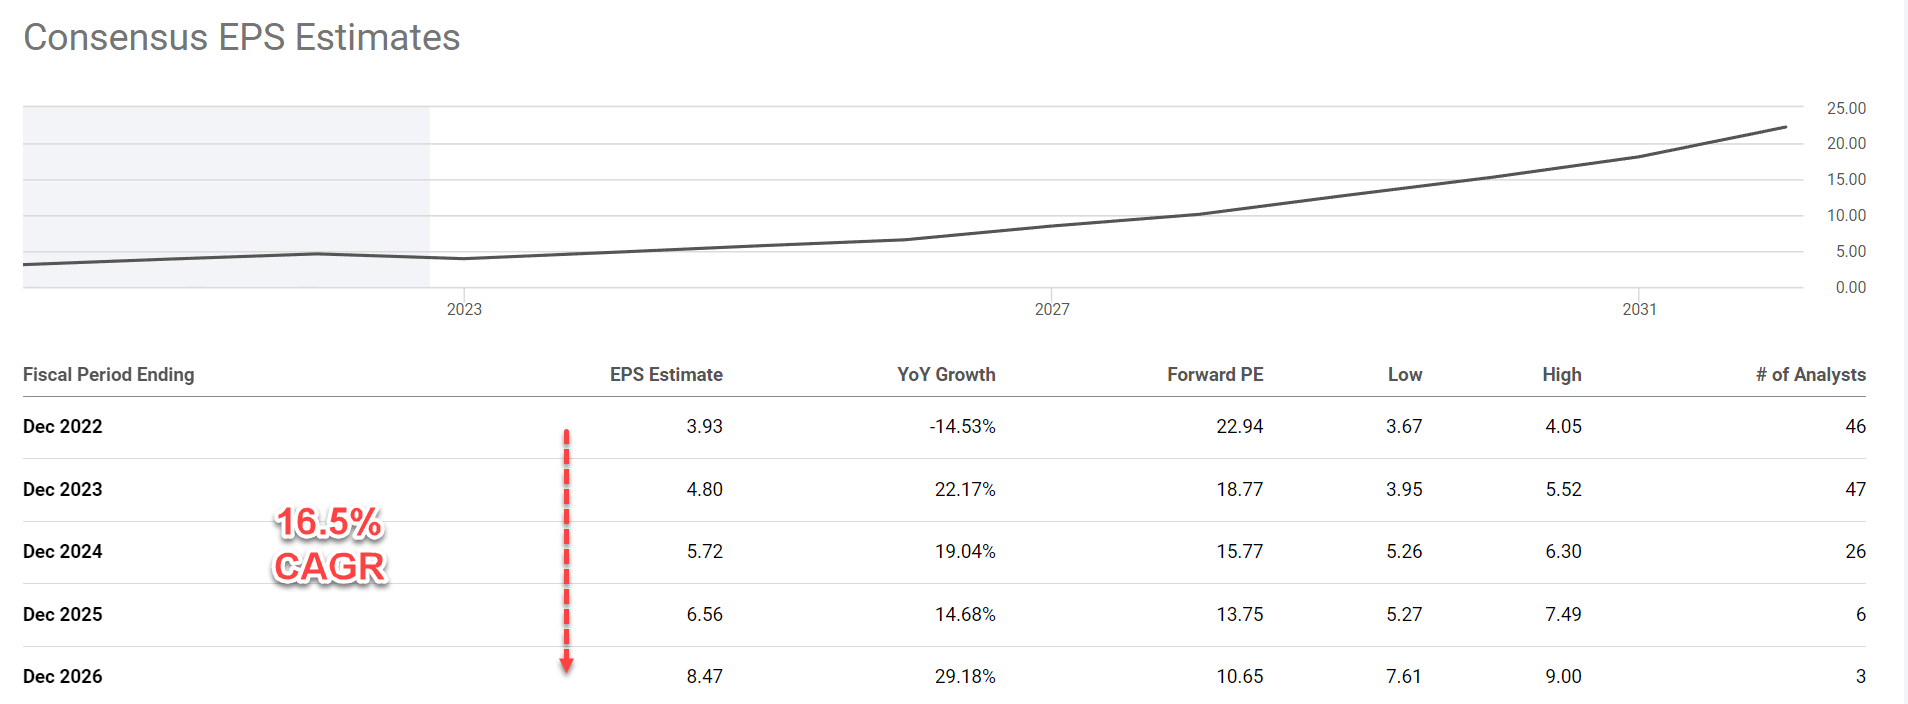
The chart below shows an extremely simple analysis that I call a reality check. The calculation projects the growth rate and terminal PE required to realize a given annualized return (“ROI”) in 5 years. The calculations were made at the current entry price and entry PE of 23.4x based on TTM EPS. It is performed for two terminal PE multiples: 20x and 18.15x (the superinvestors holding PE as just mentioned above). The consensus forecasts project its EPS to grow at 16.5% CAGR in the next few years as shown in the second chart below. Therefore, even if a PE contraction occurs to the 20x (blue line) or 18.15x (green line), the investment can still deliver a healthy return in the range between 10% to 12.4% at this projected growth rate. Even if growth slows down to 10% and PE contracts to 18.15x, the projected annual return is still 4.5%. Here I picked 18.15x PE in my reality check again because of the longer time horizon from the superinvestors. Their holding stability does help to provide a floor for the valuation.
Finally, I also feel the above reality check is already a bit too pessimistic. For example, it completely ignored the possibility of a stable PE or even a PE expansion. It also ignored its profitability drivers and the role of share repurchases, as to be elaborated on next.
Source: Author based on Seeking Alpha data Source: Author based on Seeking Alpha data
ROE and ROIC provide misguiding information
The next chart compares its return on equity (“ROE”) and returns on invested capital (“ROIC”), the market’s rationale for the recent selloffs. As you can see, its stock prices, ROE, and ROIC have almost moved in lock step. Its ROE peaked at around 27% in 2021 and ROIC peaked at around 19%. And its stock prices peaked at around $300 at the same time. Then they all plummeted together after that.
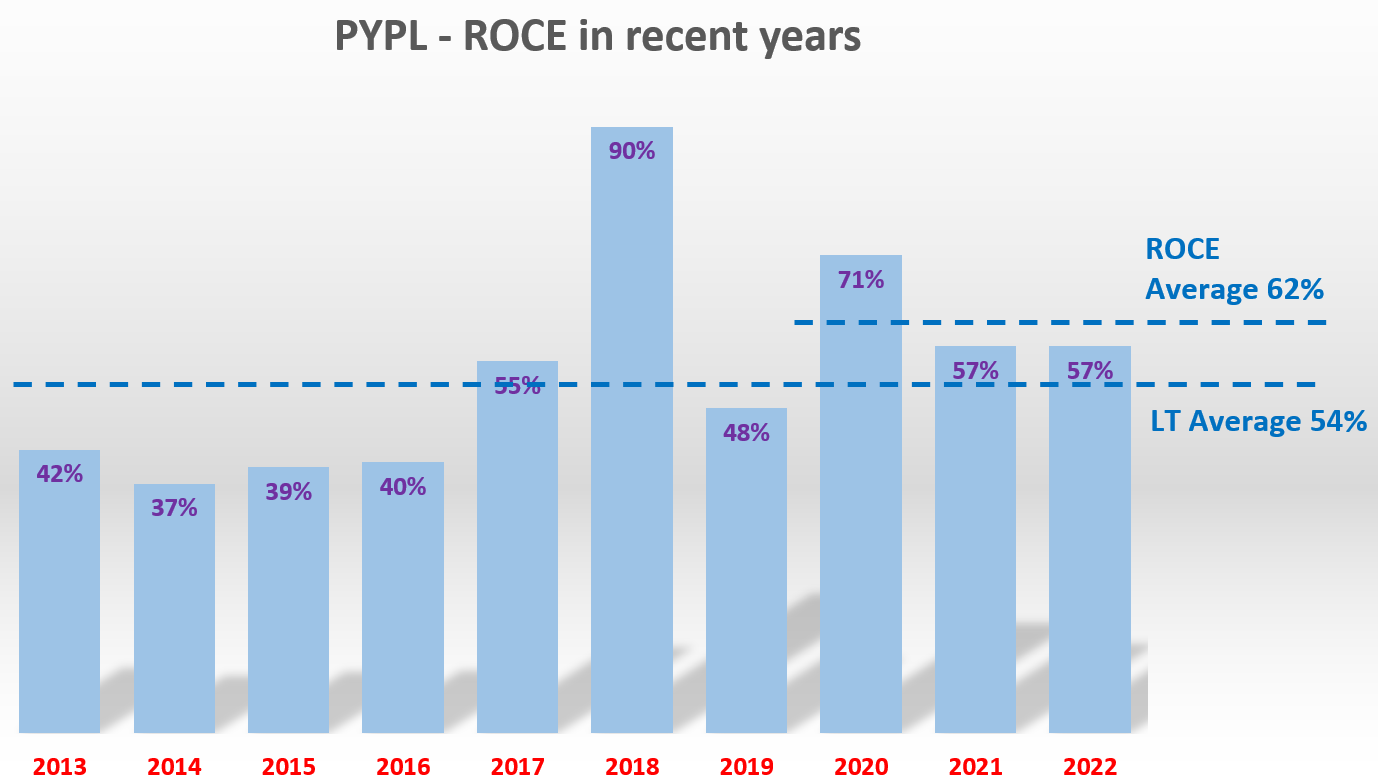
However, ROE and ROIC can be misleading indicators in many cases, as detailed in my blog article here. And PYPL is such a case in my view. In such a case, ROCE (return on capital employed) is a better indicator, as argued in my blog article. As seen in the 2nd chart below, PYPL has been maintaining a healthy and stable ROCE over the years. Its long-term ROCE has been on average 53.5% for the past decade. Its ROCE has been even higher in recent years, with an average of 62% in the past 3 years, as you can see. And its current ROCE based on 2022 TTM financials hovers around 57%, slightly above its long-term average.
Source: Seeking Alpha data Source: Author based on Seeking Alpha data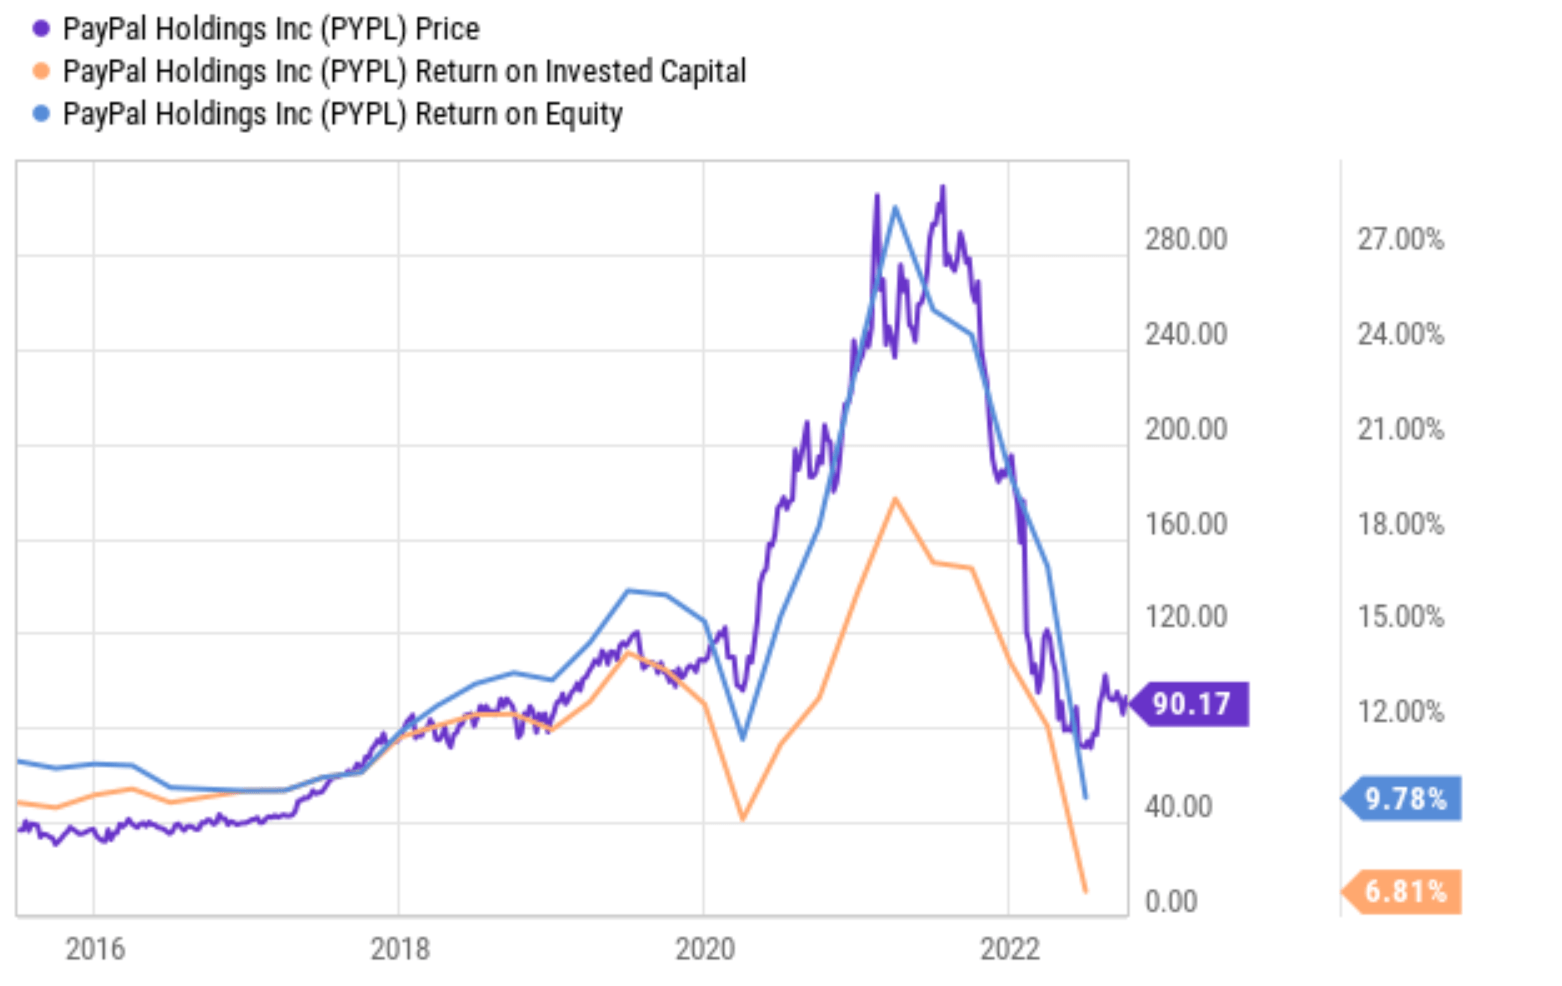
Aggressive share buybacks at accretive valuation
Another factor that makes my above return projection on the conservative side is its share repurchase. PYPL has been consistently (and quite aggressively) buying back its own shares since 2018. As you can see from the top panel of the following chart, its share count stood around 1.225 billion shares at the beginning of 2018. And now it has only 1.158 billion shares outstanding. This translates into a 5.5% reduction in its outstanding shares in less than 3 years.
Such repurchases create a non-negligible impact on total shareholder returns, especially when made at their current compressed valuations. As seen in the bottom portion of the chart, its net buyback yield has been on average 1.41% since 2016. And it currently stands at 3.78%, i.e., its pace of buybacks is currently more than twice higher than its average in the past 5 years. It just returned a total of $2.25 billion to shareholders in the first half of 2022 via buybacks, and the full-year 2022 share repurchases are expected to reach ~$4.0B. At its current market cap of $108B, such repurchases will reduce the share counts by about 3.7%. Looking forward, it has a new $15 billion share repurchase authorization. When this authorization completes, it would reduce the share count by another 13.8% assuming today’s market valuation.
Source: Seeking Alpha data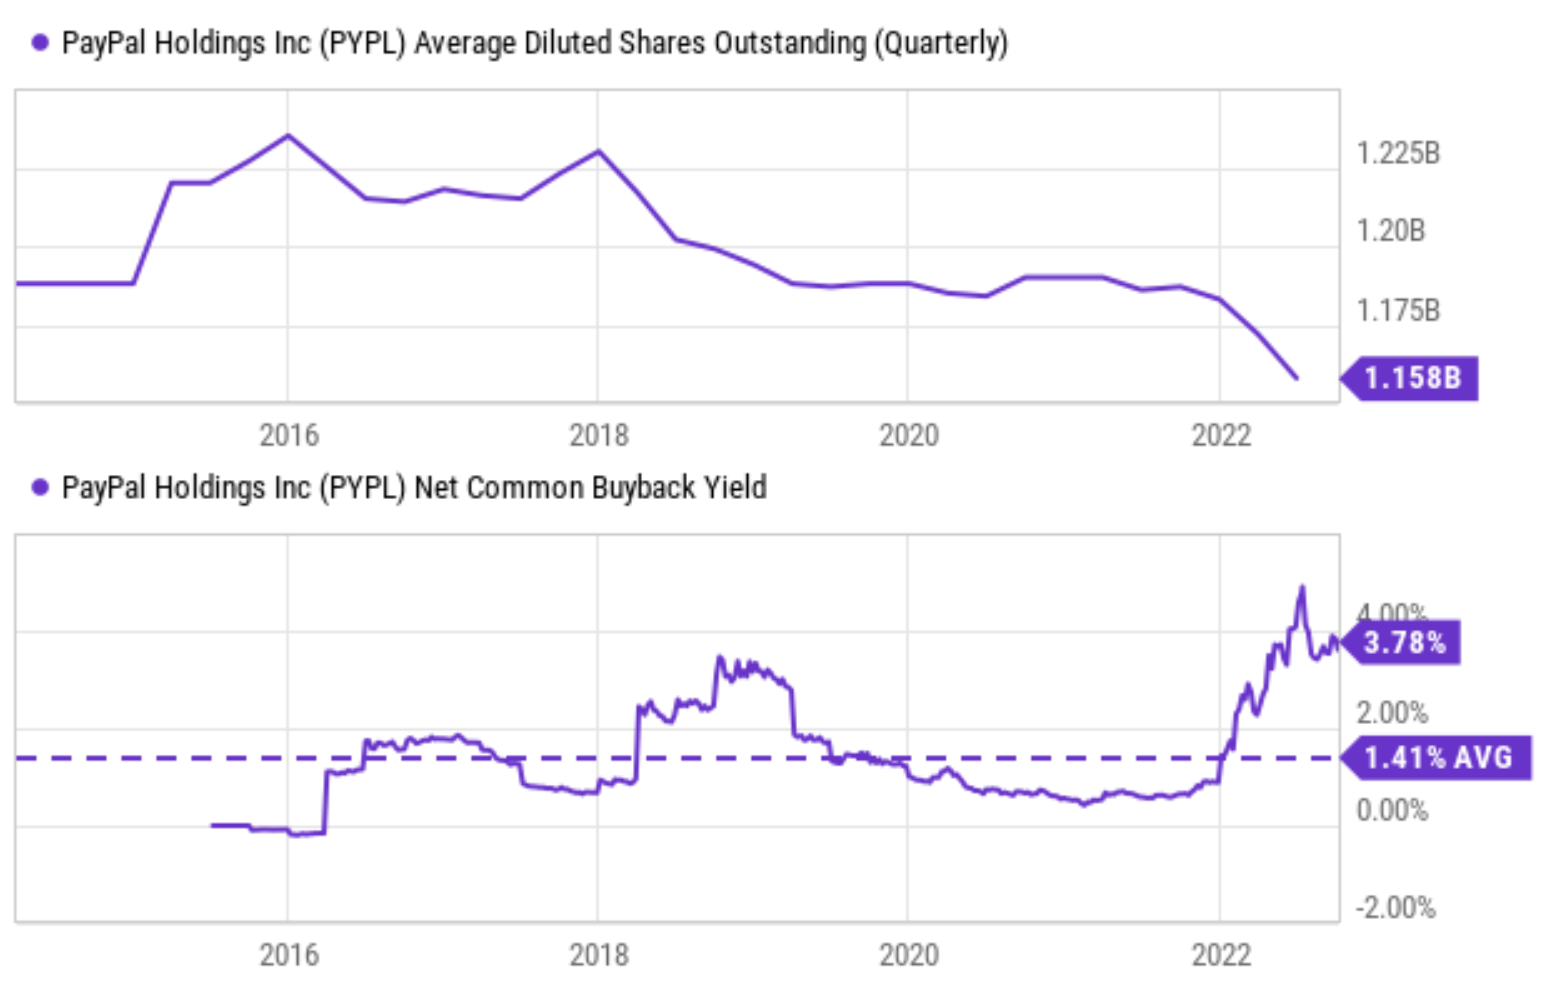
Risks and final thoughts
In the near term, I expect PayPal to continue its struggle on the profit front. For example, its net income in the March period (EPS of $0.43) declined more than 50% YoY. The decline was largely driven by higher transaction costs, rising general & administrative, and R&D expenses. Going forward, I see these headwinds persist and keep pressure on the operating margin and also the profit margin in the near term. The uncertainties brought about by these headwinds are capsulated in the large variance in the consensus forecasts as shown below. The variance between the optimistic and pessimistic forecasts is more than 40% as seen for the next year, 20% for 2024, and more than 42% for 2025.
Source: Author based on Seeking Alpha data
Despite these near-term headwinds, the long-term prospects are promising in my view. I anticipate the demand for its transaction services to thrive in the coming years as our world transitions to eCommerce unstoppably. Meanwhile, its strategic partnership with American Express and Citibank has been extended and provides immediate catalysts. On top of that, increased Venmo and buy-now-pay-later services are already showing momentum.
Finally, the stock price may have recently found a bottom, as argued in my earlier article. Compared to its peak price of around $310 reached in 2021, the stock has shed 71% of its price (which would take a 244% rally to break even). However, in the past few months, share prices have largely moved in a window between $70 and $90, suggesting that selling pressure may be drying up. And the fact that the top superinvestors have an average holding price of about $69.8 provides another indicator of the bottom. Their current holding price translates into a holding PE of 18.15x, which indeed provides a highly skewed return profile in my mind.
Be the first to comment