

Justin Sullivan/Getty Images News
Price Action Thesis
We present our detailed price action analysis of PayPal (NASDAQ:PYPL) stock as a follow-up to our previous article, given noteworthy developments in its price action over the past month.
We observed a potential bear trap that seems to be forming as PYPL continued to consolidate at its near-term support since May’s bottom. Therefore, the price action is constructive.
Our reverse cash flow valuation model indicates that the market is justified in asking for a higher free cash flow (FCF) yield in holding PYPL given its slowing growth moving ahead. However, we believe PYPL could still outperform the market at the current levels and therefore offers an attractive level to add exposure.
Notwithstanding, PYPL remains in bearish flow, and we have not observed a potent double bottom bear trap that could portend a significant reversal in momentum. That remains the most critical risk to our price action thesis.
Therefore, we reiterate our Buy rating on PYPL stock, with a near-term price target (PT) of $85, implying a potential upside of 15% (as of June 23’s close).
PYPL – Double Top Bull Trap Is Close To Being Fully Digested
PYPL price chart (monthly) (TradingView)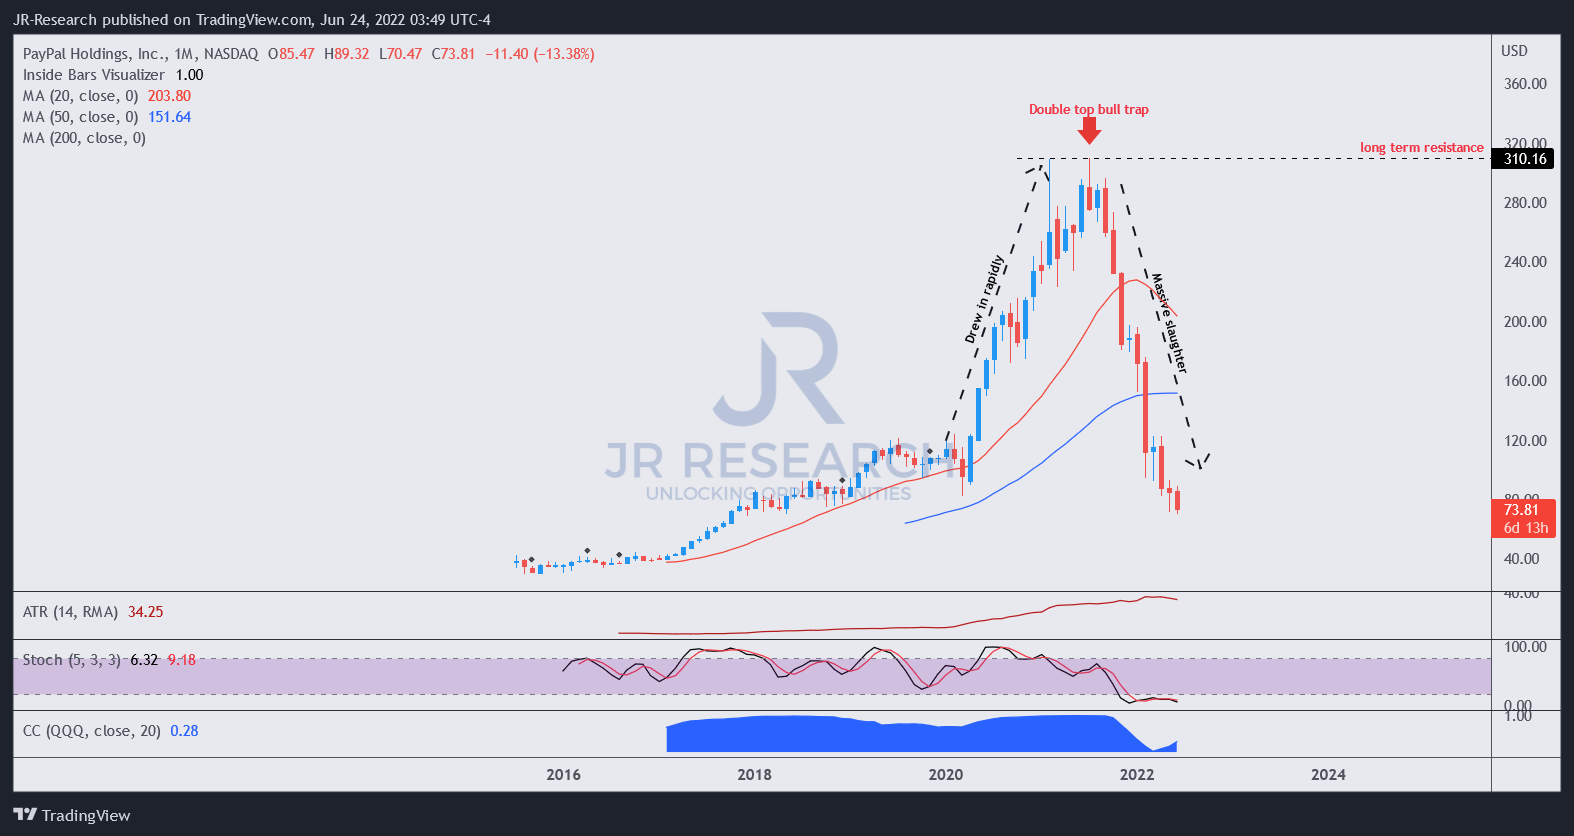
Over the past two years, the massive surge leading to its menacing double top bull trap has proffered critical learning lessons for PYPL investors (including ourselves). As long-term investors in PYPL, we were also caught up in its massive surge toward its double top but didn’t recognize it earlier to take profit.
Warren Buffett’s reminder that “Bull markets breed bloviated bull” was a poignant reminder for us to watch price action structures closely that resemble double top bull traps. Such traps are early warning signals highlighting a massive trend reversal for investors who can recognize it.
Notwithstanding, we believe the massive digestion from its double top is near completion as PYPL consolidates close to its May bottom, forming its near-term support.
PYPL price chart (weekly) (TradingView)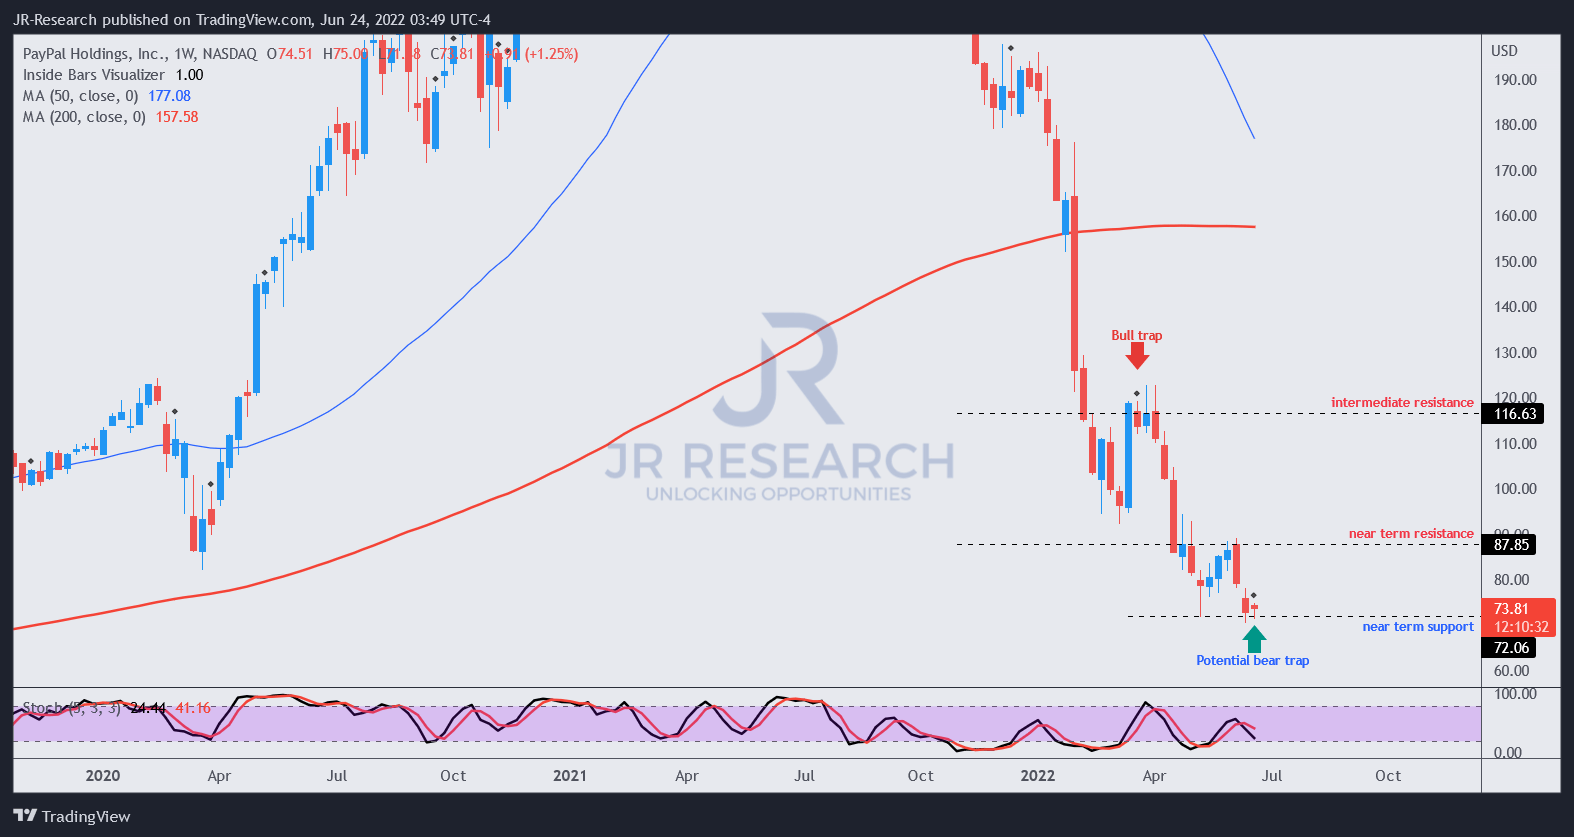
Moving into PYPL’s weekly chart, we observed a potential bear trap that could be validated by the end of today’s (June 24) regular session. Notably, PYPL has defended its May lows, even though the Invesco QQQ ETF (QQQ) fell to a lower low in June. Therefore, the market seems to have absorbed the selling pressure and held its near-term support of $72.
As a result, the price action structure is looking increasingly constructive for investors to consider adding at the current levels.
PayPal Can Potentially Outperform At The Current Levels
PayPal revenue change % and adjusted EBIT change % consensus estimates (S&P Cap IQ)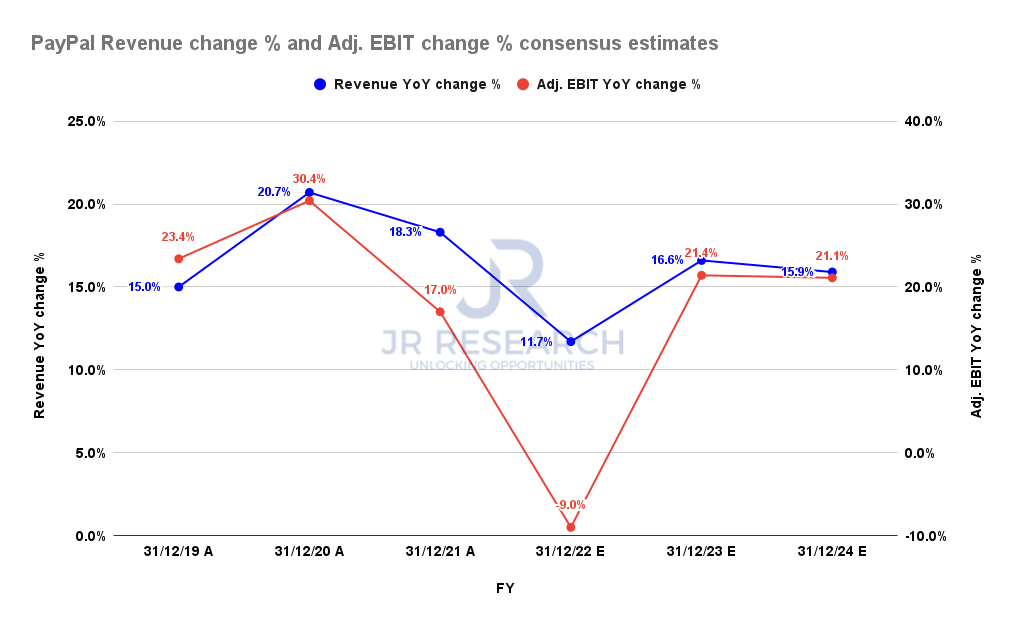
The consensus estimates were revised downward after its FQ1 report, given the macro and e-commerce headwinds. However, PayPal’s revenue and adjusted EBIT are estimated to reach a nadir in FY22 before recovering robustly from FY23.
Notwithstanding, the company is not expected to reach its 5Y revenue CAGR of 18.5% over the next few years. Therefore, we believe the market is justified to have de-rated PYPL stock to reflect the new market dynamics.
PayPal FCF margins % consensus estimates (S&P Cap IQ)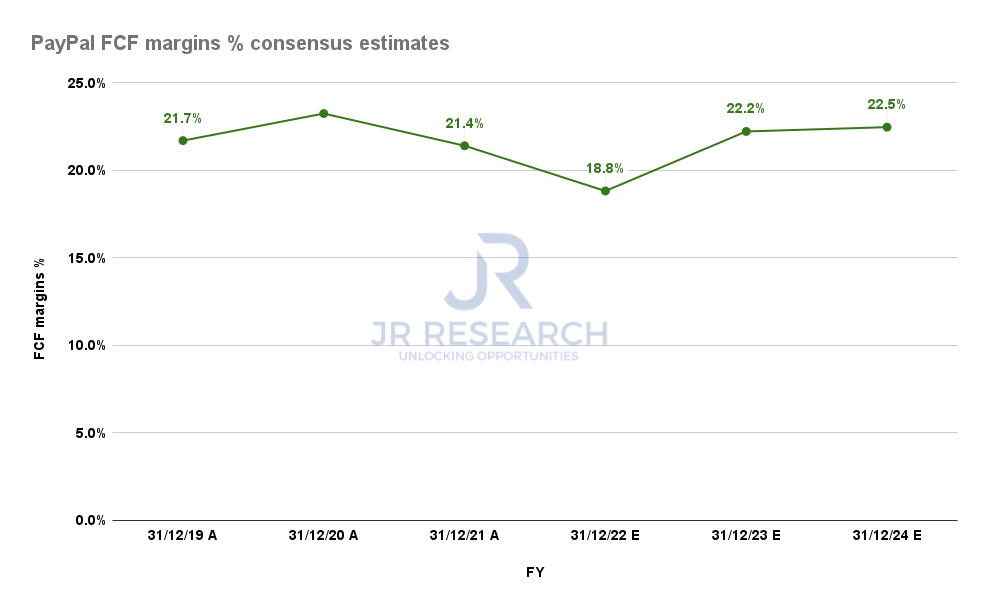
| Stock | PYPL |
| Current market cap | $85.47B |
| Hurdle rate (CAGR) | 20% |
| Projection through | CQ2’26 |
| Required FCF yield in CQ2’26 | 6% |
| Assumed TTM FCF margin in CQ2’26 | 21.6% |
| Implied TTM revenue by CQ2’26 | $49.23B |
PYPL reverse cash flow valuation model. Data source: S&P Cap IQ, author
However, PayPal’s free cash flow margins are expected to remain robust, helping to undergird its valuation. Therefore, PayPal’s operating leverage could help the company shake off weaker topline growth, which could be instrumental in its re-rating moving ahead.
Based on our reverse cash flow valuation analysis, we believe that PYPL could outperform the market at the current levels.
We used an above-market hurdle rate of 20%, which is lower than PYPL’s pre-COVID CAGR of 27.8%. Given its slower topline growth estimates, we think it’s reasonable to expect a lower hurdle rate on PYPL.
As a result, we believe it’s appropriate for the market to ask for higher FCF yields. Therefore, we applied an FCF yield of 6% in our model (Vs. pre-COVID mean of 4.45%). Notably, our price action analysis indicated that the market rejected the selling pressure as PYPL traded close to a 7% yield at its recent bottoms. Therefore, a 6% yield seems to be fair.
Consequently, we require PayPal to deliver a TTM revenue of $49.23B by CQ2’26, at a revenue CAGR of 16.4%. In addition, we used a lower blended TTM FCF margin to reflect headwinds from FY22. Therefore, if PayPal can recover its margins robustly through FY26, we believe a re-rating is in store.
Is PYPL A Buy, Sell, Or Hold?
We reiterate our Buy rating on PYPL stock. Our price action analysis indicates that PYPL is well-supported at its near-term bottom, with a potential bear trap. Notwithstanding, PYPL remains in a dominant bearish momentum, with no double bottom observed yet.
Our valuation analysis suggests that the worst seems to be over for PYPL stock, as it could outperform the market at the current levels.
Therefore, we believe it’s appropriate for investors to start layering in/add exposure/dollar-cost average at the current levels.
Our near-term PT of $85 implies a potential upside of 15% from June 23’s close.
Be the first to comment