


Richard Drury/DigitalVision via Getty Images
Investment thesis
Paylocity Holding Corporation (NASDAQ:PCTY) has been a massive outperformer in the past 5 years and offered three major breakouts which led the stock 185% higher since November 2019. The stock has recently failed in forming a major breakout but is still trading in its trading range, from where it could form a sound base and try to reach its ATH. In this negative and volatile market environment, it is important to spot stocks with significant relative strength and identify if they could be the leaders in the next market reversal. PCTY may technically be in such a situation, and despite the risk of a pullback should be seriously considered as the stock could fall until $230 and even further until $202, more risk-tolerant investors could build up a position if the support is holding and trade in the tightening trading range, or wait until the stock forms the next breakout.
A quick look at the big picture
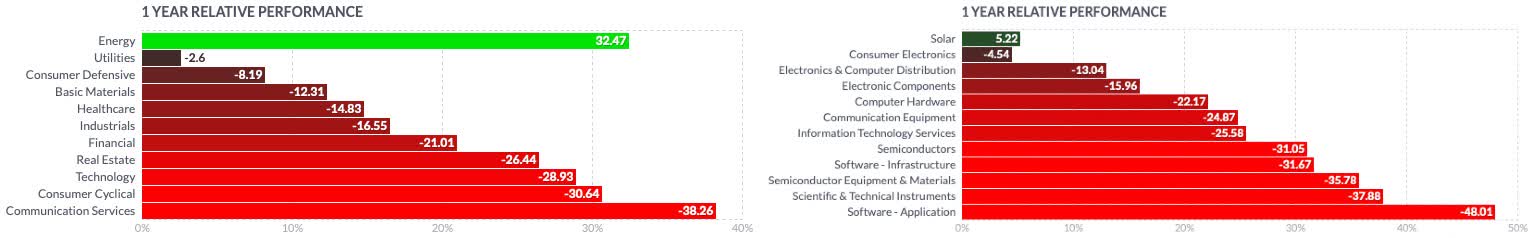
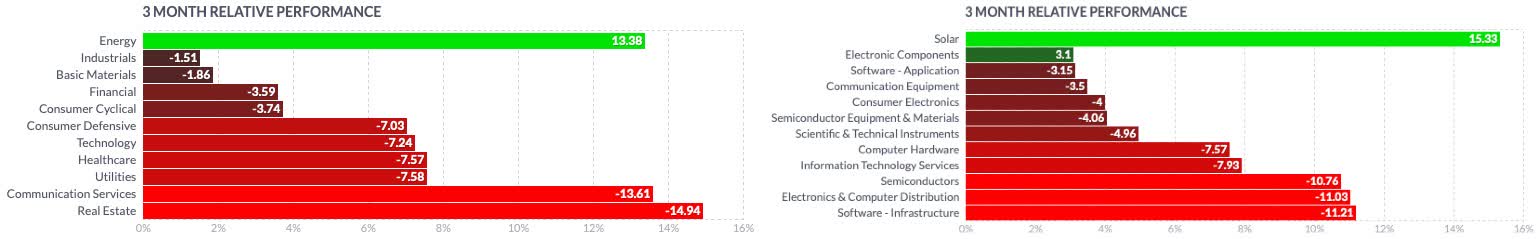
The technology sector in the US could not convince after its rebound during July and August and has given back all its gain, figuring under the losers in the past year and the last 3 months. While companies in the application software industry are leading the decline on a yearly scale, they recently seem to show more strength and slowdown in their decline. Companies in the semiconductor industry, electronics, and computer distributors, and infrastructure software manufacturers are instead leading the recent decline.
FINVIZ
FINVIZ
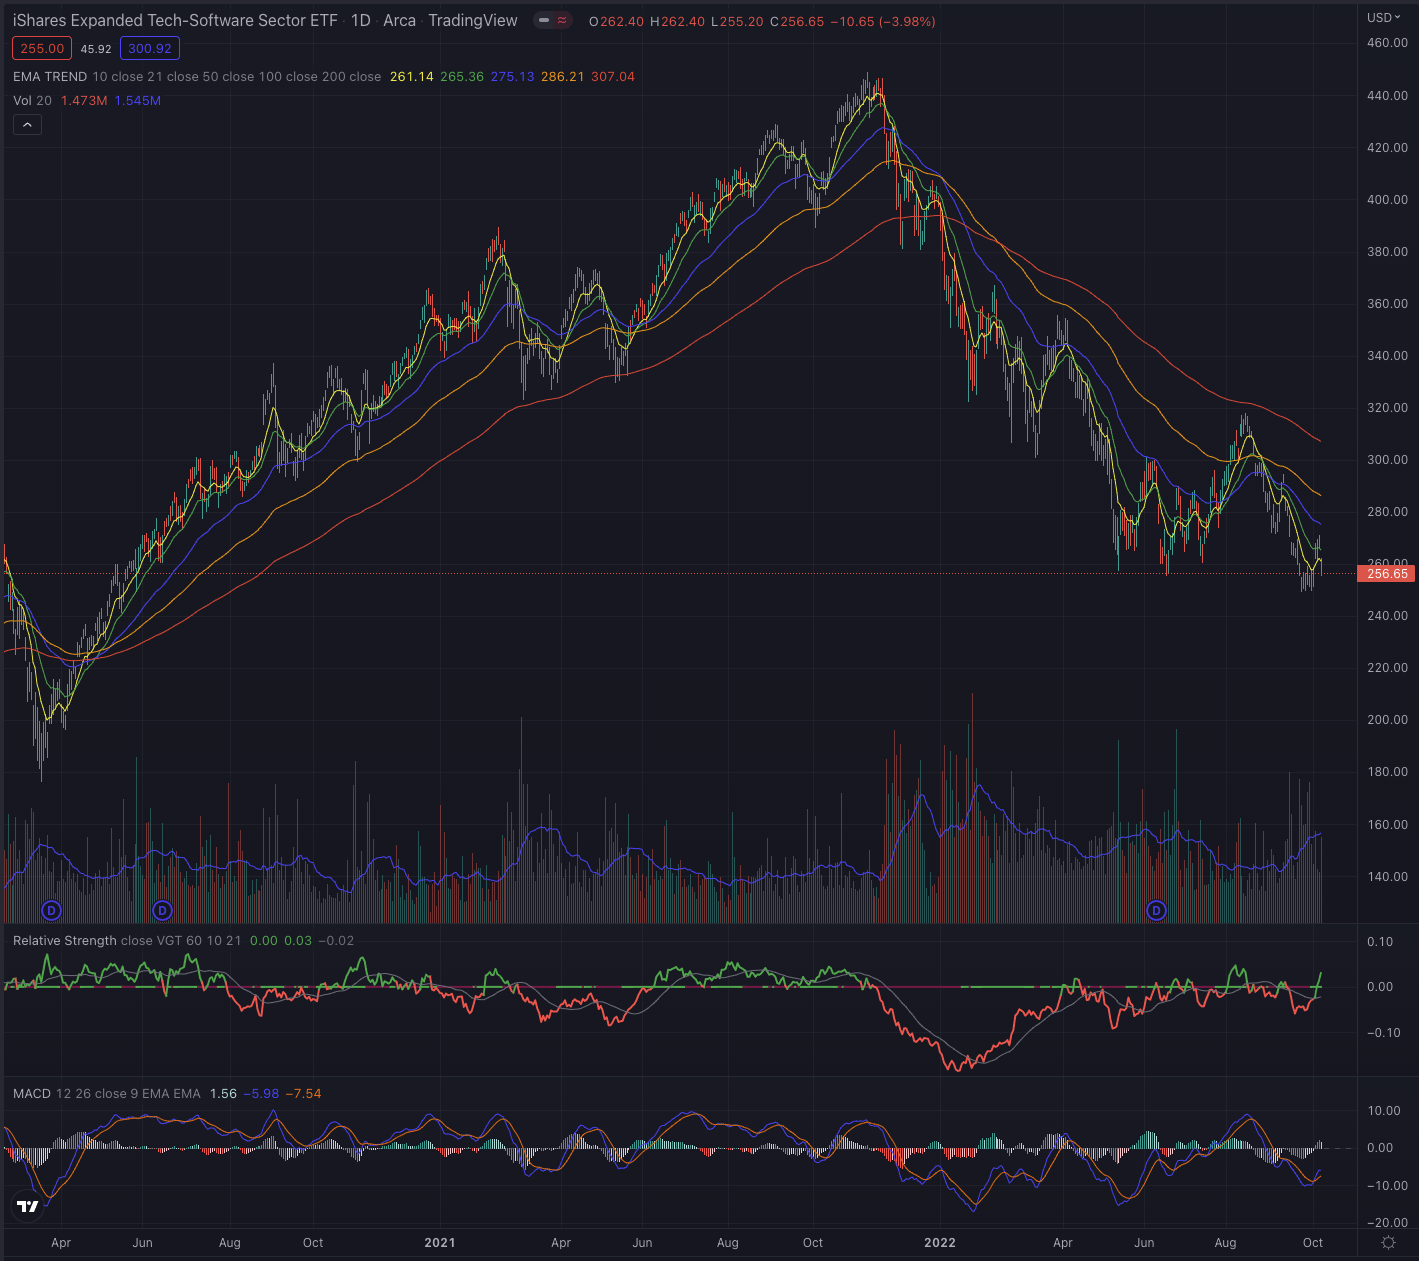
Considering closer the relevant industry, the iShares Expanded Tech-Software Sector ETF (IGV) marked its All-Time-High [ATH] on November 9, 2021, and has since severely corrected, losing 43%% until bottoming on June 16 and is since attempted to break out on August, but failed and got rejected close to its EMA200, dropping under the former bottom, and marking a new low at $249.40 on September 23.
Author, using TradingView
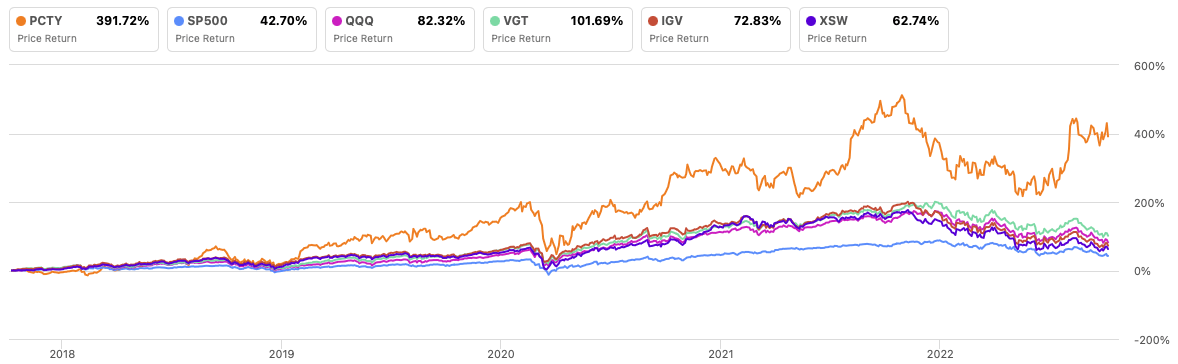
Looking back even further, Paylocity performed massively better than its main references, reporting a 391.72% performance in the past 5 years, while all its references underperformed the stock significantly. The broader Vanguard Information Technology ETF (VGT) could still report performance of over 100%, while more specific industry groups like the iShares Expanded Tech-Software Sector ETF (IGV) or the SPDR S&P Software & Services ETF (XSW) achieved a far smaller performance during the analyzed time.
Author, using Seeking Alpha
Where are we now?
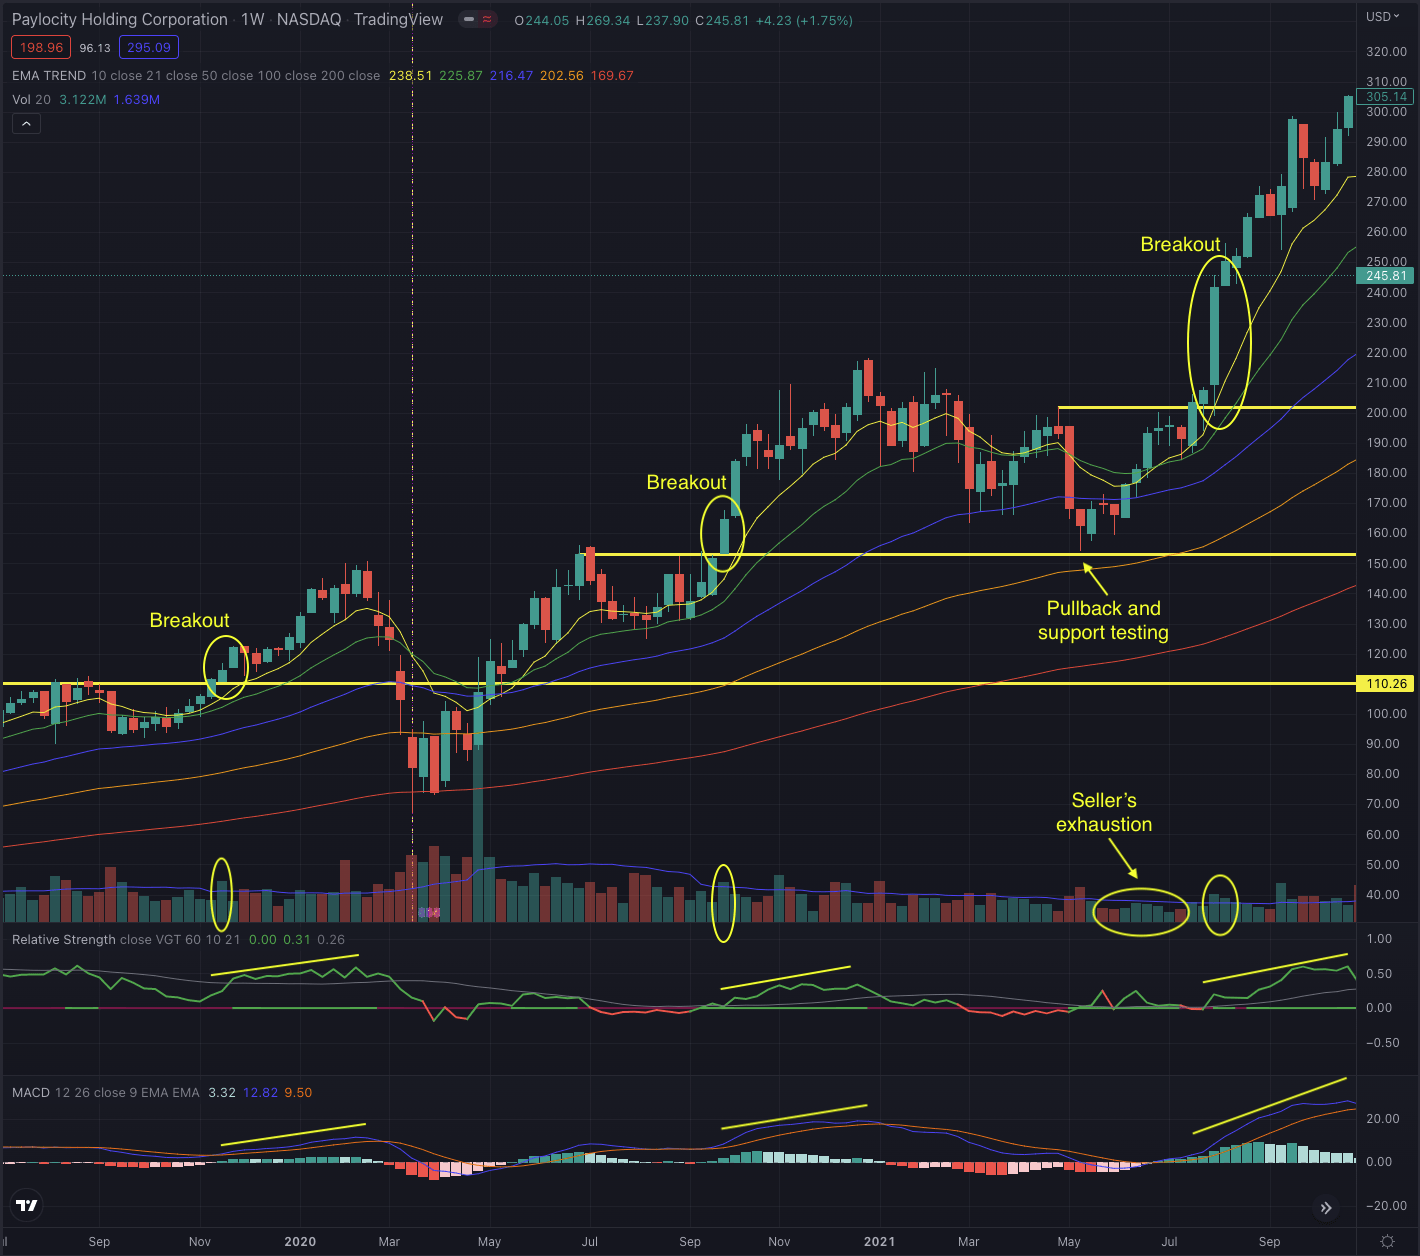
PCTY has been a great stock for momentum and short-term position traders, especially for those who consider breakouts as their investing strategy. The stock had three major breakouts since November 2020, which led the stock 185% higher. In the weekly chart below, every breakout can be identified by the same setup, with increasing relative strength, increasing momentum, and a significantly above-average volume. Also, the pullback and re-testing of the previous breakout level, like seen during May 2021, is typically a strong starting point for a significant leg higher.
Author, using TradingView
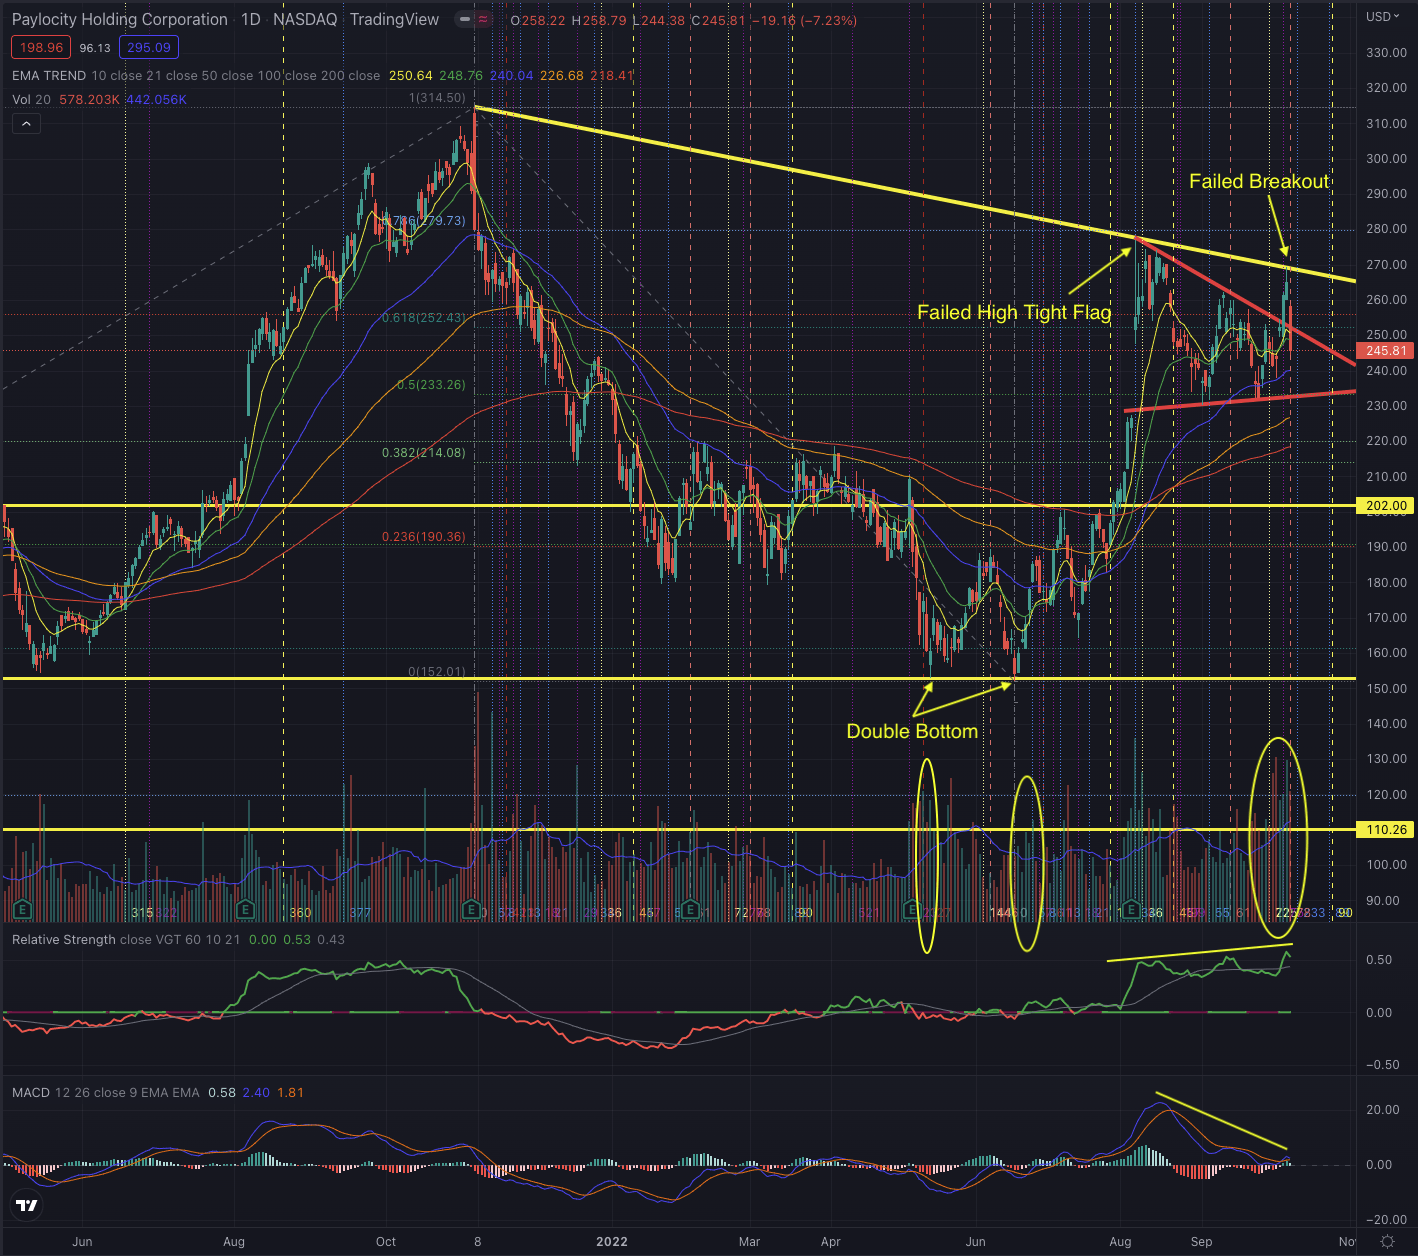
The stock has been very resilient and tested its EMA200 on a weekly scale only twice, during the pandemic crash, and recently between May and June 2022, as the stock formed a double bottom, from which it started a massive strong movement, that almost formed a High and Tight Flag, a very rare but very powerful situation that usually leads to even higher prices. PCTY failed in this attempt and has since formed a tightening 15-20% trading range from which it failed to break out on October 6, 2022, as the stock got rejected on high volume and lost more than 7% during the next trading session.
Author, using TradingView
Technically the stock is now in an insecure situation. Although it still shows a negative momentum and its MACD is struggling to reverse, the relative strength of the stock is at record levels and has been very resilient in the last two months. Looking at the volume, there have been multiple distribution days with massive sell volume, while it looks like there may also be a relatively high interest in the stock, which recently led to the breakout attempt. While the stock still seems in an uptrend and is priced over its EMA50 and massively over its EMA200, the increased volatility is a hint at more nervousness at the recent price levels, as the stock could form a new base, but the strong overhead resistance is also increasingly demanding for the investor’s risk tolerance.
What is coming next?
Paylocity has a very interesting trading profile and I added it to my watchlist because of the very strong breakouts it can form and because of the recent strength, it has shown, relative to the broader technology sector. I believe that the stock could further trade in its tightening trading range, offering 10-15% performance for short-term traders, while it is technically in a neutral position for mid-term oriented investors, as the stock is still in an uptrend and despite the recent pullback, it still shows significant relative strength, but failed twice in its breakout and is now rejected toward its next support.
Author, using TradingView
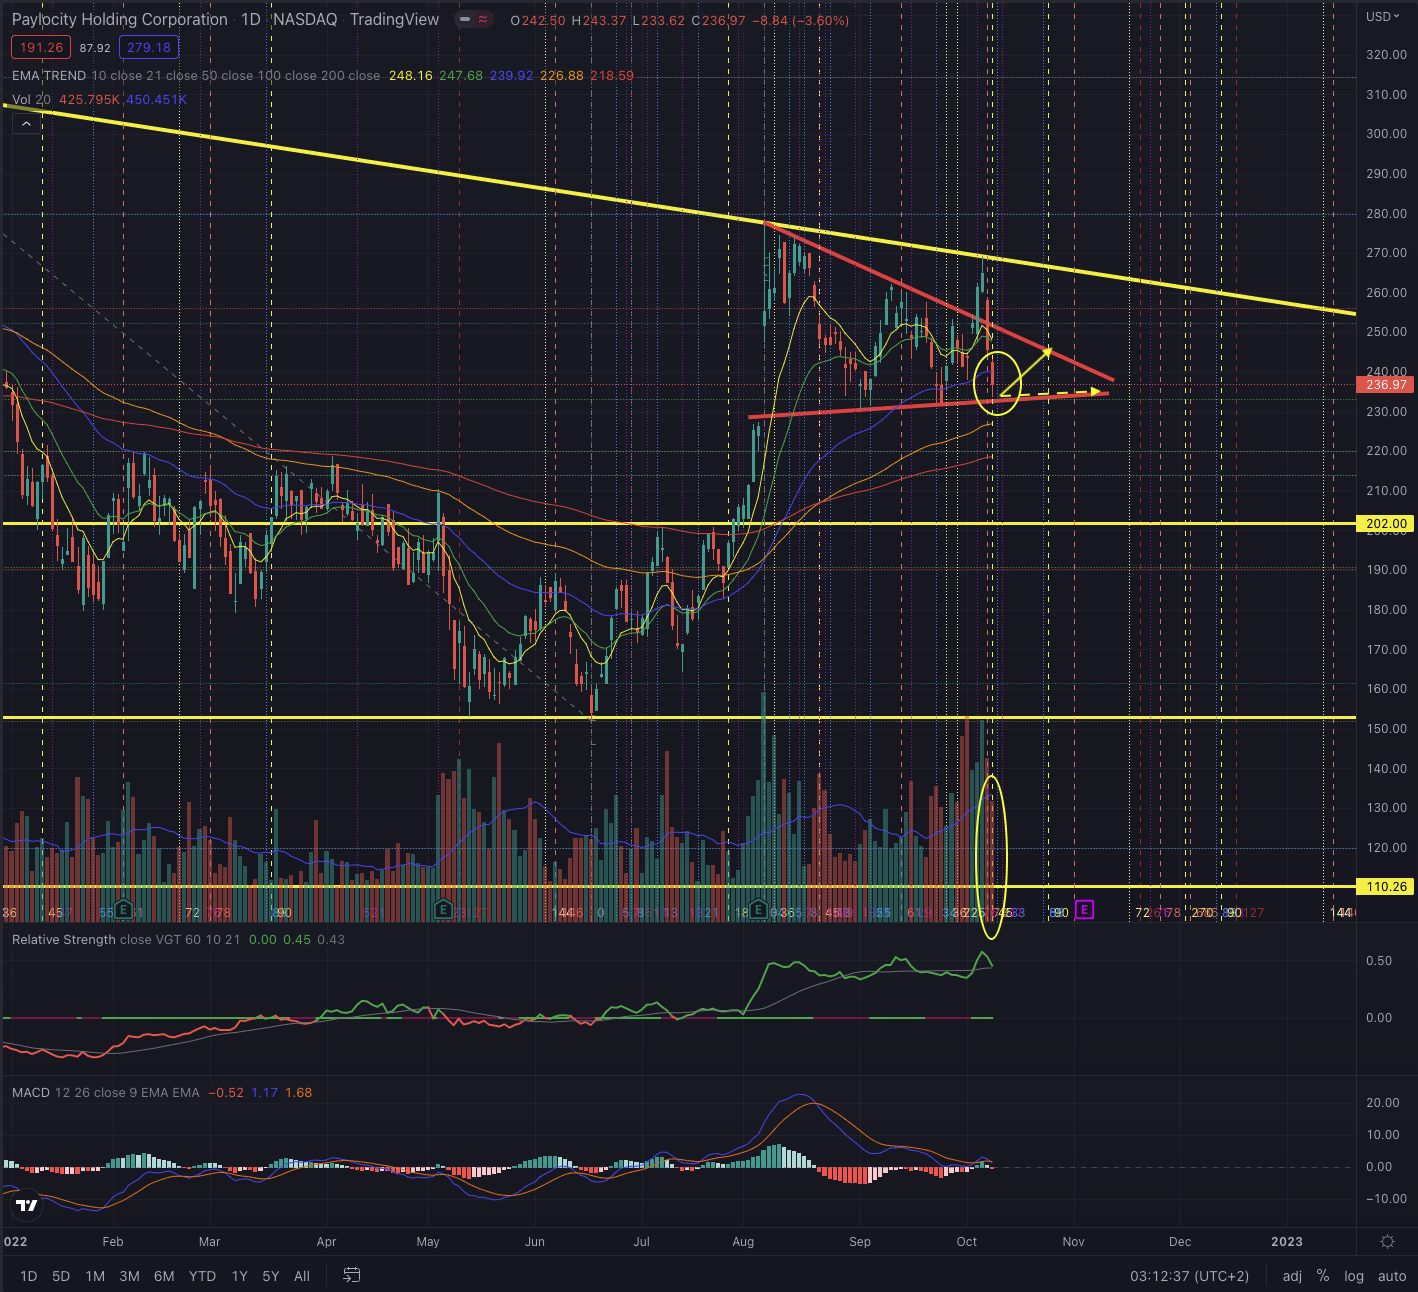
The stock rebounded on the tightening range floor in the last session, as it already did twice during September, while the volume dropped under its average. Investors should closely observe the price action and how the stock behaves at crucial support levels, and how an eventual attempt to overcome its resistance is confirmed or rejected, by particularly observing the trading volume in both directions. I would certainly consider the EMA50 as possible short-term support or resistance, and the bottom of the tightening range as being the limit of my exposure, as a drop under this significant support level would likely lead the stock further down until testing its EMA200, and probably even prices around $202. On the other side, the stock’s overhead resistance is formed by both the major trendline and the ceiling of the tightening trading range.
This is a fascinating situation from a trading perspective, as the stock could be in front of a new major breakout situation, from where it could continue to outperform and try to reach its ATH at $314.50, offering potentially over 30% performance in the short-term, while it could also take longer to form a sound base as the stock failed twice in its breakout attempt and both occasions have been severely sold off and pulled back significantly.
The bottom line
Technical analysis is not an absolute instrument, but a way to increase investors’ success probabilities and a tool allowing them to be oriented in whatever security. One would not drive towards an unknown destination without consulting a map or using a GPS. I believe the same should be true when making investment decisions. I consider techniques based on the Elliott Wave Theory, as well as likely outcomes based on Fibonacci’s principles, by confirming the likelihood of an outcome contingent on time-based probabilities. The purpose of my technical analysis is to confirm or reject an entry point in the stock, by observing its sector and industry, and most of all its price action. I then analyze the situation of that stock and calculate likely outcomes based on the mentioned theories.
Paylocity has been a strong leader in its industry over the past five years and has recently shown significant relative strength while the broader technology sector performed much worse. The redundant breakouts in the past 3 years were great opportunities for investors and despite past performance is not a guarantee for future results, it shows that there is significant interest in the stock, as institutions own almost 74% of the company’s free float. From a strictly technical perspective, the stock is now in a neutral position, with a tendency to be a buy position for more risk-tolerant investors, as it is seemingly in a strong uptrend and could likely break out of its actual resistance levels, and form another leg toward its ATH. I would tend to wait and buy the stock on a breakout or buy the first position if the stock confirms the support level, as the trading range could offer some trading opportunities while the stock builds up its next base. A drop under the mentioned support levels should not be ignored and I would set my contingency plan accordingly.
Be the first to comment