

Andrew Burton/Getty Images News
I last mentioned Paramount Global (NASDAQ:PARA) as a takeover/merger candidate for Netflix (NFLX) in February here. Situated as the least expensive major entertainment concern in America, a number of streaming, television, and technology companies could be interested in acquiring Paramount. And, investors seem to be heeding my call to take a serious look at Paramount’s unique value. Believe it or not, Paramount’s stock quote has been the leading Big Entertainment choice for performance since my story posted.
Netflix is now facing extreme competitive pressures in streaming, and has been the most logical Paramount suitor for years. However, in my opinion, it appears management arrogance about changes taking place in the marketplace is hurting shareholders in 2021-22, as its overvalued share price has cratered 50% from last year’s peak quote. I personally think NFLX is dead money for investors without a push into advertising-supported revenue sources and/or a big increase in new programming options (both conditions would be addressed with a Paramount merger). The large monthly subscription price hike this year was a desperate move to squeeze existing members for cash to develop new shows in-house, as headcount growth stalls in 2022-23.
For Paramount, management has decided to invest even more money into new programming, an effort to grow Paramount+ streaming and its free to consumers Pluto TV (cable-killing) offering even faster. The good news for shareholders is Wall Street has been noticing and rerating the stable income generation of the business. Plus, analysts are now interested in the potential for higher sales growth, which has been the one variable holding back upgrades and investor buying volumes. At this stage, streaming leaders from Netflix (NFLX) to Roku (ROKU), Amazon (AMZN) and Apple (AAPL) may be able to integrate Paramount’s legacy CBS television network and huge media content library into their own business models successfully.
According to the Paramount website,
Our powerful and unique portfolio of network, studio, and streaming brands entertain, inform and empower audiences. Our brands are #1 in key U.S. target demos, including total audience, kids, adults, African-Americans and Hispanics. We have a global reach of more than 4.3 billion subscribers across more than 180 countries.
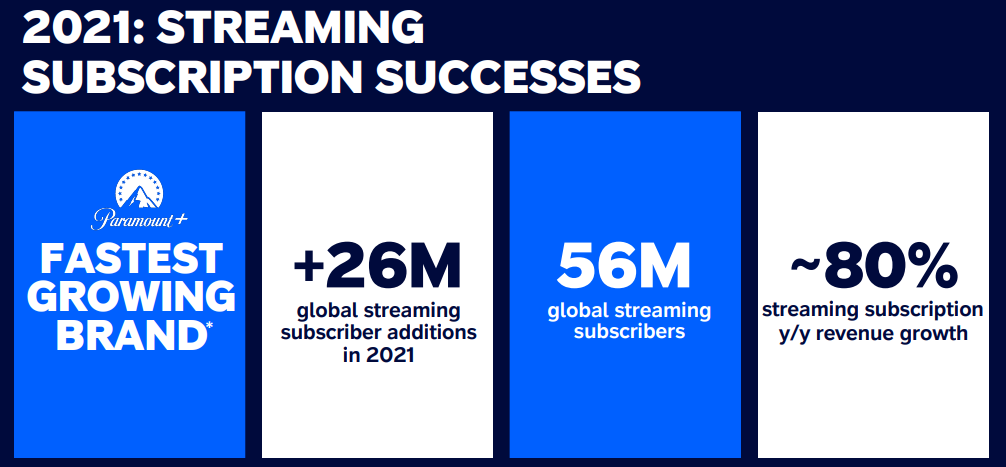
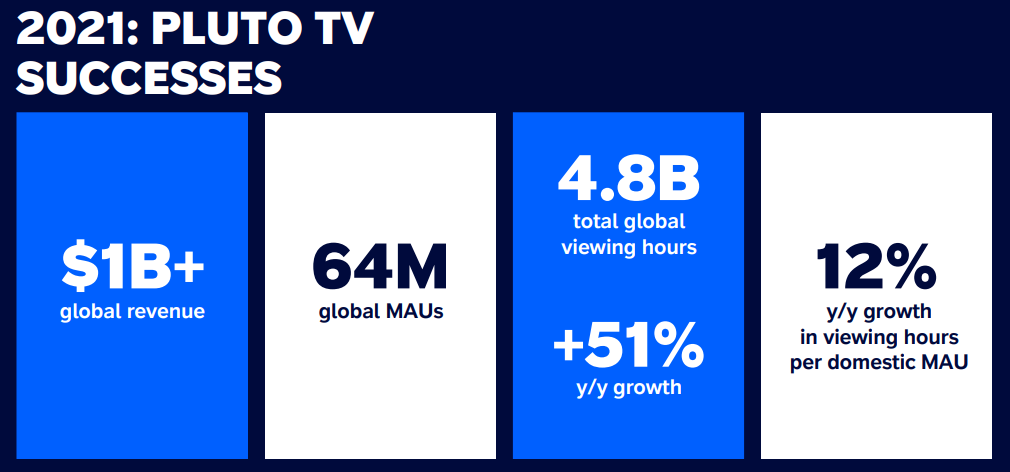
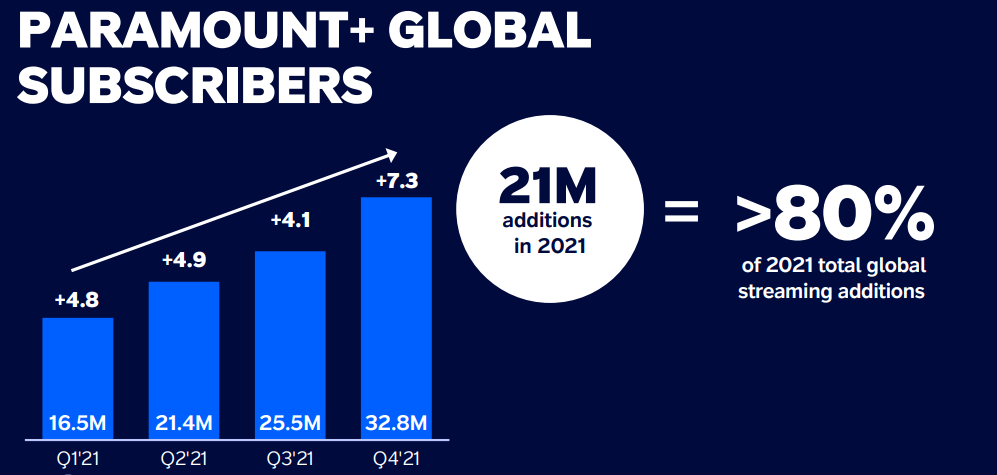
Company Assets – Q4 2021 Earnings Presentation Q4 2021 Earnings Presentation Q4 2021 Earnings Presentation Q4 2021 Earnings Presentation
Below is a table showing how the reinvestment plan into new programming, with a goal of expanding its movie and television library, has downshifted EPS estimates over the short-term while increasing sales projections. Before January, analysts were calling for flat EPS around $4 per share, with almost no revenue expansion into 2024. Even with the small hit to earnings this year and next, valuations are still incredibly low versus peers and competitors. I am modeling faster debt paydowns with asset sales like the bookmaker Simon & Schuster currently on the block, alongside minor share buybacks could generate numbers far better than pictured.
Seeking Alpha Table – April 16, 2022 Analyst Consensus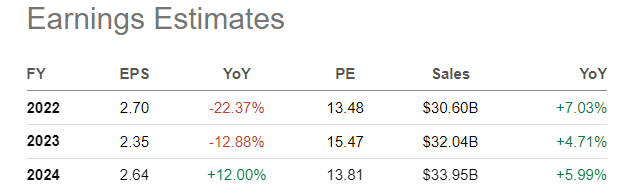
Absurd Valuation
Using trailing 2021 statistics and metrics, Paramount remains the cheapest large-cap entertainment company. Including a variety of related sectors from gaming to streaming, television, music, and movies, PARA stands out as a bargain buy idea.
When we add together equity and debt totals for each enterprise, Paramount is a better fundamental buy upfront for investors than Walt Disney (DIS), Netflix, Sony Group (SONY), Activision Blizzard (ATVI), the old Discovery setup now Warner Brothers Discovery (WBD), Fox (FOXA) (FOX), Spotify (SPOT), Warner Music (WMG), Roku, Facebook/Meta Platforms (FB) or Alphabet (GOOG). The same can be said vs. other giants with smaller net entertainment division sales not pictured like Microsoft (MSFT), Apple, Comcast (CMCSA) and Amazon, plus many minor gaming, streaming and entertainment names.
Comparing apples-to-apples for cash generation on total debt/equity worth, enterprise value to earnings before interest, taxes, depreciation and amortization is amazingly cheap in early 2022. Trading at an EV to EBITDA multiple of 5.4x is well under the 9.4x median average for the group listed, and a monster discount to the equivalent 16x ratio for the S&P 500 index of blue-chip alternatives outside of entertainment.
YCharts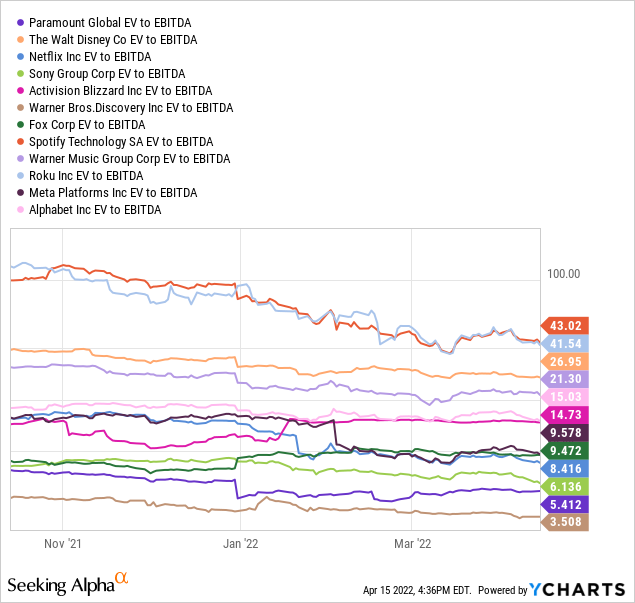
The value proposition looks equally positive on underlying sales. 1.2x trailing sales is an extremely low number vs. peers with a 3.9x median average. The S&P 500 is trading closer to 3x underlying operating revenues today.
YCharts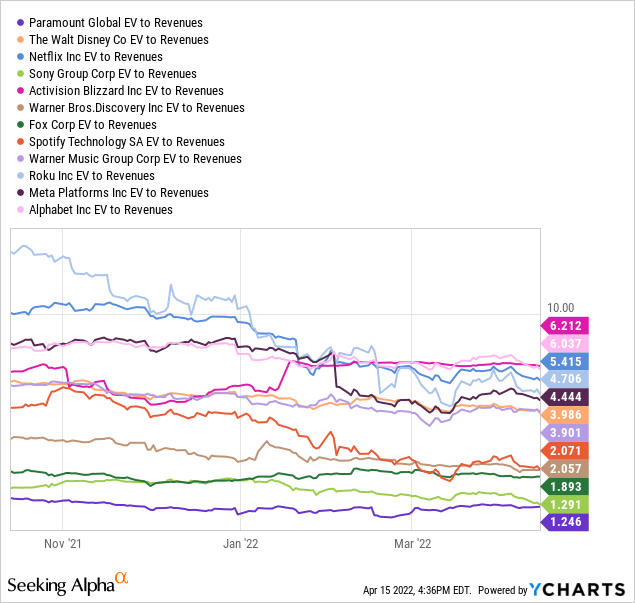
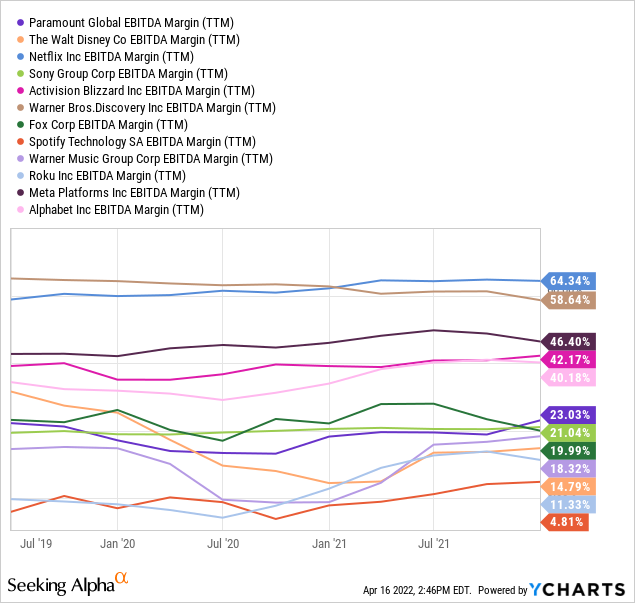
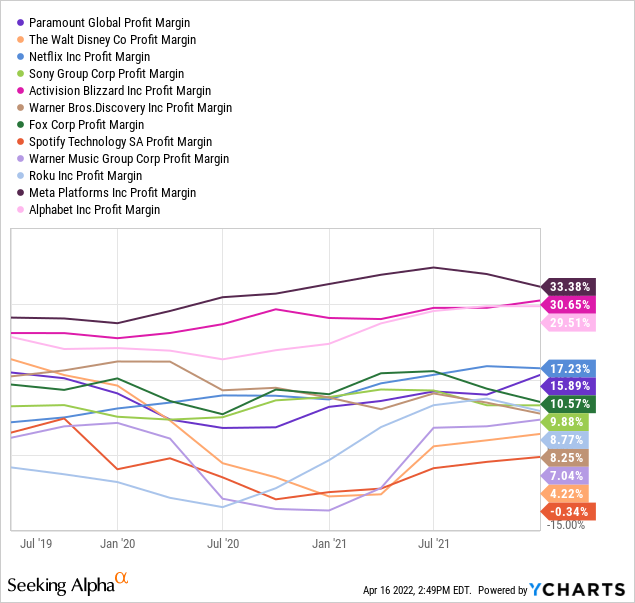
You would think Paramount runs a weaker-margin business model than the peer group to justify its subpar valuation, but that is not the case. While operating margins are in the middle of the group, EBITDA and final after-tax margins are in the top half of the range vs. competitor results.
YCharts YCharts YCharts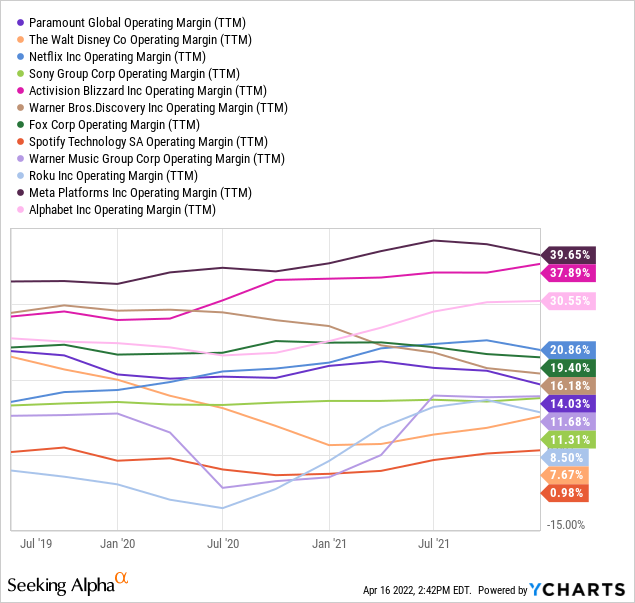
Another huge bonus for Paramount investors is it now provides the highest dividend yield in the group for new buyers and those focused on regular quarterly income. The 2.6% annual cash distribution rate is easily sustainable with earnings coverage at 3x and a normalized cash flow ratio of 5x the payout. The dividend yield is double the S&P 500 equivalent around 1.4%, and greater than most of the fixed-coupon Treasury market yield curve.
YCharts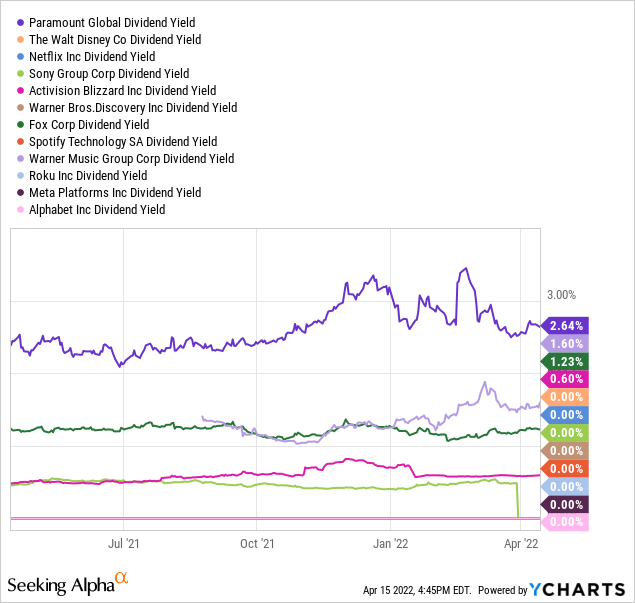
Upside Momentum Building
Since my article in early February describing Paramount as an excellent buyout candidate, its stock quote has significantly outperformed a down-sloping condition for the majority of U.S. equities. PARA has outlined a positive +7.8% total return gain, while the whole entertainment peer group has struggled with losses.
YCharts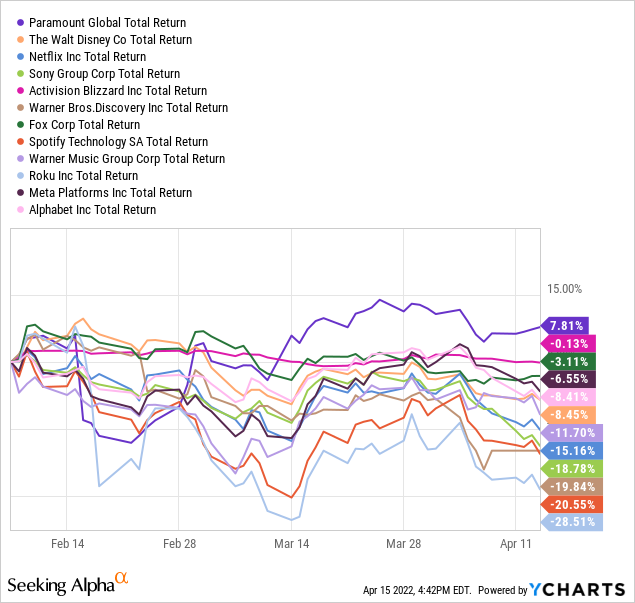
Outside of the Activision Blizzard takeover bid by Microsoft in January, Paramount has also been the strongest performer for investors over the last six months. If you do not follow PARA on a daily basis, you may not be aware of its relative strength trend or the rising wave of buying interest.
YCharts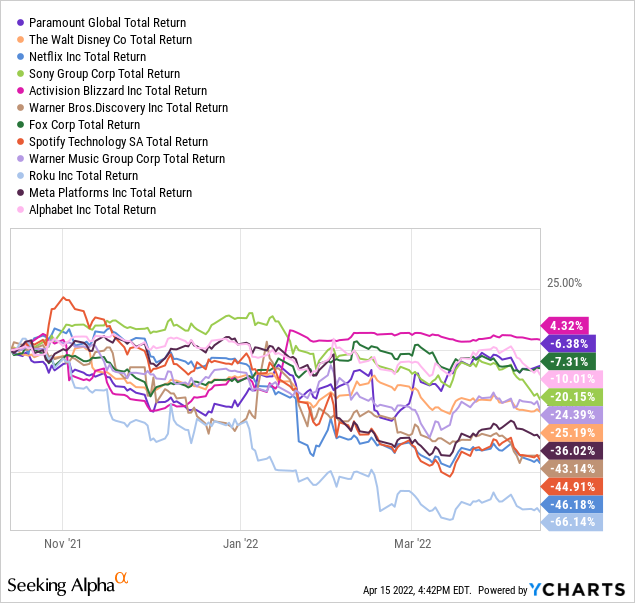
On the 12-month chart of daily price and volume changes below, you can review the sharp reversal from selling to buying in Paramount that occurred in February. Not only has price recaptured both the important 50-day and 200-day moving averages during a bear market generally on Wall Street, but a variety of momentum indicators are signaling the turnaround is real.
The clearest change has been in the Chaikin Money Flow indicator. It is a combination of regular Money Flow creations with another calculation similar to the Accumulation/Distribution Line thrown into the mix. Basically, the formula exaggerates Money Flow numbers as a function of where a stock closes inside its price trading range each day. High volume with closes near the top of the daily range are the most positive development, in a nutshell. The 20-day average CMF turned extremely positive right at the February bottom in price, and has remained super-bullish for months.
Other positives include a nice uptrend in the Negative Volume Index, one of my favorite indicators. Plenty of buying interest has been apparent on slower news, low volume days. Lastly, scores near or under 15 on the 14-day Average Directional Index (low volatility readings over many weeks) that coincide with price trending above 50-day and 200-day moving averages are often a precursor to much stronger price action in the next 3-6 months. Conversely, low ADX readings on sliding price are a relatively bearish development. July to November 2021 for PARA is one example of this negative setup.
StockCharts.com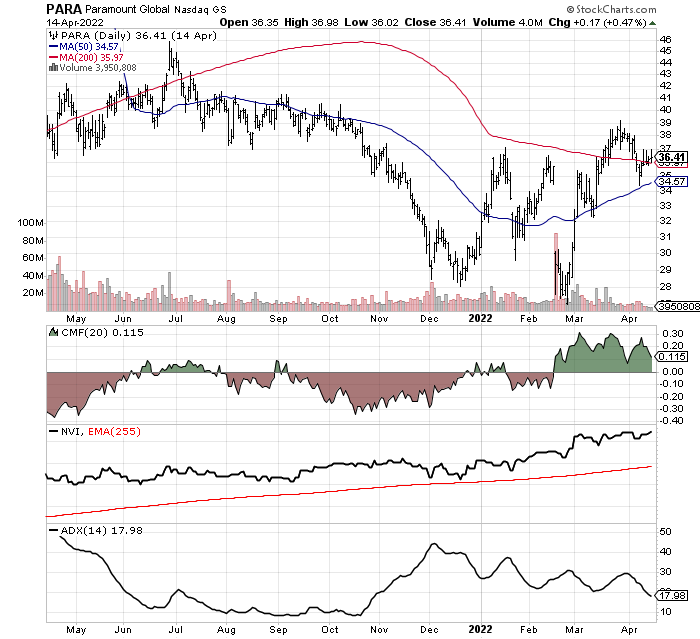
Looking at seasonal patterns over the past decade, the best time of the year to own Paramount statistically is between May and July (boxed in green below). This 3-month span has proven the most productive for price gains. While this is far from a guarantee of rising quotes soon, it adds more color to the bullish proposition over the next 12-14 weeks.
Author Reference Point, StockCharts.com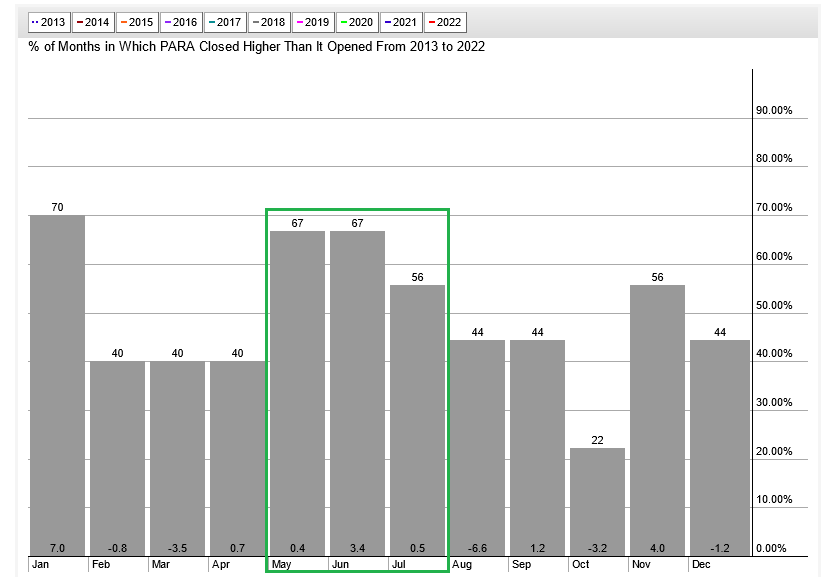
Final Thoughts
I have been long Paramount Global for several months. The bullish combination of low valuations and improving momentum could lead to sharply higher quotes sooner or later. In addition, the decent odds of a takeover bid during 2022 could produce solid profits overnight for prudent, patient investors.
Extra buying fuel is still on the sidelines and easily identifiable in Paramount. With a share price the same as years ago and sales somewhat stagnating, short sellers feel this name is a reasonable bet to drop over time. If the prevailing sentiment on PARA changes for the better, literally billions of dollars in pent-up buying interest could show up during 2022 in the form of shorts covering their bets. Again vs. other giants in the entertainment industry, Paramount stands out as having the best setup for a short squeeze similar to the early 2021 explosion in price (from $26 in October 2020 to $99 in March 2021).
YCharts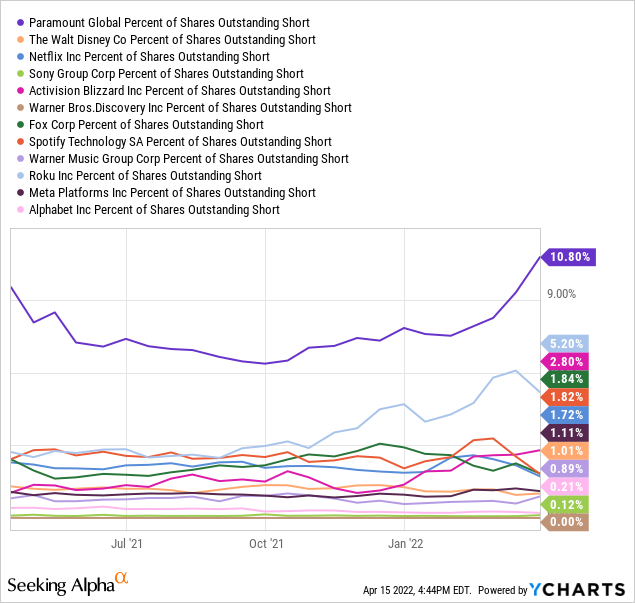
What are the investment risks? The biggest downside to Paramount shares would come either as the result of a slowdown in advertising revenue during an economic recession in America or a truly weak period on Wall Street generally for all equities. Both are macroeconomic risks to contemplate that could affect the whole peer group, not just Paramount Global.
Really, management is making the right operating moves from my vantage point. A reduction in total debt and some share buybacks would be my suggestions to financially engineer a higher equity quote. Over time, I expect investors will take notice of the rapid growth in streaming eyeballs and revenues. On a forward basis, earnings and cash flow will be slightly lower than I expected at the beginning of the year. But this is the “cost” of getting revenue growth and streaming numbers to higher levels quickly. To me (and others), this is a fair tradeoff if future income benefits from greater economies of scale and improving margins after 2023.
I have a Buy rating on the stock at $36 per share, with an upside target range of $50-60 by the end of 2022. The best-case investment scenario is a takeover bid of $60+ arrives soon. My work puts potential worst-case scenario downside to $25 this year. So, risk/reward analysis ranging from a theoretical -25% to +70% return currently argues in favor of ownership.
Thanks for reading. Please consider this article a first step in your due diligence process. Consulting with a registered and experienced investment advisor is recommended before making any trade.
Be the first to comment