

RiverNorthPhotography/iStock Unreleased via Getty Images
Brick-and-mortar restaurants felt the disruptive impact of the pandemic. But, Papa John’s International, Inc. (NASDAQ: PZZA) remained unfazed. Now, it sees more sprinkles of hope as restrictions ease and its expansion continues. Its revenue growth, s,cash inflows, and store openings are in line with its expansion. But, investors must take a moment and find a better entry point before making a position.
Company Performance
Papa John’s International, Inc. proves its resilience, given its continued rebound. The operating revenue amounts to $543 million, a 6.1% year-over-year growth. North America and international branches have the most impressive revenue growth. Thanks to its consistent and strong momentum to innovate and expand its operations. Franchisees also show more robust performance with their increased investments in PZZA.
Operating Revenue (MarketWatch)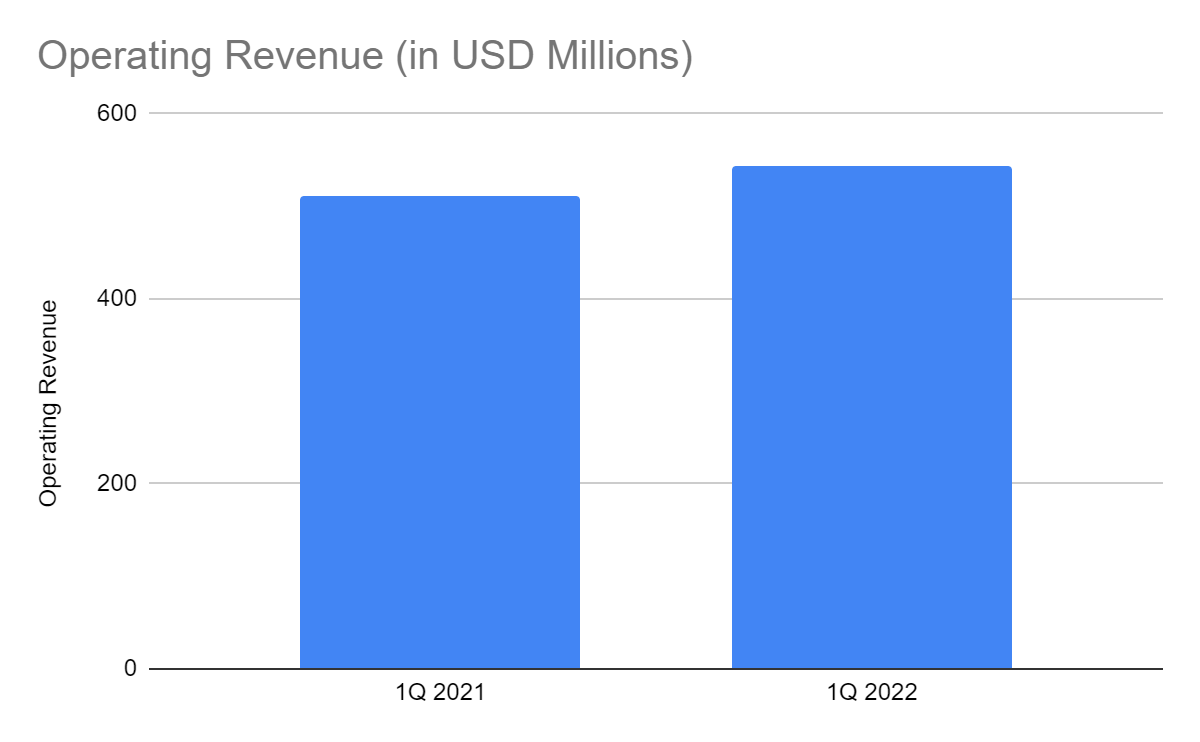
Likewise, there is an upsurge in costs and expenses. This part is logical, given its continued expansion. For example, it expanded into Kenya and Nigeria with its new franchise partner, Kitchen Express LTD. It plans to open at least fifty restaurants, which may bring more returns to the company. It also made a franchising agreement with Sun Holdings. Inflationary pressures also raise the prices of raw materials and ingredients. Along with it is the suspension of its operations in Russia amidst the geopolitical uproar. As such, the operating margin drops to 26%. Even so, the fact that it has higher revenues amidst store closures in Russia is a plus.
Operating Margin (MarketWatch)
Papa John’s is well-positioned as its increased restaurant openings are timely and strategic. Also, it has a scalable and ideal business model. Its business is divided into three major segments namely restaurant, franchising, and commissaries. Its North American franchising supports the branches in the US and Canada. Meanwhile, international franchises are in other countries outside North America, such as the UK. Royalty, franchise fees, and rights are collected from these franchises. But, commissaries comprise the largest portion of revenue at 53%. Thankfully, all segments have shown revenue growth this quarter.
Also, note that a large portion of its restaurants is franchised. With that, costs and expenses are more manageable, which is more crucial amidst inflation. Company-owned restaurants are more labor and capital-intensive unlike managing franchises. Income appears to be more stable. What makes the company secure and robust is that franchisees are the ones to secure places. Of course, franchisees know which part of the area is best for opening a store. PZZA does not have to see and study the location for itself, which is costlier and time-consuming. With more than fifty percent of franchisees, it receives royalty and initial fees. The initial costs for starting a business are shouldered by franchisees. That is why expansion is more lucrative and has moderate capital intensity.
If we compare it to other restaurants, Papa John’s is within the average when it comes to revenue growth. But of course, its closest peers are Domino’s Pizza (DPZ) and Yum! Brands (YUM). The latter is the parent company of Pizza Hut. PZZA is one of the main pizza chain businesses in the US. Its market share of 3.9% is unchanged compared to the comparative quarter. It just shows that it keeps up with the competition and moves along the industry uptrend.
Market Share (MarketWatch)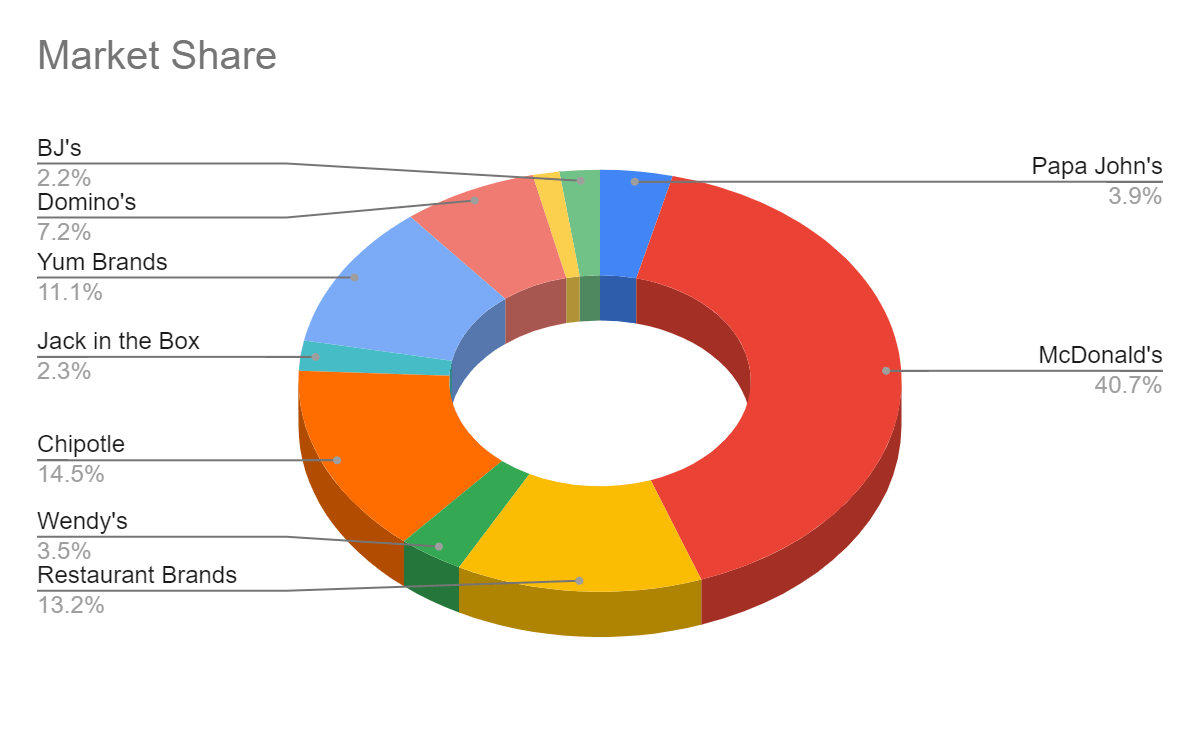
Why Papa John’s May Accelerate
Papa John’s is consistent with its expansion. Right now, there are 5,524 vs 5,468 restaurants in 49 countries. With its strong development momentum and restaurant openings, expansion persists. Its impressive performance allows it to increase its restaurant opening outlook to 1,400-1,800 by 2025. It will be a sagacious move, given the excellent business model it has to maximize.
How Many Restaurants It Has (1Q Financial Report )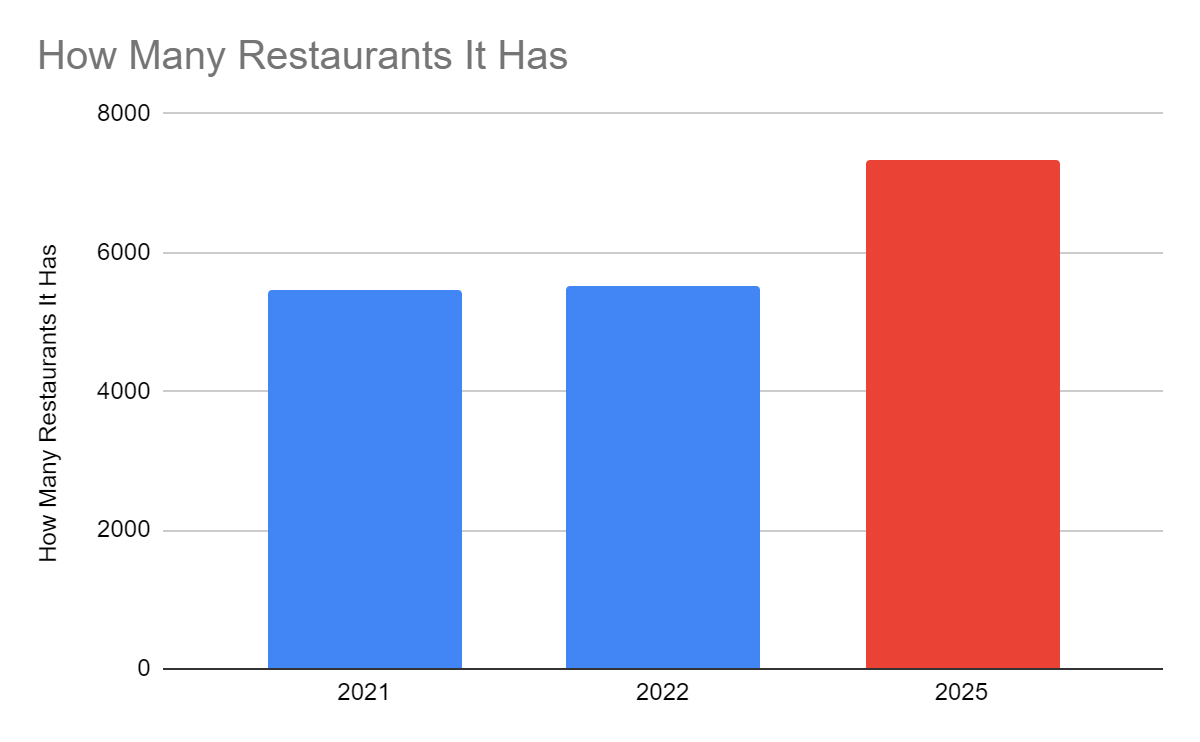
Also, it appears timely and relevant as the restaurant industry continues to flourish. Recent statistics show that every American spends $1,200 on fast food on average every year. Overall, Americans spend $200 billion on fast food. The same study projects that the spending will increase by 2.2% every year. That is why the market size of the QSR industry may range from $900 million to $1 billion.
American Fast Food Spending (Budget Branders)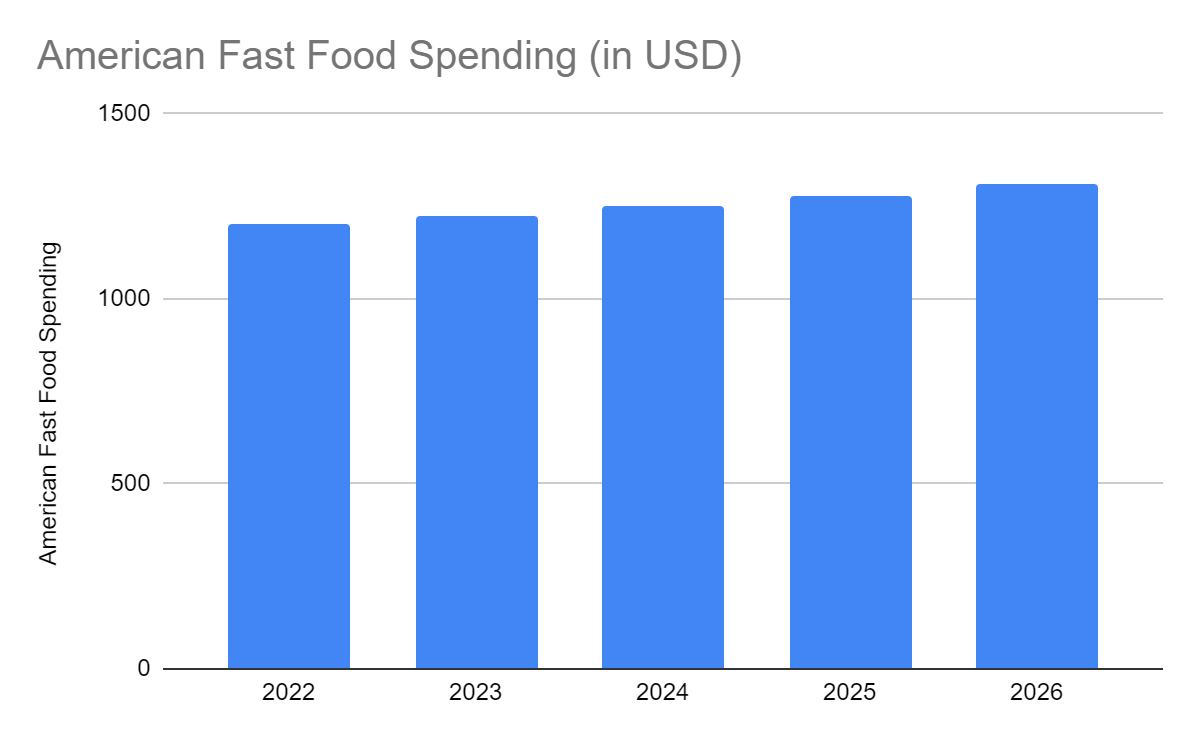
Fortunately, PZZA is keeping up with the market trend. But the more important thing is that it has adequate capacity to do so. If you see the operating cash flow, it is enough to cover CapEx. The FCF of $15 million can cover dividend payments. Only, the operating cash inflows are lower than in 1Q 2021. But we can also see why it decreased. First, the company continues to expand, which is shown by the working capital. There are cash outflows from receivables, inventories, and other operating assets. CapEx is also higher by 44% due to increased restaurant openings. Also, it paid its operating liabilities, mainly accrued expenses and other current liabilities. These may often include liabilities related to utilities, labor, and other payables.
Cash Flow From Operations and CapEx (MarketWatch)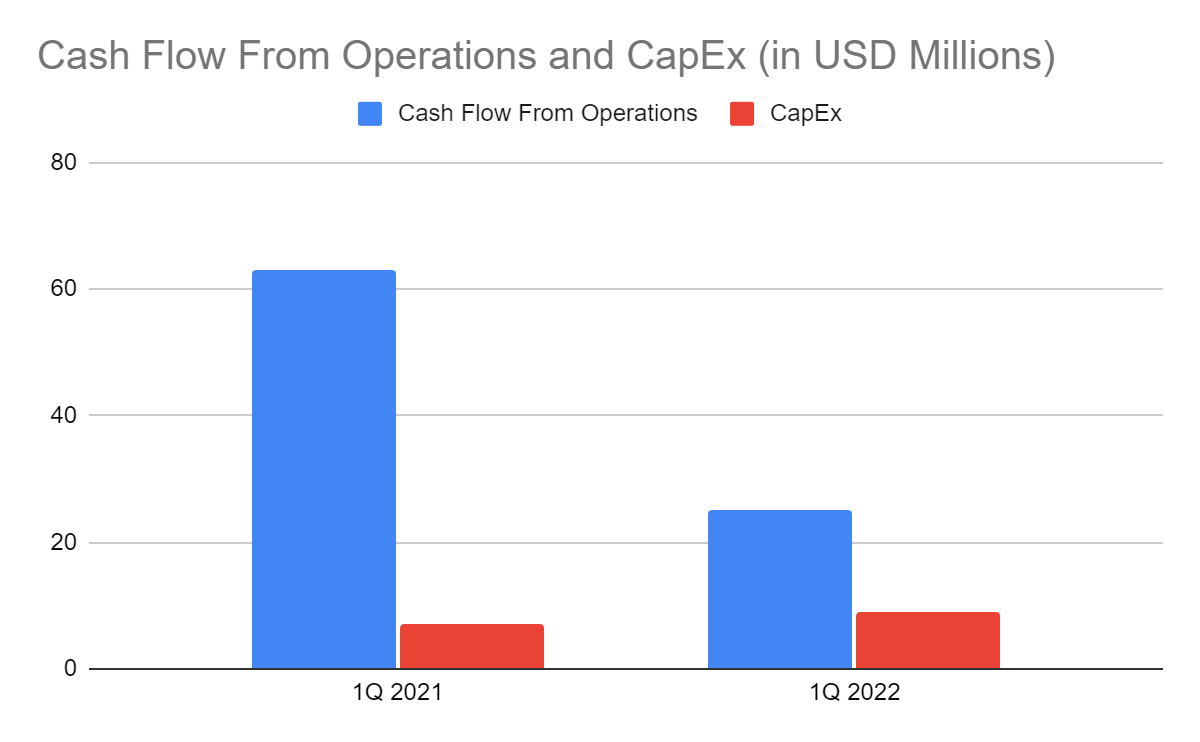
If we verify it in the Balance Sheet, cash and cash equivalents are less than half the previous value. But, there is a substantial increase in inventories, receivables, and PPE due to expansion. Meanwhile, borrowings and accrued expenses and other liabilities decreased by 8% and 18%. Note that PZZA made a $400 million senior notes offering in 3Q 2021. From there, we can say that as the company expands, it also manages its financial leverage well.
Cash and Cash Equivalents and Borrowings (MarketWatch)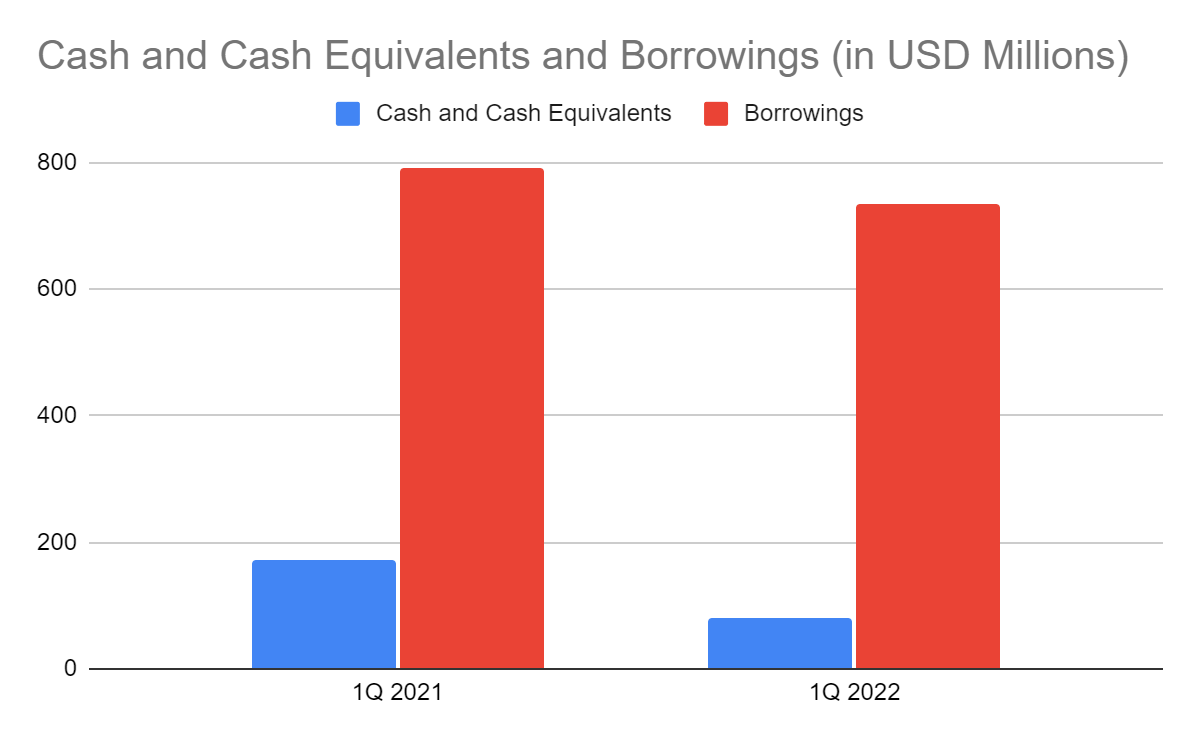
Stock Price Assessment
The stock price of Papa John’s International, Inc. has been decreasing since the latter part of 2021. At $83.84, it has already been cut by 37% from the starting price. Yet, price metrics do not show that the stock price is a good bargain. There is potential overvaluation as shown by the P/CF and EV/EBITDA Ratio. Its peers also appear to be above the fair valuation.
P/CF Ratio and EV/EBITDA (Yahoo Finance)
Meanwhile, it may be an ideal dividend stock. It did not increase its dividends in 2018-2020, but payments were consistent. Also, it had an average dividend growth rate of 9.7% in recent years. The largest was in 2021 at 35%. The dividend yield of 1.7% is lower than the S&P 400 of 2.14%. But it is higher than the NASDAQ component of 1.51%. Even better, it FCF is enough to cover borrowings. We may assess the stock price using the DCF Model and the Dividend Discount Model.
- DCF Model
- FCFF $124,000,000
- Cash and Cash Equivalents $81,000,000
- Borrowings $735,000,000
- Perpetual Growth Rate 4.8%
- WACC 9%
- Common Shares Outstanding 35,675,000
- Stock Price $83.84
- Derived Value $73.14
- Dividend Discount Model
- Stock Price $83.84
- Average Dividend Growth Rate 0.09725490196
- Estimated Dividends Per Share $1.40
- Cost of Capital Equity 0.1139533752
- Derived Value $74.99385098 or $74.99
Both models show that the stock price of PZZA is not cheap yet. There may be an 11-14% upside in the stock price in the next 12-24 points. So, investors must watch out for it.
Bottomline
Papa John’s International, Inc. is a robust and well-positioned company. It has adequate capacity to sustain and speed up its expansion and dividend payments. Also, it is an ideal stock, given its bullish potential and consistent dividend payments. But, investors must wait for a better entry point at $74-$76 before making a position. The recommendation, for now, is that Papa John’s International, Inc. is a hold.
Be the first to comment