

Michael Vi/iStock Editorial via Getty Images
Price Action Thesis
Palo Alto Networks, Inc. (NASDAQ:PANW) has been a massive winner for investors over the past five years, with a 5Y CAGR of 30.17%, despite its recent steep sell-off. As a result, it easily outperformed the Invesco QQQ ETF’s (QQQ) 5Y CAGR of 15.17%, driving significant alpha for its investors.
We urged investors to be cautious in our early April article as we revised our rating from Buy to Hold, given its significant run-up. It then formed a double top bull trap in mid-April even as Street analysts upgraded PANW before that. The market has astutely set up the trap, drawing in overly-optimistic buyers.
The market then forced a rapid liquidation in PANW stock over the next four weeks before forming a validated bear trap in May, as it reported a robust FQ3 card.
However, even though the bear trap has helped undergird its near-term support, we are not convinced that the sell-off is over. Notably, the stock has struggled to maintain positive flow (decisive bullish momentum). Moreover, a bull trap formed subtly in June, as the market rejected further buying momentum from its May bear trap.
Our reverse cash flow valuation model indicates that PANW stock could underperform at the current levels. Consequently, we believe the digestion from its double top is not over, and investors are urged to remain patient.
As such, we reiterate our Hold rating in PANW stock.
PANW – Massive Double Top In April Ended The Party
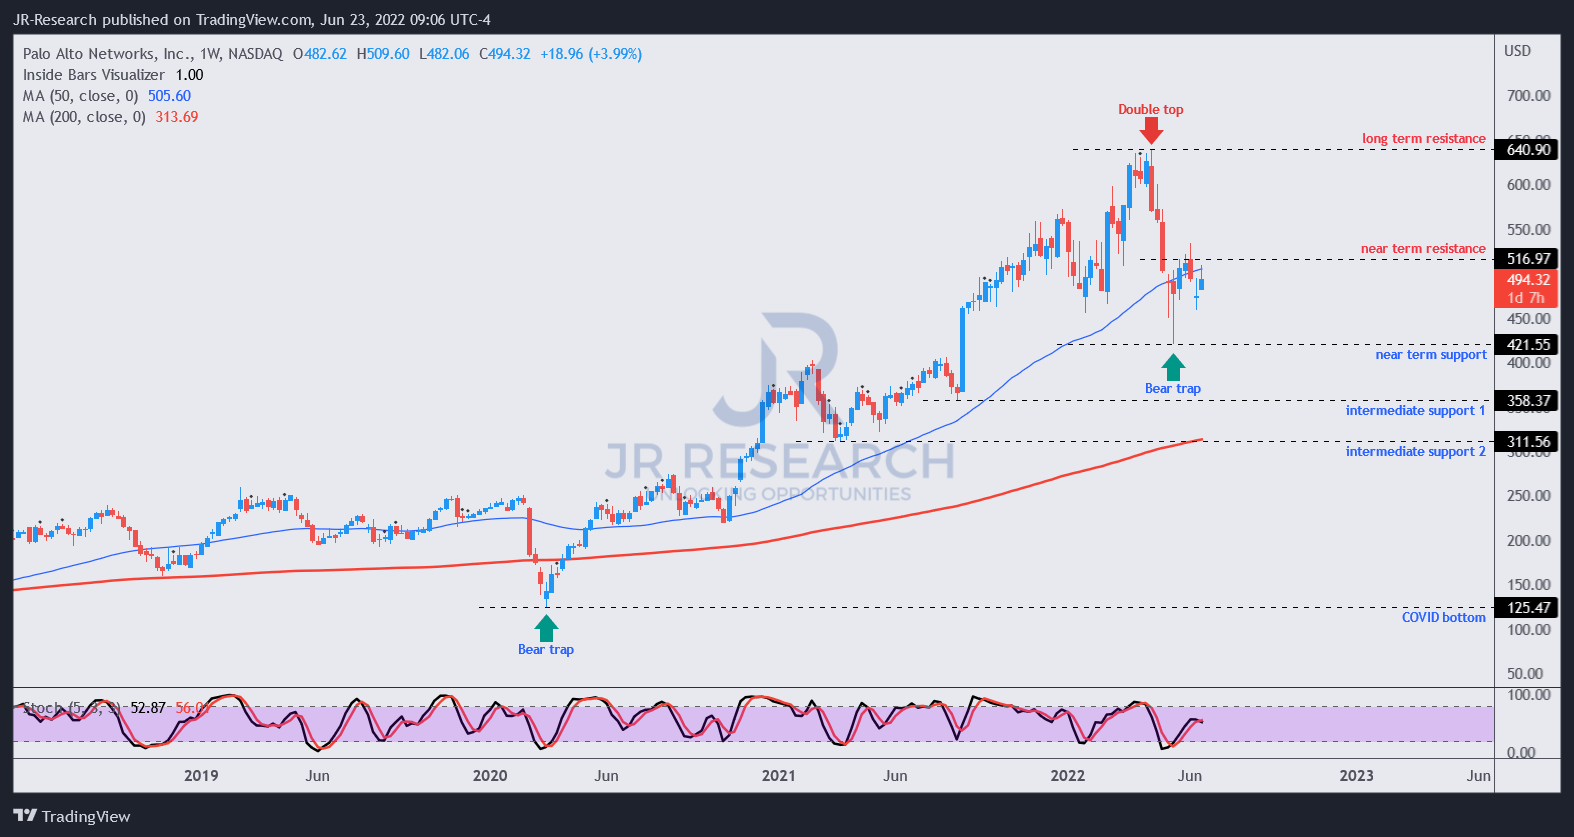
PANW price chart (TradingView)
After we revised our rating to Hold in April, PANW formed a potent double top bull trap that sent it tumbling 34% to its May bottom. However, street analysts were also bullish in April as BofA (BAC) upgraded PANW’s price target (PT).
But, the market set up the double top astutely in mid-April, as it pummeled investors who were drawn into those analysts’ upgrades. Subsequently, PANW went into a rapid liquidation over the next four weeks before forming a validated bear trap in May, as seen above.
Investors should note that we often urge caution even after a double top, given its potency and early warning signs of a significant reversal in trend. Notwithstanding, the bear trap helped PANW create its near-term support, but it has struggled to maintain its bullish momentum.
Notably, PANW formed a subtle bull trap in June, as the market rejected further buying momentum, raising another red flag. Therefore, we implore investors to be patient and at least wait for a re-test of its near-term support before considering adding exposure.
PANW Could Underperform The Market
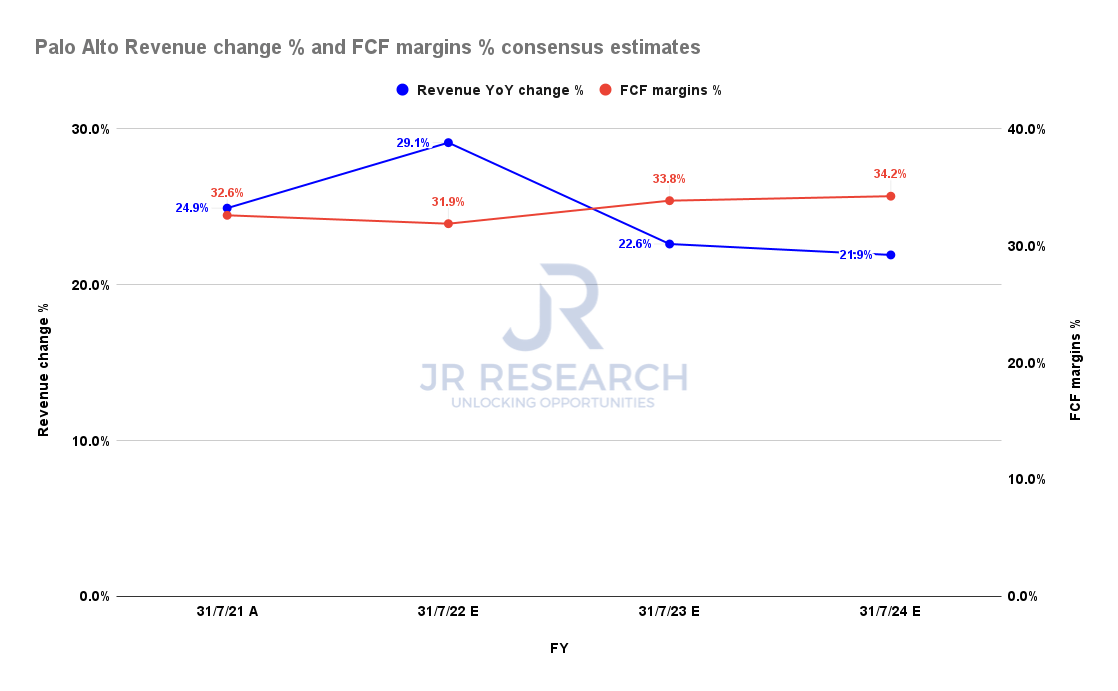
Palo Alto revenue change % and FCF margins % consensus estimates (S&P Cap IQ)
There’s no doubt that Palo Alto is a high-quality business even though it remains GAAP EPS unprofitable. Still, management highlighted its robust free cash flow (FCF) profitability and commitment to reducing its stock-based compensation.
Furthermore, CEO Nikesh Arora has maintained his guide on achieving a 32% FCF margin for FY22 (ending July quarter) in a recent conference. Moreover, management is confident of driving improvement in its FCF profitability, given its leverage. Therefore, we believe it augurs well to undergird PANW’s valuation.
| Stock | PANW |
| Current market cap | $49.73B |
| Hurdle rate (CAGR) | 7% |
| Projection through | CQ2’26 |
| Required FCF yield in CQ2’26 | 6% |
| Assumed TTM FCF margin in CQ2’26 | 33% |
| Implied TTM revenue by CQ2’26 | $11.85B |
PANW reverse cash flow valuation model. Data source: S&P Cap IQ, author
Notwithstanding, we believe much of its optimism has been priced into its current valuation. As a result, investors expecting PANW to deliver that 30% CAGR in returns over the next four years could be sorely disappointed.
Our reverse cash flow valuation model indicates that PANW could significantly underperform the QQQ’s 15% 5Y CAGR moving forward. PANW last traded at an NTM FCF yield of 4.33% (5Y mean: 4.87%).
However, we believe the market could be asking for higher FCF yields than its 5Y average, given its potential underperformance. As a result, we believe 6% is appropriate for now, as it bottomed out in 2018 and 2020 at above 7%.
If investors want to achieve market outperformance, we think they have to be patient and wait for a deeper retracement. Given its price action dynamics, we believe we cannot rule out a steeper sell-off.
Is PANW Stock A Buy, Sell, Or Hold?
We reiterate our Hold rating in PANW stock. PANW has struggled to regain its bullish bias even though it formed a validated bear trap in May. However, a June bull trap following its April double top convinced us that the market had rejected further buying momentum at its near-term resistance ($515).
Our valuation analysis suggests that the stock could underperform the market at the current levels. Therefore, investors should be patient and wait for the price action to play out over time. If PANW continues to struggle in regaining its bullish bias, a steeper sell-off to force another rapid liquidation could be in the cards.
Be the first to comment