

NicoElNino
Introduction
Whenever I run across the stock of a high-quality business in which analysts are extremely bullish and I notice a fundamental risk to the medium-term returns of the stock, I feel I have a responsibility to share with investors the risks that I see so they can at least be aware of those risks even if they choose not to act on them. I haven’t previously written about Palo Alto Networks (NASDAQ:PANW) stock, mostly because I prefer stocks that have a longer earnings history; a history which includes at least one recession. Palo Alto only has a history going back to 2014 as a publicly traded company, so I’ve simply avoided it until there was a longer earnings pattern to examine. Palo Alto is a global cyber security provider, which is likely to remain a growing industry for some time into the future, and, as we shall see, they have a very good earnings history so far. That means the quality of the business isn’t really going to be the question investors need to ask themselves with this stock. The questions investors need to ask themselves are 1) What are Palo Alto’s future earnings likely to be, and 2) what is a good price to pay for Palo Alto’s future earnings such that the stock will provide above-average returns for the investor? Those are the questions that I will try to answer in this article.
“Multiple Compression Cycle” and “Rerating”
Before I get into my valuation of Palo Alto, I want to explain why I think the stock is setting up for what I call a “Multiple Compression Cycle”. A multiple compression cycle refers to the price-to-earnings multiple, or P/E ratio. In the lifecycle of almost every long-term successful business that experiences its first 5 to 10 years as a public company with annual earnings growth above, say, 30%, there comes a time when the total remaining addressable market has diminished, or, competition has increased, or some combination of both occurs. As this happens, earnings growth rates slow. This doesn’t mean there is anything wrong with the business, it just means that if the market had previously been pricing in extremely fast earnings growth for long periods of time into the future, and that extremely fast earnings growth rate falls to a lower-than-expected level, the price of the stock will almost always come down as well (even if earnings themselves are still growing). Usually, this process takes several years, until eventually, with the really good businesses anyway, earnings catch up with the stock price, and a new average market P/E is established at a lower multiple than where it traded during the ultra-fast growth phase. After this happens, the stock price can start rising consistently again.
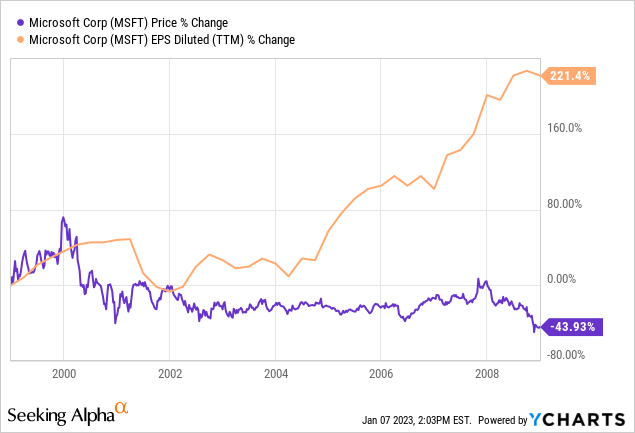
Above is an example of a multiple compression cycle for Microsoft (MSFT) that happened over the course of about 9 years from 2000 to 2009. I started the chart in 1999 so we could see the end of the fast growth upcycle. Over this time, from 1999 to 2009, Microsoft’s earnings per share rose over 200%, but the stock price fell more than -40%.
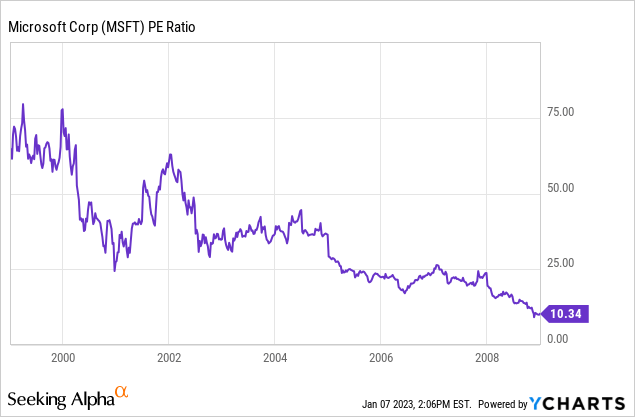
This took Microsoft’s approximate 60 P/E ratio in 1999 down to a P/E of 10 in early 2009. All this happened while earnings rose over 200% during the same period. This is admittedly an extreme example used for teaching purposes. I typically assume that most businesses, if they had an average P/E ratio over 60, and earnings growth simply slows without a major recession (Microsoft experienced two recessions in the period above.) that the new average P/E will rerate to a range of 25 to 30, maybe getting as low as 20 during a recession. But if a stock rerates from 60 to 30 and everything else stays the same, that is a more or less permanent loss of -50% on the stock price. Usually, this process occurs over the course of several years, though, and if earnings are growing during this time, the drawdown might not be as deep as this, but the odds of achieving good returns are very low when stocks go through these sorts of multiple compression cycles so investors who want good returns should be aware of them and do their best to avoid them.
Palo Alto’s Dangerous Set-Up
FAST Graphs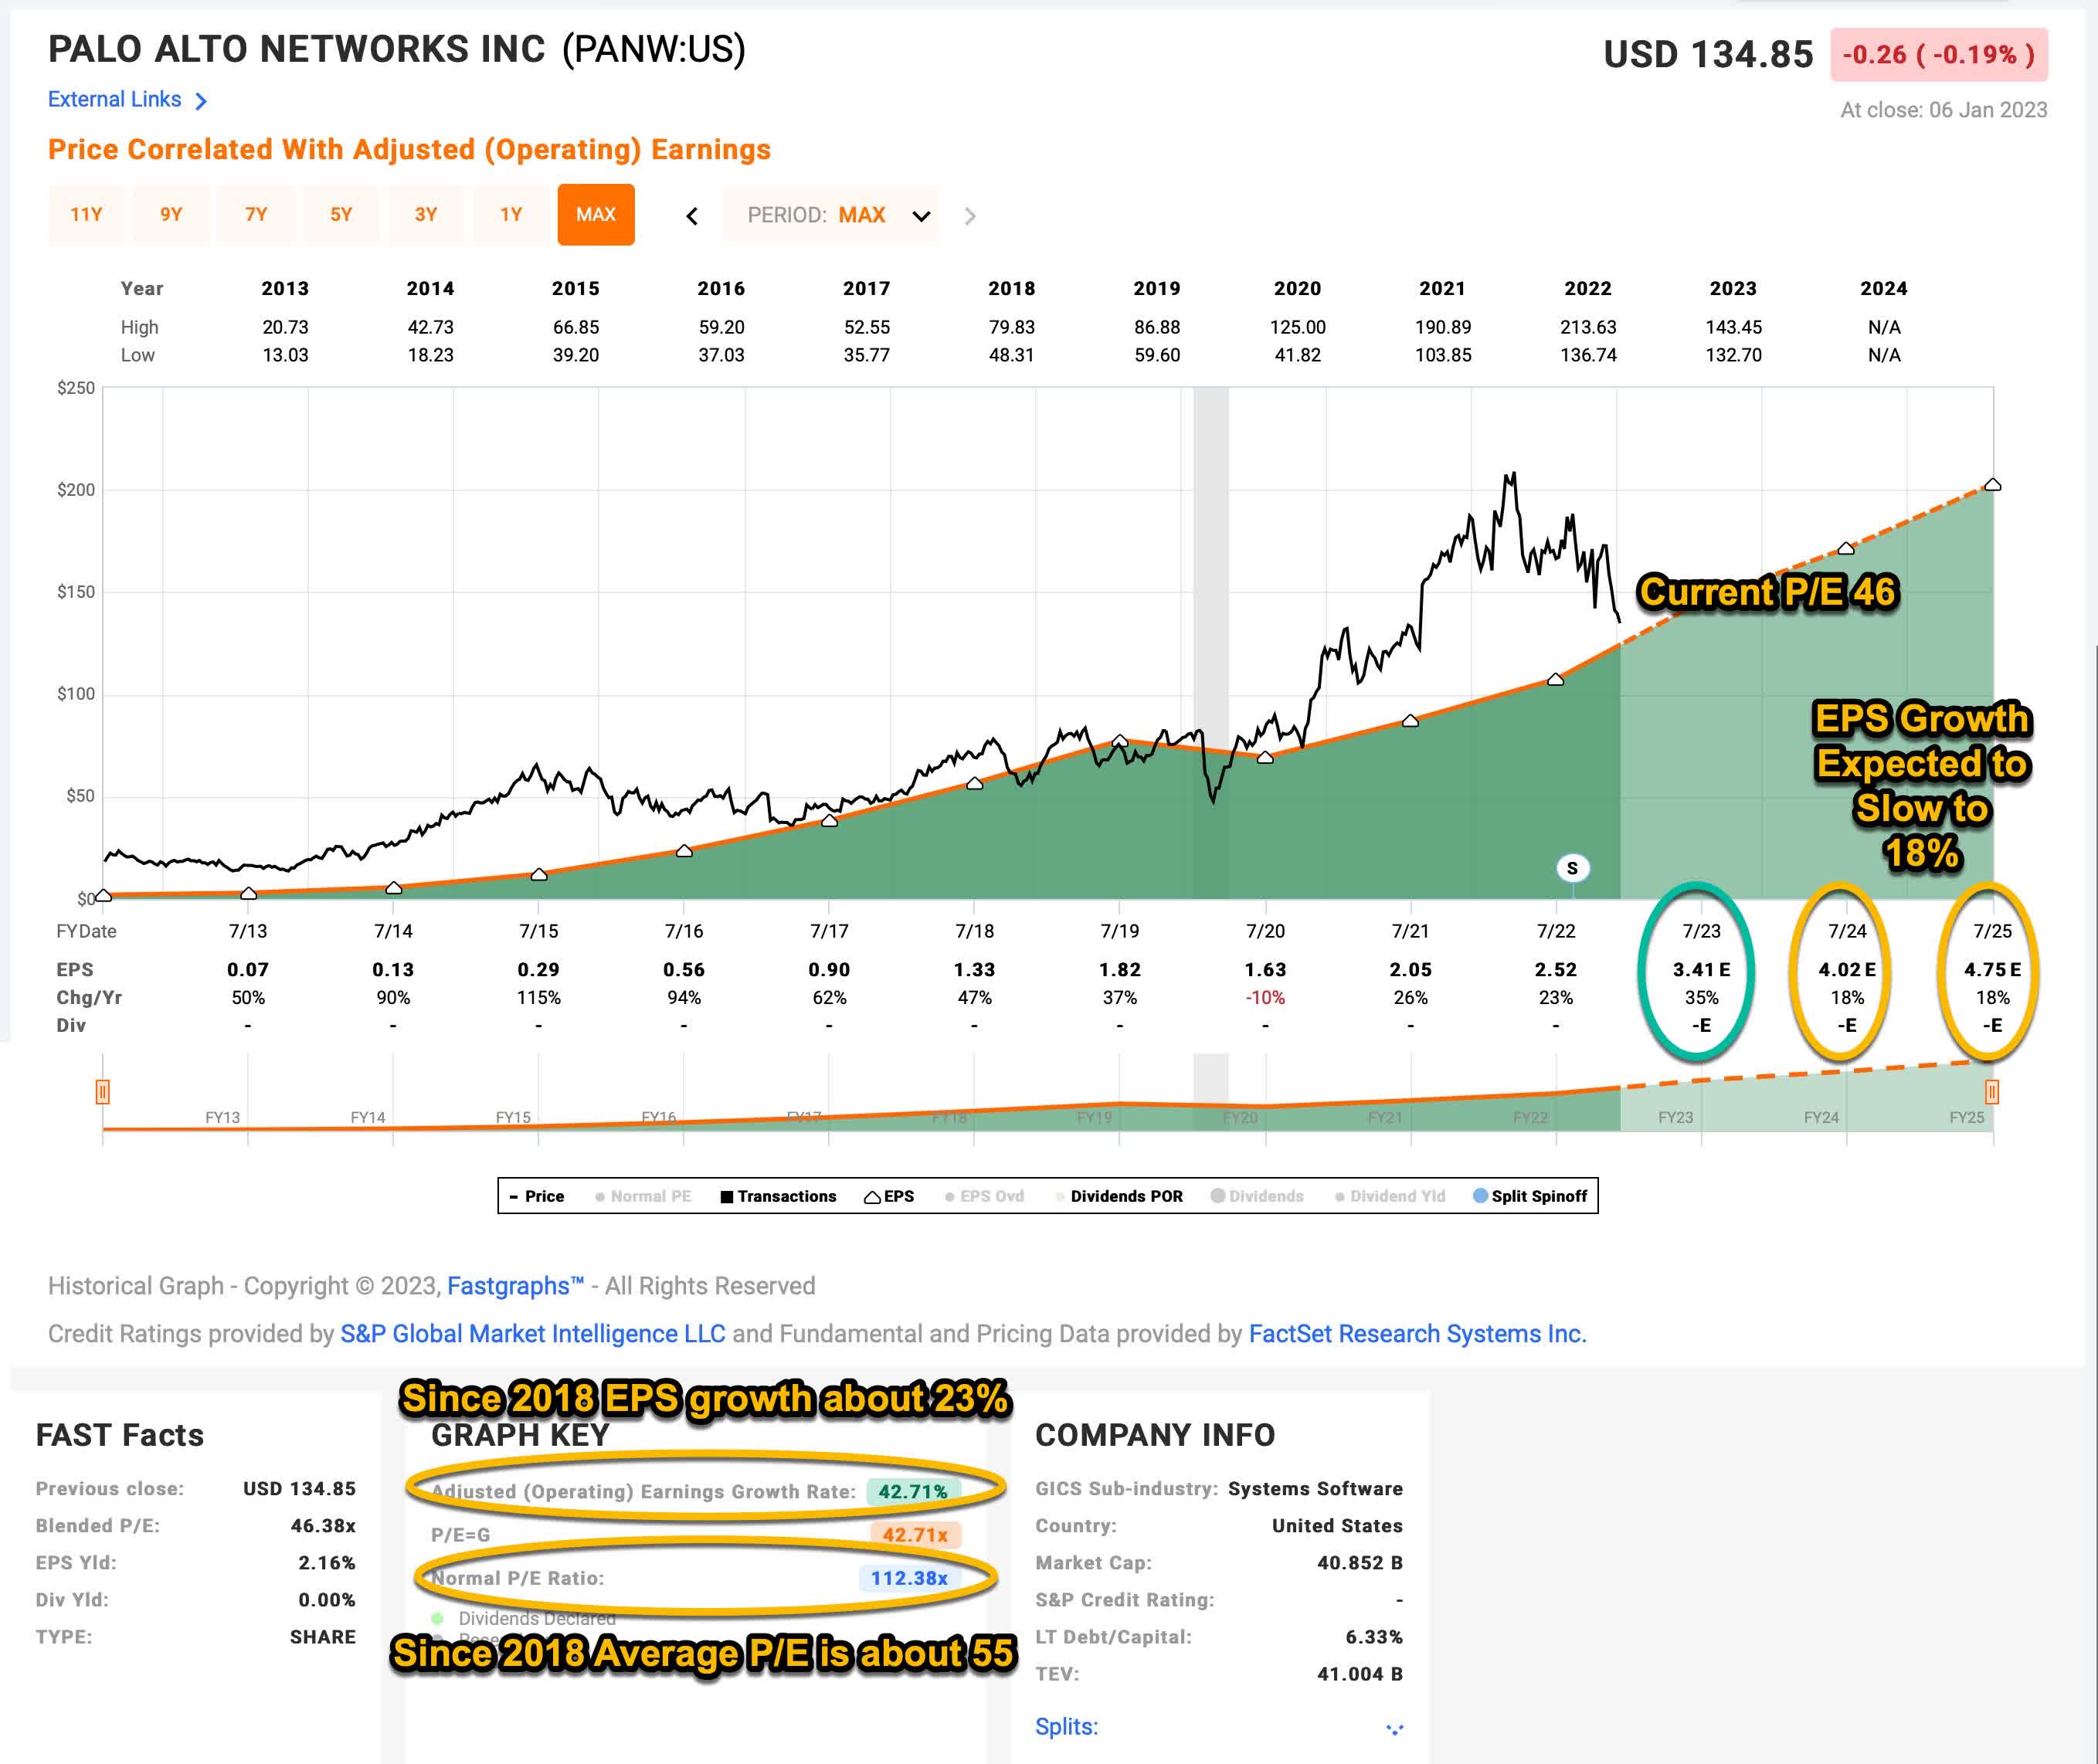
Currently, Palo Alto is expected to have very good earnings growth for fiscal 2023 of +35%, but analysts expect EPS growth to fall to +18% for 2024 and 2025. Basically cutting earnings growth in half to the slowest rate ever except the pandemic year of 2020. It’s also worth noting it’s about a -50% drop in growth rate from this year, and the recency of the trend often matters to investors if they only looked at the earnings growth of 2021-2023 and extrapolated that out far into the future when valuing the stock.
Longer term, since 2014, PANW’s annual earnings growth has been about +42% and since 2018 it has been about +23% on average. The average P/E ratio since 2018 has been about 55 and it currently trades around a 46 P/E using FAST Graphs blended earnings method. These P/Es, while not super extreme, are elevated if we expect 18% earnings growth going forward. This sets up a significant headwind for the stock.
I think the question investors must ask themselves here is what is an appropriate average P/E multiple to expect a stock to trade at with mid-teens earnings growth rates? Especially if the near-term stock price trajectory is down? For me, I think a 30 P/E ratio is reasonable if earnings growth does turn out to be between 15% and 20% per year over the medium-term of 3-5 years. So that is what I will use in my analysis. I will also assume that earnings growth is 20% going forward, which I think is quite generous given current expectations, but reasonable given the business’s strong past performance.
Next, I will use these assumptions in my standard analysis and see what sort of price range would be fair value for Palo Alto stock and also the price I would be willing to buy stock (a price which includes a margin of safety).
Market Sentiment Return Expectations
In order to estimate what sort of returns we might expect over the next 10 years, let’s begin by examining what return we could expect 10 years from now if the P/E multiple were to revert to its mean from the previous economic cycle. Typically, for my sentiment mean reversion expectation, when I choose the time frame from which to calculate a stock’s average P/E, I start around the year 2015, but because Palo Alto had an unsustainable earnings growth rate early on, I will share a chart that starts at 2018 for everyone to use as a baseline to compare the adjustments I noted I would be making in the last section.
FAST Graphs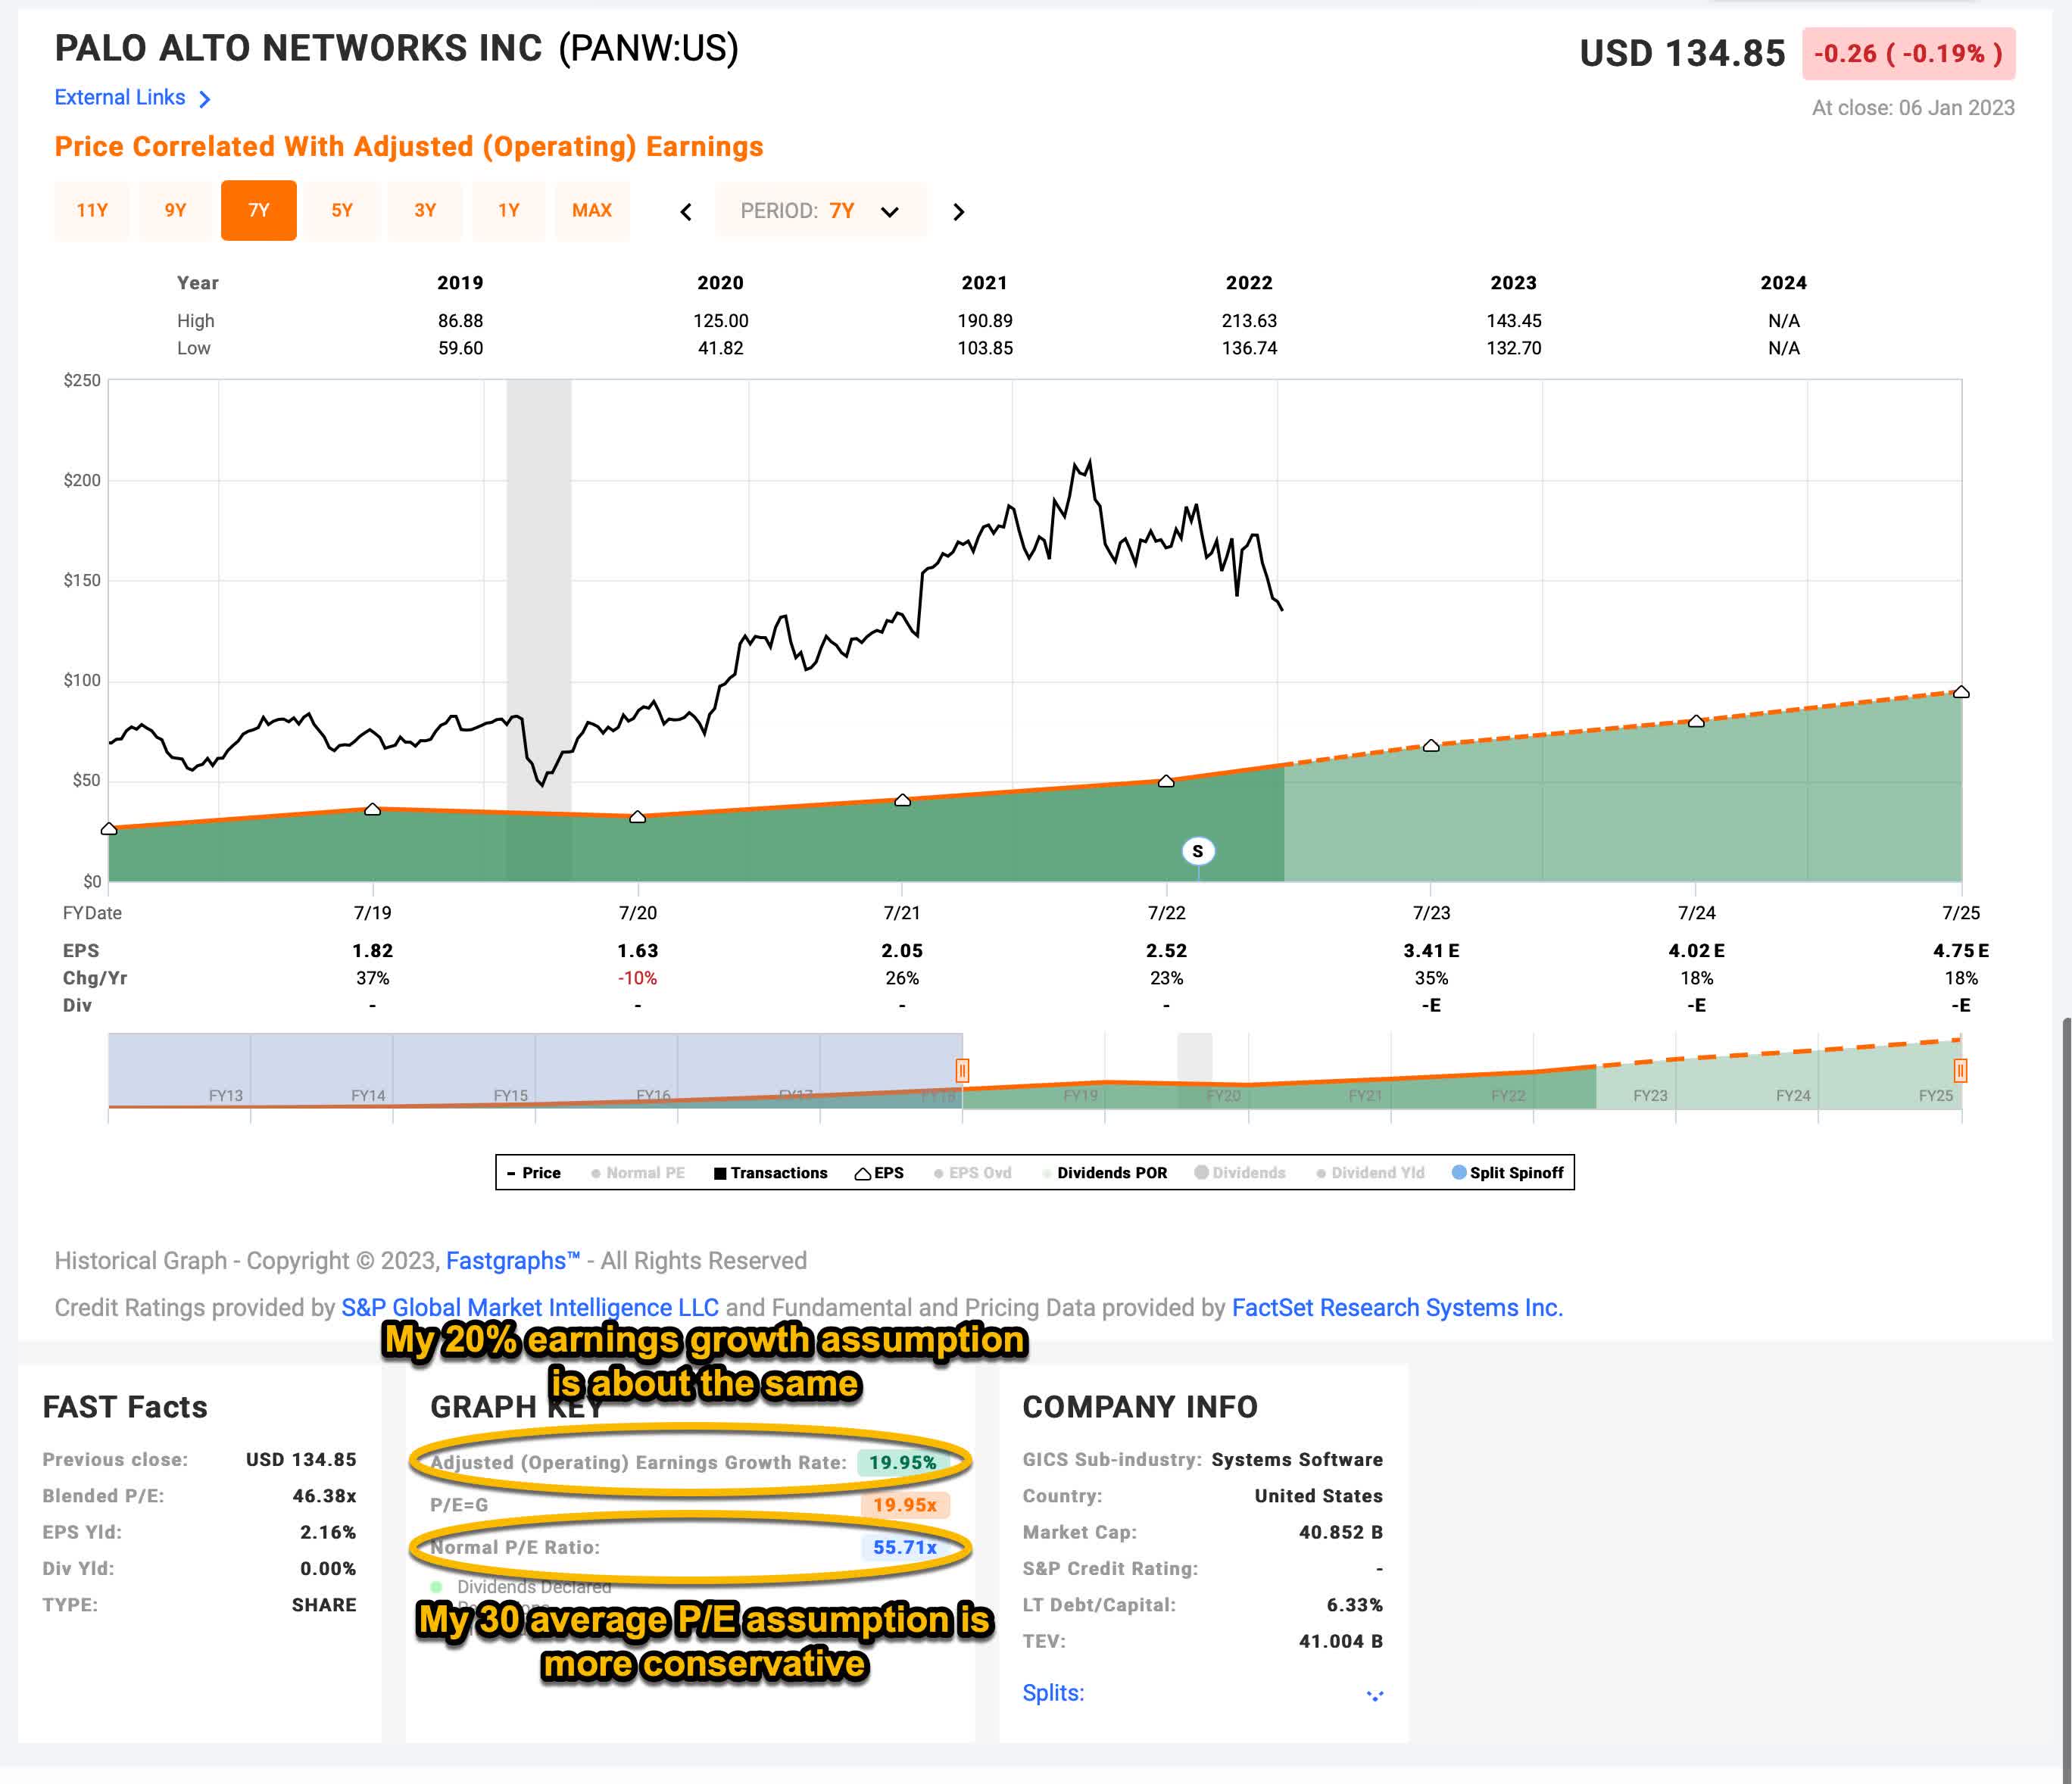
Palo Alto’s average P/E from 2018 to the present has been about 55.71 (the blue number circled in gold near the bottom of the FAST Graph). This I will assume changes to a 30 average over the next 10 years. (This is still a very generous assumption.) Using 2023’s forward earnings estimates of $3.41, PANW has a current P/E of 39.55. If that 39.55 P/E were to revert to the average expected P/E of 30.00 over the course of the next 10 years and everything else was held the same, PANW’s price would fall and it would produce a 10-Year CAGR of -2.72%. That’s the annual return we can expect from sentiment mean reversion if it takes 10 years to revert. If it takes less time to revert, the annual return would be lower.
Business Earnings Expectations
We previously examined what would happen if market sentiment reverted to the mean. This is entirely determined by the mood of the market and is quite often disconnected, or only loosely connected, to the performance of the actual business. In this section, we will examine the actual earnings of the business. The goal here is simple: We want to know how much money we would earn (expressed in the form of a CAGR %) over the course of 10 years if we bought the business at today’s prices and kept all of the earnings for ourselves.
There are two main components of this: the first is the earnings yield and the second is the rate at which the earnings can be expected to grow. Let’s start with the earnings yield (which is an inverted P/E ratio, so the Earnings/Price ratio). The current earnings yield is about +2.53%. The way I like to think about this is, if I bought the company’s whole business right now for $100, I would earn $2.53 per year on my investment if earnings remained the same for the next 10 years.
The next step is to estimate the company’s earnings growth during this time period. I usually do that by figuring out at what rate earnings grew during the last cycle and applying that rate to the next 10 years. However, as I noted earlier, with Palo Alto I am using my best estimate, which is about 20% per year. That is in line with what they have grown since 2018 and also in line with where analysts expect earnings to grow over the next 3 years or so.
Next, I’ll apply that growth rate to current earnings, looking forward 10 years in order to get a final 10-year CAGR estimate. The way I think about this is, if I bought Palo Alto’s whole business for $100, it would pay me back $2.53 plus +20% growth the first year, and that amount would grow at +20% per year for 10 years after that. I want to know how much money I would have in total at the end of 10 years on my $100 investment, which I calculate to be about $178.77 (including the original $100). When I plug that growth into a CAGR calculator, that translates to a +5.98% 10-year CAGR estimate for the expected business earnings returns.
10-Year, Full-Cycle CAGR Estimate
Potential future returns can come from two main places: Market sentiment returns or business earnings returns. If we assume that market sentiment reverts to the mean from the last cycle over the next 10 years for PANW, it will produce a -2.72% CAGR. If the earnings yield and growth are similar to the last cycle, the company should produce somewhere around a +5.98% 10-year CAGR. If we put the two together, we get an expected 10-year, full-cycle CAGR of +3.26% at today’s price.
My Buy/Sell/Hold range for this category of stocks is: Above a 12% CAGR is a Buy, below a 4% expected CAGR is a Sell, and in between 4% and 12% is a Hold. Palo Alto’s +3.26% expected 10-year CAGR makes it a “Sell” based on valuation at these levels.
My fair value midpoint for PANW stock is about $98 per share. Currently, it trades at about $135 per share, so just to get to the midpoint of fair value, we would need to see a significant drop in price. I would likely buy the stock if it fell under $77 per share because at that point it would rise above my 12% CAGR threshold.
Conclusion
Avoiding multiple compression cycles like these can be very difficult for investors, especially if someone has held the stock for a while and had good results. Investors know the business is solid. But even using pretty generous assumptions as I did in this analysis (basically that earnings would grow 20% per year uninterrupted for the next decade) Palo Alto stock is unlikely to produce good returns. We should also remember that long-term interest rates are likely to remain elevated for some time into the future, near “normal” levels of 4% or so. Usually, this has the effect of lowering the average P/E multiples investors are willing to pay for stocks. It becomes more difficult to maintain P/Es as high as the 30 P/E I assumed in this article.
There hasn’t been a “Sell” rating for this stock in well over a year, but I think now is a good time to trim positions for investors who would like the best chance at good medium-term returns.
Be the first to comment