

piranka
| Total Return |
Annualized Return |
|||||
|
Inception |
Quarter |
YTD |
1 Year |
3 Year |
Inception |
|
|
Palm Valley Capital Fund |
4/30/19 |
3.86% |
3.16% |
3.16% |
8.43% |
7.24% |
|
S&P SmallCap 600 Index |
9.19% |
-16.10% |
-16.10% |
5.80% |
6.36% |
|
|
Morningstar Small Cap Index |
8.05% |
-18.46% |
-18.46% |
3.33% |
4.16% |
|
Performance data quoted represents past performance; past performance does not guarantee future results. The investment return and principal value of an investment will fluctuate so that an investor’s shares, when redeemed, may be worth more or less than their original cost. Current performance of the Fund may be higher or lower than the performance quoted. Performance of the Fund current to the most recent quarter-end can be obtained by calling 904-747-2345.
As of the most recent prospectus, the Fund’s gross expense ratio is 1.83% and the net expense ratio is 1.30%. Palm Valley Capital Management has contractually agreed to waive its management fees and reimburse Fund operating expenses through at least April 30, 2023
Courage Under Fire
Kairos (ancient Greek): the opportune and decisive moment
January 1, 2023
Dear Fellow Shareholders,
At daybreak on June 17, 1775, colonial forces under the command of William Prescott gazed over the top of a strong redoubt they had constructed the prior night on Breed’s Hill in Charlestown, Massachusetts.
The colonists were vastly outnumbered and short on gunpowder. As the British army advanced on their position, marking the beginning of the Battle of Bunker Hill, legend has it the colonists heard the famous orders: “Don’t fire until you can see the whites of their eyes!” To achieve maximum impact, theywould wait until the threat was uncomfortably close before expending scarce resources. Investors take note.

Battle of Bunker Hill by Don Troiani
There are three types of edges in investing: informational, analytical, and behavioral. While there will always be opportunities for enterprising investors to uncover interesting nuggets on public companies, material informational advantages have dwindled due to technological advances and regulatory changes. Today, most active managers attempt to differentiate and market themselves by their analytical approaches. They announce, “We buy undervalued companies with strong competitive advantages” or “Our quant model identifies growth stocks that are likely to continue to outperform.” However, the congruence in outcomes for most mutual funds indicates that advertised differences in investment styles have little practical impact when portfolios are overdiversified and markets are driven by central banks.
Source: Bloomberg; S&P 500 EPSis scaled up historically by Consumer Price Index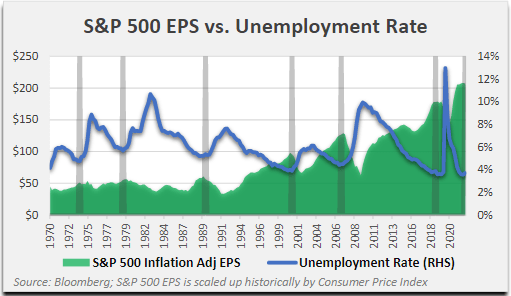
Most investors have abandoned the pursuit of a true analytical edge in favor of primarily analyzing the Federal Reserve’s words and actions. Dovish Fed = wind at our backs. Hawkish Fed = wind in our faces… no, they’ll come around. They always do! Except now, as the Fed attempts to extinguish the inflationary upswell of 2021 and 2022 that they ignored for too long, Fed members are telling investors the rate hikes won’t stop until the inflation genie is back in the bottle. And, they add, it will probably take job losses to achieve that outcome. Naturally, there is a rather strong historical relationship between corporate profits and employment. Right now, both are at a cyclical peak.
There is a growing camp of investors that thinks you’d be an idiot to ignore the Fed’s tough guy act, since it has been supported by consistent rate hikes throughout 2022. The Fed, with egg on their faces, must prove that they aren’t a one trick pony in the Asset Bubble Derby and actually will address inflation persisting above their stated 2% mandate. They’re doing it, belatedly, and with a balance sheet that remains gargantuan by any historical comparison. Still, with all the rate hikes and Fed jawboning, investors haven’t ignored the wink and nod to the Fed put. During the November 2, 2022, FOMC press conference, after repeatedly affirming the Fed’s determination to quell inflation, Chairman Powell made clear:
“If we overtighten, then we have the ability with our tools, which are powerful, to, as we showed at the beginning of the pandemic episode, we can support economic activity strongly if that happens, if that’s necessary.”
The S&P 500 finished 2022 down 19% from its all-time high. We do not believe U.S. stocks are pricing in an extended period of higher interest rates or a decline in corporate profits. The 10-year Treasury yield fell over 80 basis points from its October peak to early December before rebounding over the last two weeks. Fed members themselves don’t even know where short-term rates will be in twelve months. A year ago, they were expecting the Fed Funds rate to end 2022 below 1%. We aren’t sure where inflation will settle and how long it will take to get there, but we feel strongly that the Fed will be less resistant to easing than it was to tightening.
Pulling the proverbial punch bowl might be a no-brainer with underage guests and police on the scene, but these guys and gals like to party. You don’t make friends by punishing portfolios forever.
Source: Bloomberg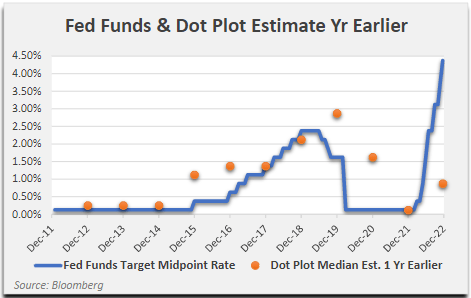
The finance and real estate sectors are, regrettably, beholden to the Fed. Millions of careers depend on the Fed’s magnanimity to asset owners. Billionaire Starwood Capital CEO Barry Sternlicht bleated on CNBC in December that the Fed’s rate hikes are “an assault on capitalism.” Eradicating the speculative, debt-fueled behavior that formed our modern economy likely involves much heavier lifting than coming off the zero bound for a year or two. But it’s a start. We don’t think the Fed is the shepherd that will lead our economy to a more sustainable place. Eventually, though, we believe we’ll get there, but not before crossing dark valleys of volatility. In our opinion, the key ingredients for future investment success could be very different than what worked the last dozen years.

Equity valuations have not reflected the compression seen during prior inflationary periods. In our opinion, average multiples are still hovering at higher-than-normal levels for two reasons: (1) investors do not expect higher interest rates to persist, and (2) they appear to think recent earnings are largely sustainable (with some exceptions).
We believe a world where interest rates are manipulated lower by central banks is ultimately self-correcting. Some of that is currently playing out, as the speculative boom of 2021, which was facilitated by the Fed, turned inflationary. This broad inflation was more poignant than the long period of asset inflation that preceded it, prompting a monetary policy reversal. Thinking beyond our current predicament, for extremely low interest rates to endure without kindling inflation would normally suggest a weak, slow growth economy. A stock’s capitalization rate is “k – g” (required return – growth rate), and if both are low, there is no expansion of the justified valuation multiple. The U.S. has been able to enhance its economic growth rate in recent decades from of an accumulation of debt, which will sap future growth.
The second leg of support for bloated valuations—earnings—could be the catalyst that finally sends stocks reeling. Earnings for the S&P SmallCap 600 soared 113% from the end of 2019 to their peak in 2022. Margins for profitable small firms hit record levels in the second quarter and decreased slightly in Q3 due to inflation. Profits haven’t broken down broadly yet, as half of small caps still reported year-over-year earnings growth in the third quarter. To return to the average since the turn of the century, small cap margins would need to contract by about 25%.
Source: Bloomberg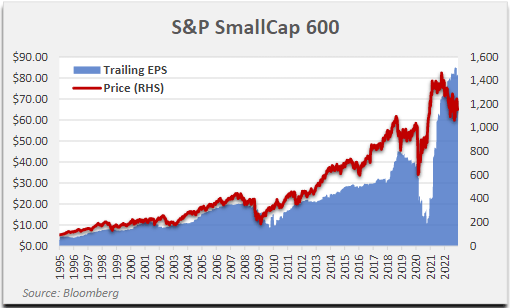
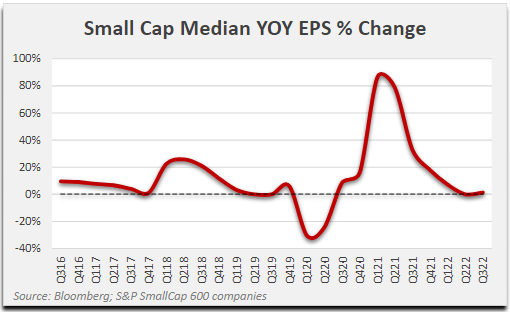
We think the end draws nigh for the small cap profit cycle. The three sectors contributing most to the astonishing earnings growth of the small cap index (S&P 600) since 2019 are Energy, Financials, and Consumer Discretionary. Energy profits will face difficult comparisons in the coming quarters given the decline in oil prices from a summer peak above $120/bbl to $80/bbl at year end. As far as Financials, small cap banks bulked up on commercial real estate loans after the credit crisis, and we expect delinquencies to rise from very low levels. Key industries that drove Consumer Discretionary EPS expansion during the pandemic were homebuilders, RV manufacturers, and retailers. This sector has already begun to exhibit earnings weakness, with profits for the median company down 20% year-over-year in Q3 (from extremely elevated levels). Rising interest rates have dropkicked the housing market, as well as demand for RVs. The reported personal savings rate reflects an unwinding of the government’s pandemic transfers. If the job market softens according to the Fed’s plan and stimulus is not renewed, we imagine the retail space will become significantly more pressured. The employment rate took 10 years to fully recover after the 2008 credit crisis. While it may seem harsh, a recession could be needed to rebalance the labor market. It’s a good thing the Bureau of Labor Statistics doesn’t hedonically adjust customer service!
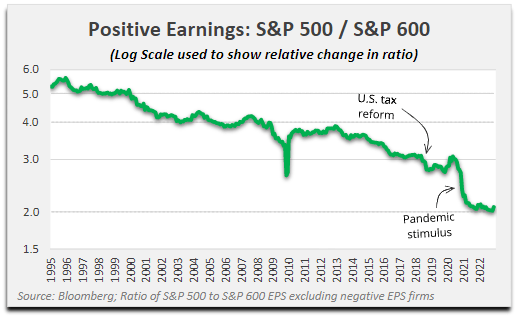
Earnings for profitable small caps compounded at nearly 11% annualized since 1995, exceeding the growth rate for large caps by over 3.5%. Although small firms are generally expected to produce faster growth, the recent boom catapulted small company profits beyond their long-term trend versus bigger firms (chart below), which is surprising considering earnings gushers from Apple, Microsoft, and Google. Tax cuts, share repurchases, falling interest rates, and corporate and federal borrowing were all catalysts that supported rising per share profits. Federal debt grew from $5 trillion in 1995 to $31 trillion today, making the $76 billion in total net income for companies in the S&P SmallCap 600 Index look like a drop in the bucket. Without growing deficits, we believe corporate earnings will lose a major tailwind, and small company profits could be disproportionately impacted.
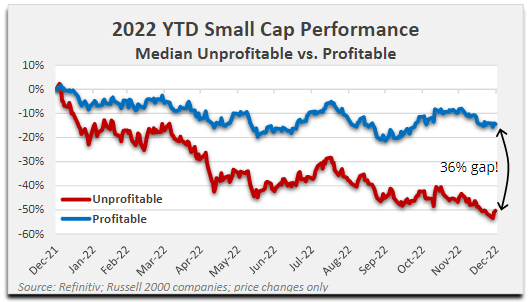
We don’t foresee a happy ending to this story where investors avoid steep losses. We expect there to be opportunities to deploy capital at our return hurdles, and 2022 offered hope that we were approaching those levels. However, the most severe casualties in 2022 were seen in highly speculative investments such as crypto assets and young, unprofitable companies. Money losing businesses in the Russell 2000 fell 50% in 2022 (median), over 4x as much as profitable ones, which had a median loss of 12%, including dividends. Over the last two years, profitable small caps are higher, on average, by over 10%, while unprofitable ones registered morethan a 50% median haircut. As far as we’re concerned, let the bodies hit the floor.
Extremely speculative investments generally do not belong in absolute return portfolios, in our opinion. Therefore, the vaporization of previous euphoric gains is primarily relevant to us in whether it is the prologue to a widespread drawdown. The mostly profitable S&P SmallCap 600 has an overall P/E of 15x, which may appear totally acceptable, but the Index multiple on pre-pandemic EPS is 33x. Additionally, the median company P/E based on trailing earnings is 19x. Based on our bottom-up analysis of the companies we follow, we are not seeing many discounts when valuing firms on normalized earnings and insisting on a double digit required return. At Palm Valley, we aren’t trying to time the market. We’re waiting for individual opportunities to come into our sights, and most high-quality small caps just aren’t there yet.
For the quarter ending December 31, 2022, the Palm Valley Capital Fund (“the Fund”) increased 3.86% compared to a rise of 9.19% for the S&P SmallCap 600 Total Return Index and an 8.05% gain for the Morningstar Small Cap Total Return Index. The Fund lagged benchmarks during the fourth quarter due to our large cash position. At the end of the period, the Fund held 78.9% of assets in cash equivalents, which include U.S. Treasuries. The equities within the portfolio increased 15.36% for the three-month period and benefited from our above-average exposure to precious metals.
For the full 2022 year, the Fund rose 3.16%, while the S&P SmallCap 600 dropped 16.10% and the Morningstar Small Cap benchmark decreased 18.46%. The Fund’s equity holdings generally performed better than small cap benchmarks, with our stocks returning 13.04% in 2022. Currently, most of our positions are not included in popular U.S. small cap benchmarks such as the S&P SmallCap 600 and Russell 2000. However, we believe our favorable relative equity performance versus benchmarks was mainly because our companies tend to be mature and profitable, two characteristics that tended to improve 2022 returns.
During the year, the average daily yield offered on three-month U.S. Treasury bills was 2%, and it finished at 4.4%. We celebrate higher risk-free yields, and they made a welcome contribution to our performance in 2022. Nevertheless, the rise in short-term rates does not directly impact our equity valuations or timing of investment. We believe this differentiates Palm Valley from most investment managers who use a fluid cost of capital calculation as opposed to a more rigid absolute return hurdle—ours is 10% to 15% for our equities. We are familiar with the consequences of holding zero yielding cash when expensive stocks keep ascending. However, our strategy will accept relative performance shortfalls in an attempt to guard against material drawdowns and preserve our flexibility to act when valuations are ripe. Consider the Fund’s performance (ticker: MUTF:PVCMX) since inception versus the S&P SmallCap 600 and Russell 2000 Indexes, separated by year (partial year in 2019 from the Fund’s April 30, 2019, launch):
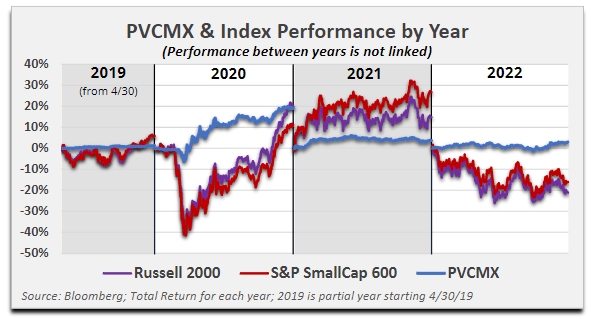
In retrospect, our performance journey may appear mundane in every period except 2020. From our perspective, Spring 2020 was the only time since the Fund’s inception that the small cap market offered a sizeable number of opportunities meeting our required return threshold. Of course, when stocks were on the verge of becoming truly cheap during the beginning of the pandemic, the Fed unleashed its “powerful tools” to reignite the equity bull market. While we will be unsurprised by similar Fed actions in the future, we think the likelihood of an unencumbered rebound in stocks is diminishing, given the threat of inflation and fatigue from wealth inequality.
The Fund’s lower volatility has been primarily due to our cash position. Since inception, the Fund’s annualized standard deviation of returns is 6.6% compared to 29.7% for the S&P SmallCap 600 and Russell 2000. However, the standard deviation of the Fund’s equities is 24.1% since inception. Lower volatility is sometimes a byproduct of our strategy, but it is not something we are specifically targeting. In fact, while we prefer to invest in high quality businesses with predictable cash flows, which are easier to value, we are willing to invest in sectors with greater historical volatility, such as energy and materials (e.g., precious metals). Enduring expensive valuations among higher quality American firms have led us to less popular areas among U.S. investors like commodity-oriented companies and businesses with foreign exposure.
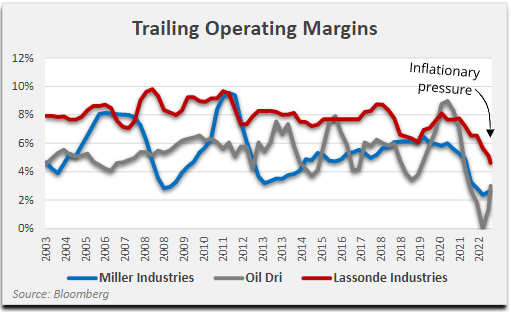
One theme for the Fund during 2022 was our investment in companies exhibiting margins that are below normal levels, generally because of inflationary factors. We believe this contrasts with the overall market’s above-average profitability. Fund holdings that fit this bill include Miller Industries (ticker: MLR), Oil Dri (ticker: ODC), Lassonde Industries (ticker: LAS/A CN)(LAS.A:CA), and Hooker Furnishings (ticker: HOFT). In the first three cases, we believe the catalysts for improved profitability are the price increases the companies are currently pushing through to customers. Miller Industries, for example, will have raised its tow truck prices by nearly one-third from the beginning of 2021 through January 2023. Lassonde’s fruit juice prices rose 12% year-over-year in Q3, while Oil Dri’s product pricing was up roughly 20% from the prior year. Hooker Furnishings’ margin problems have been caused by issues besides inflation, and we believe these are resolving; nevertheless, signature Hooker Branded average selling prices are approximately 30% higher over two years. For certain businesses, the lag between cost inflation and price realization presented investment opportunities in 2022, in our judgment.
We did not purchase any new holdings during the fourth quarter. We sold three positions entirely: Heartland Express (ticker: HTLD), Alamos Gold (ticker: AGI), and Smith & Nephew plc (ticker: SNN). Heartland took on leverage for an acquisition, which increased the company’s financial risk. Alamos and Smith & Nephew appreciated quickly after purchase and exceeded our calculated valuations. We also meaningfully reduced our weightings in Amdocs (ticker: DOX), Osisko Gold Royalties (ticker: OR), and Oil Dri (ticker: ODC) as their stock prices approached fair value.
|
Top 10 Holdings (12/31/22) |
% Assets |
|
Sprott Physical Silver Trust (PSLV) |
3.62% |
|
2.27% |
|
|
Sprott Physical Gold Trust (PHYS) |
2.25% |
|
WH Group (OTCPK:WHGLY) |
1.53% |
|
Miller Industries (MLR) |
1.44% |
|
Natural Gas Services (NGS) |
1.44% |
|
Lassonde Industries (LAS.A:CA)(OTCPK:LSDAF) |
1.21% |
|
Kelly Services (KELYA) |
1.18% |
|
Oil-Dri (ODC) |
1.08% |
|
Hooker Furnishings (HOFT) |
0.97% |
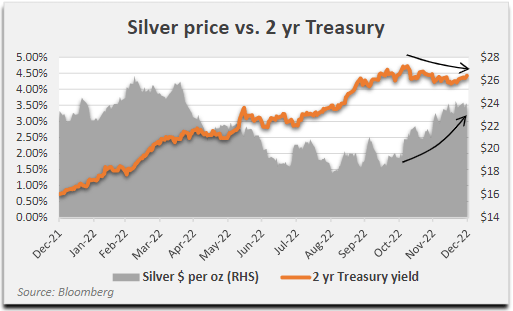
The three positions contributing most to the Fund’s fourth quarter performance were the Sprott Physical Silver Trust (ticker: PSLV), Oil-Dri, and Miller Industries. Silver prices gained 26% in the fourth quarter. Medium-term interest rate expectations peaked in mid-October, then began to slide. Investors’ anticipation of a Fed pivot supported precious metals, which held most gains through the end of the quarter, even as equities sold off in December. The silver market has lately demonstrated more strength than gold, a function of its higher volatility and, potentially, suspected shortages in the market for physical silver. Oil-Dri’s revenues rose 19% in Q4 due to price increases, fueling expanding gross margins across its product line, which ranges from cat litter to industrial absorbents. Oil Dri may be closer to the finish line in raising prices than some of the Fund’s other positions that were acquired under a similar thesis. Miller Industries, which has also pushed through significant pricing, has seen a partial recovery in margins this year.
During the quarter, the only holding negatively impacting the Fund by at least 10 basis points was WH Group (ticker: OTCPK:WHGLY). Strong revenue and profit growth year-to-date have been overshadowed by a more cautious outlook due to cost inflation and the near-term impact of China relaxing its zero-COVID policies. The shares trade for less than 5x trailing operating profit.
For the full calendar year, the Fund’s top performers were Coterra Energy (ticker: CTRA), Amdocs, and Alamos Gold. Coterra’s stock rose sharply along with energy prices at the beginning of 2022. Amdocs delivered record operating results during the year and demonstrated the strength of its market position serving the world’s leading communication service providers. All the Fund’s precious metals holdings, led by Alamos, contributed positively to performance in 2022, with a 1% collective contribution from gold and silver equities. We think this was a good outcome relative to gold and silver prices that ended the year essentially flat, after a summer swoon. Additionally, precious metals miners were down, on average, in 2022.
The Fund’s primary 2022 detractors were Crawford & Co. (tickers: CRD.A, CRD.B) and Lassonde Industries (ticker: LAS/A CN). Crawford’s shares were by far the largest drag on the portfolio during the year, which could reflect an apparent lack of urgency by management to restore profitability in the company’s international operations. Additionally, Crawford’s leverage increased over the past 18 months to fund acquisitions. We think the valuation is attractive at 5-6x normalized EV/EBITA, and potential near-term catalysts include an abatement of tax loss selling, year-end cash collections that will reduce leverage, and a boost in fourth quarter catastrophe-related claims revenue tied to Hurricane Ian.
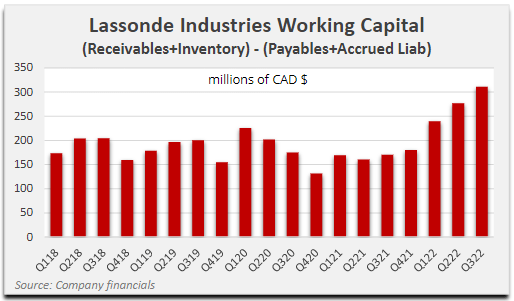
We acquired Lassonde Industries midway through 2022 at a multiyear low, but the Canadian-domiciled company’s stock continued to sink and now trades for 6x our estimate of normalized operating income. Profits have been negatively impacted by inflationary pressures for packaging, apple and orange concentrates, and transportation costs. Management is aggressively raising prices for its branded and private label fruit juice and drink offerings. The company intends to make significant capital investments to improve the performance of its lagging U.S. operations.
Management announced that because supply chain challenges were fading, Lassonde is revising its inventory accumulation strategy and expects to reduce inventory levels.
Elevated working capital is a common theme among public firms at the moment, and we wonder what the collective impact will be of a synchronized pullback.
“The two most powerful warriors are patience and time.” – Leo Tolstoy
On the eleventh hour of the eleventh day of the eleventh month of 1918, fighting in World War I officially ceased after Germany signed an Armistice with the Allied Powers earlier that day. In October, Netflix released a remake of All Quiet on the Western Front (spoilers ahead). The movie follows a young German soldier during WWI and is “possibly one of the most searing and soul-crushing depictions of warfare that has ever muddied the screen,” according to USA Today.

The film opens as young, excited German volunteers are issued uniforms—unaware that these had belonged to dead soldiers. Paul, the protagonist, who lied about his age to serve, is immediately sent to the front line, where his life is saved in the trenches by a veteran comrade. Shellshocked and helpless, Paul is ordered to collect the dog tags of the deceased. What follows is an extreme amount of hunger, death, suffering, and hopelessness that transforms Paul from an eager 17-year-old recruit to a gaunt, desperate warrior fighting to survive another day. Each of his friends is killed, with Paul’s last comrade shot by a farmer’s son after attempting to steal a goose for the second time. Meanwhile, the beleaguered German leadership reluctantly agrees to onerous terms imposed by their French counterparts to stop fighting precisely at 11:00am on November 11, 1918. Nevertheless, the intransigent General Friedrichs orders his remaining, depleted forces to engage in a final battle the morning before the armistice takes effect. Paul is fighting in the trenches again, and it appears he will survive until the clock strikes 11. Sadly, he is critically wounded in the final seconds of the war, and he staggers out of the bunker to catch one last glimpse of daylight and peace.
The message of the film is futility. With machine guns and mustard gas, WWI fighting was routinely chaotic—“whites of their eyes” restraint was missing in action. Almost twenty million people died from the war, including three million soldiers on the Western Front, a 400+ mile line of trenches between France and Germany. Despite this enormous toll, neither side gained significant ground at the front lines at any time. Symbolically, the penultimate death among Paul’s crew happened after a literal wild goose chase.

A wild goose chase is the foolish and hopeless pursuit of something unattainable. The consequences of war overshadow anything else, but as far as careers are concerned, modern absolute return investors are accustomed to feelings of despair. It can be argued that since the emergence of the Fed put, it’s a fool’s errand to normalize profits and wait for equity multiples to revert to historical levels before buying. At Palm Valley, we fight this battle daily.
On the other hand, maybe the real wild goose chase is the attempted elimination of the business cycle by the U.S. government and Federal Reserve. While the U.S. was long viewed as the world’s premier free market economy, we’re clearly headed in the other direction with increasing government intervention. For the most part, those complaining now about Fed rate hikes were not bemoaning the rate suppression that came first. Yet, what’s good for the goose is good for the gander. It’s time to clean up the mess.
Fed members blundered in their initial nonreaction to spiking inflation; however, by the end of 2022 they were communicating and delivering a more hawkish monetary policy than we have seen in several years. Stocks fell, but not nearly as much as one who believed we were permanently off the zero bound might expect. At this juncture, you can either invest based on a belief in business cycles and normalization or invest based on faith that the economy can be successfully managed forever.
As for us, like the colonists near Bunker Hill, we’ll wait patiently on higher ground for real opportunities to materialize, instead of hanging out in the trenches on the front lines in the expectation of an eleventh hour bailout.

Thank you for your investment.
Sincerely,
Jayme Wiggins | Eric Cinnamond
|
Mutual fund investing involves risk. Principal loss is possible. The Palm Valley Capital Fund invests in smaller sized companies, which involve additional risks such as limited liquidity and greater volatility than large capitalization companies. The ability of the Fund to meet its investment objective may be limited to the extent it holds assets in cash (or cash equivalents) or is otherwise uninvested. Before investing in the Palm Valley Capital Fund, you should carefully consider the Fund’s investment objectives, risks, charges, and expenses. The Prospectus contains this and other important information and it may be obtained by calling 904-747-2345. Please read the Prospectus carefully before investing. Past performance is no guarantee of future results. Dividends are not guaranteed and a company’s future ability to pay dividends may be limited. A company currently paying dividends may cease paying dividends at any time. Fund holdings and sector allocations are subject to change and are not a recommendation to buy or sell any security. Earnings growth for a Fund holding does not guarantee a corresponding increase in the market value of the holding or the Fund. The S&P SmallCap 600 Total Return Index measures the small cap segment of the U.S. equity market. The index is designed to track companies that meet specific inclusion criteria to ensure that they are liquid and financially viable. The Morningstar Small Cap Total Return Index tracks the performance of U.S. small-cap stocks that fall between 90th and 97th percentile in market capitalization of the investable universe. It is not possible to invest directly in an index. The Palm Valley Capital Fund is distributed by Quasar Distributors, LLC. Opinions expressed are those of the author, are subject to change at any time, are not guaranteed and should not be considered investment advice. Definitions: Basis point: One hundredth of a percentage point (0.01%). bbl: Abbreviation for one barrel of oil (42 U.S. gallons liquid volume). CAD: Canadian dollar CPI (Consumer Price Index): A measure that examines the weighted average of prices of a basket of consumer goods and services. Dot Plot: Chart that records each Fed member’s projection for the Federal Funds Rate. EBITA: Earnings Before Interest, Taxes, and Amortization of acquired intangibles (i.e., operating income). Enterprise Value (EV): Market Cap plus total debt minus cash equivalents, adjusting for noncontrolling interests. EPS (Earnings per share): Net income divided by shares outstanding. Federal Funds Rate: The interest rate that banks charge each other for lending money on an overnight basis. Fed put: A belief that the Federal Reserve will always rescue the financial markets. FOMC (Federal Open Market Committee): A committee of the Federal Reserve Board that meets regularly to set monetary policy, including the interest rates that are charged to banks. Free Cash Flow: Free Cash Flow equals Cash from Operating Activities minus Capital Expenditures. P/E Ratio: A stock’s price divided by its earnings per share. Russell 2000: The Russell 2000 Index is an American small-cap stock market index based on the market capitalizations of the bottom 2,000 companies in the Russell 3000 Index. S&P 500: The Standard & Poor’s 500 is an American stock market index based on the market capitalizations of 500 large companies. Standard deviation: A measure of the dispersion of a dataset around its average. Working Capital: The difference between a company’s current assets and current liabilities. YOY (year-over-year): Analysis of results from one time period with those from another time period one year earlier. Zero Bound: Monetary policy tool where a central bank reduces short-term interest rates to zero to stimulate the economy. |
Editor’s Note: The summary bullets for this article were chosen by Seeking Alpha editors.
Editor’s Note: This article discusses one or more securities that do not trade on a major U.S. exchange. Please be aware of the risks associated with these stocks.
Be the first to comment