

ZargonDesign
It’s been a few months since I initially warned against an investment in Oxford Lane Capital (NASDAQ:OXLC). I was put off by the outrageous fees (total expense in excess of 10% of net assets in the last fiscal year), perpetual NAV declines, and constant share dilution. Most importantly, I was worried we were in the beginning stages of a credit cycle, which could hurt highly levered credit investments like OXLC. Has the passage of time changed my views regarding OXLC?
Oxford Lane’s poor performance in the past few months have confirmed my initial cautious stance. The fund’s outrageous expenses makes it extremely difficult to generate decent returns. While investors are enticed with a 17.6% current distribution yield, after factoring in NAV declines, total return is -29% YTD. With the credit cycle set to enter a recession in 2023, I would avoid levered CLO equity funds like OXLC.
Underperformance Confirms Cautious Stance
Since late August, OXLC has declined ~15% in share price, while paying investors 3 monthly distribution of $0.075 / share, for a total return of -11.7%. In contrast, equity markets and long-term treasuries have delivered total return losses of less than 3% respectively, as measured by the SPDR S&P 500 Trust ETF (SPY) and iShares 20+ Year Treasury Bond ETF (TLT).
Furthermore, credit-focused funds like the SPDR Bloomberg Barclays High Yield Bond ETF (JNK), iShares iBoxx $ Investment Grade Corporate Bond ETF (LQD), and the Invesco Senior Loan ETF (BKLN) have actually delivered positive total returns in that timespan (Figure 1).
Figure 1 – OXLC has underperformed most asset classes (Seeking Alpha)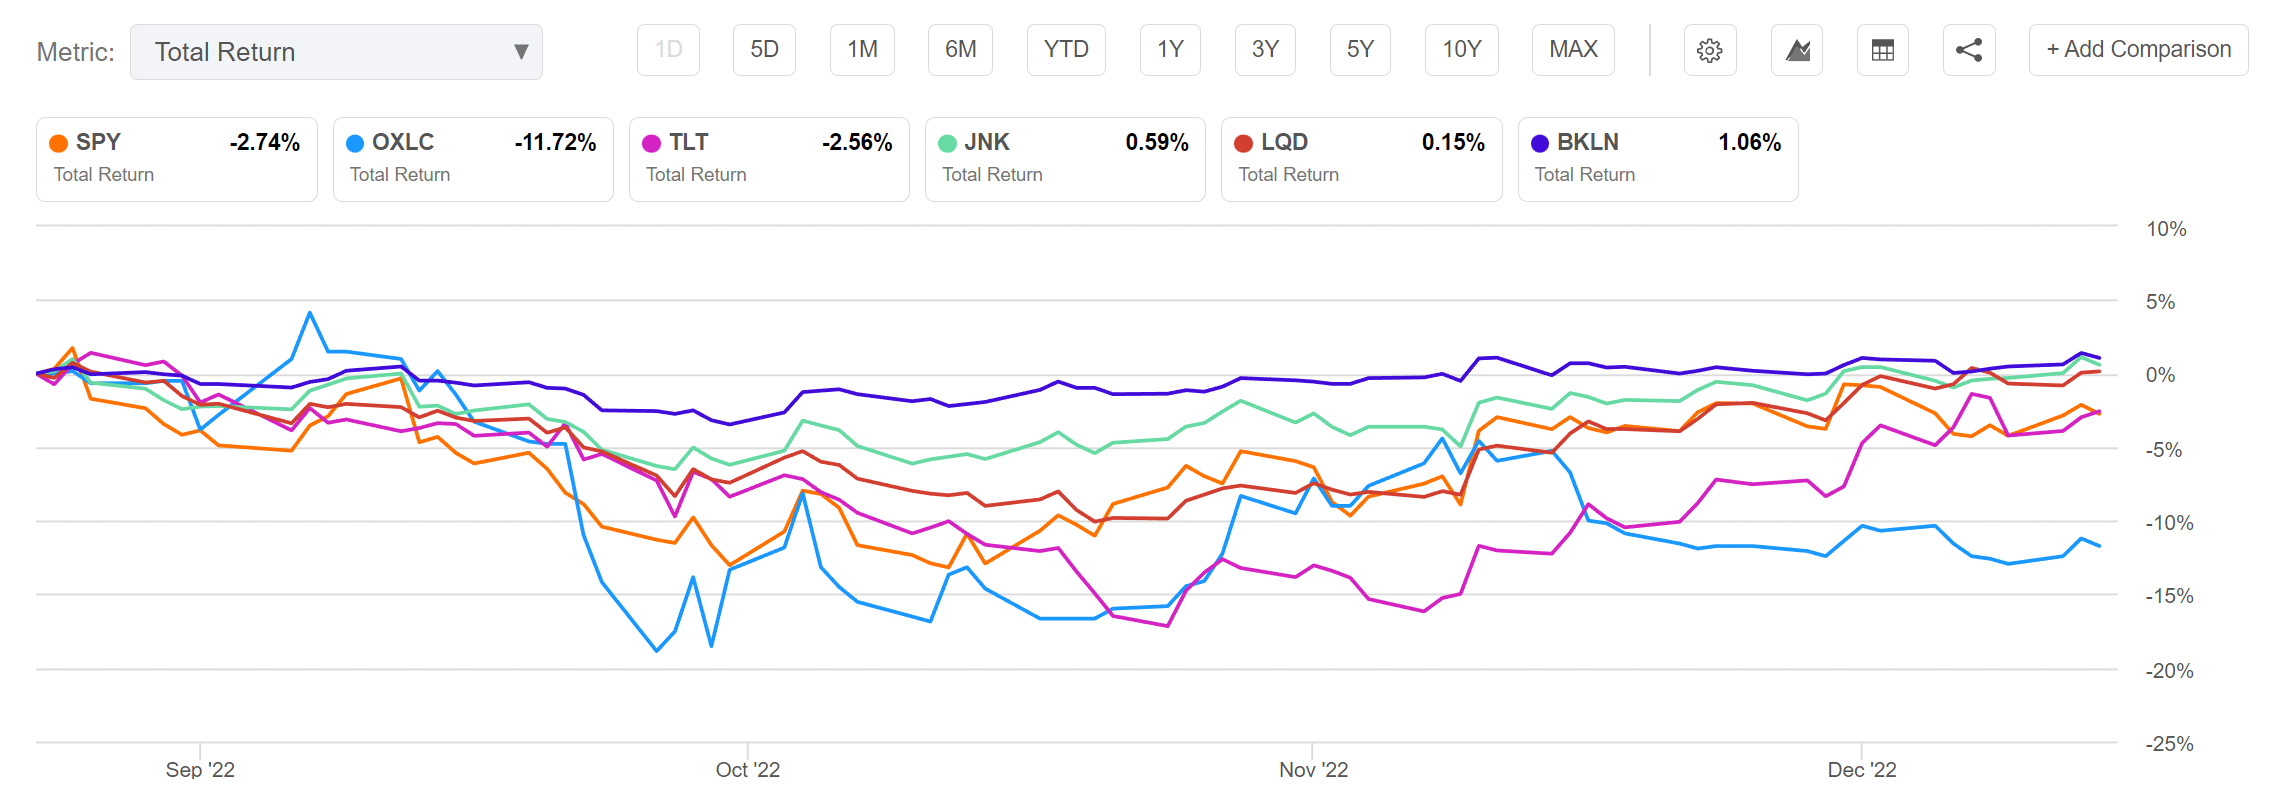
Credit Has Been Benign But OXLC Has Plunged
Admittedly, I had expected markets to be further along in the credit cycle and credit spreads to have widened significantly by now. However, credit spreads have actually stayed more or less constant in past few months, with the Morningstar LSTA US Leverage Loan TR Index essentially flat to August levels and down marginally YTD (Figure 2).
Figure 2 – Leveraged loans have traded sideways (morningstar.com)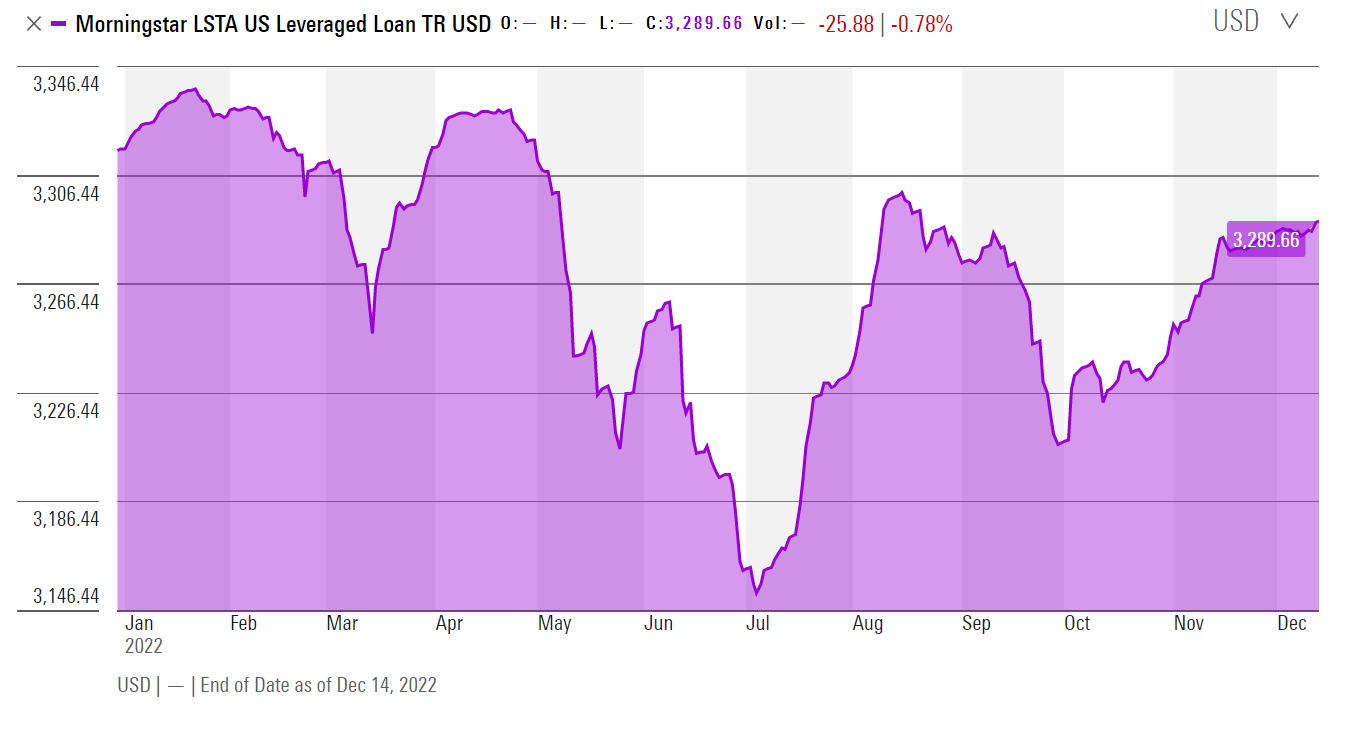
Recall, collateralized loan obligations (CLO) are structured credit products built upon baskets of senior loan obligations. If the underlying loans are performing well, how do we explain OXLC’s -11.7% total return since August and -29.0% total return YTD?
Understanding The CLO Structure
First, it is important to re-emphasize that OXLC primarily invests in CLO equity tranches, and not CLO debt tranches. While they may sound similar, their return profiles are vastly different.
Figure 3 shows a typical CLO capital structure. When bulls point to the strong historical performance of CLOs, for example, only 40 out of 4,322 rated CLO 1.0 (those issued before the Great Financial Crisis) have defaulted, they are referring to the debt tranches. CLO debt tranches are protected from losses by structural enhancements such as overcollateralization and interest diversion.
Figure 3 – CLO capital structure (guggenheiminvestments.com)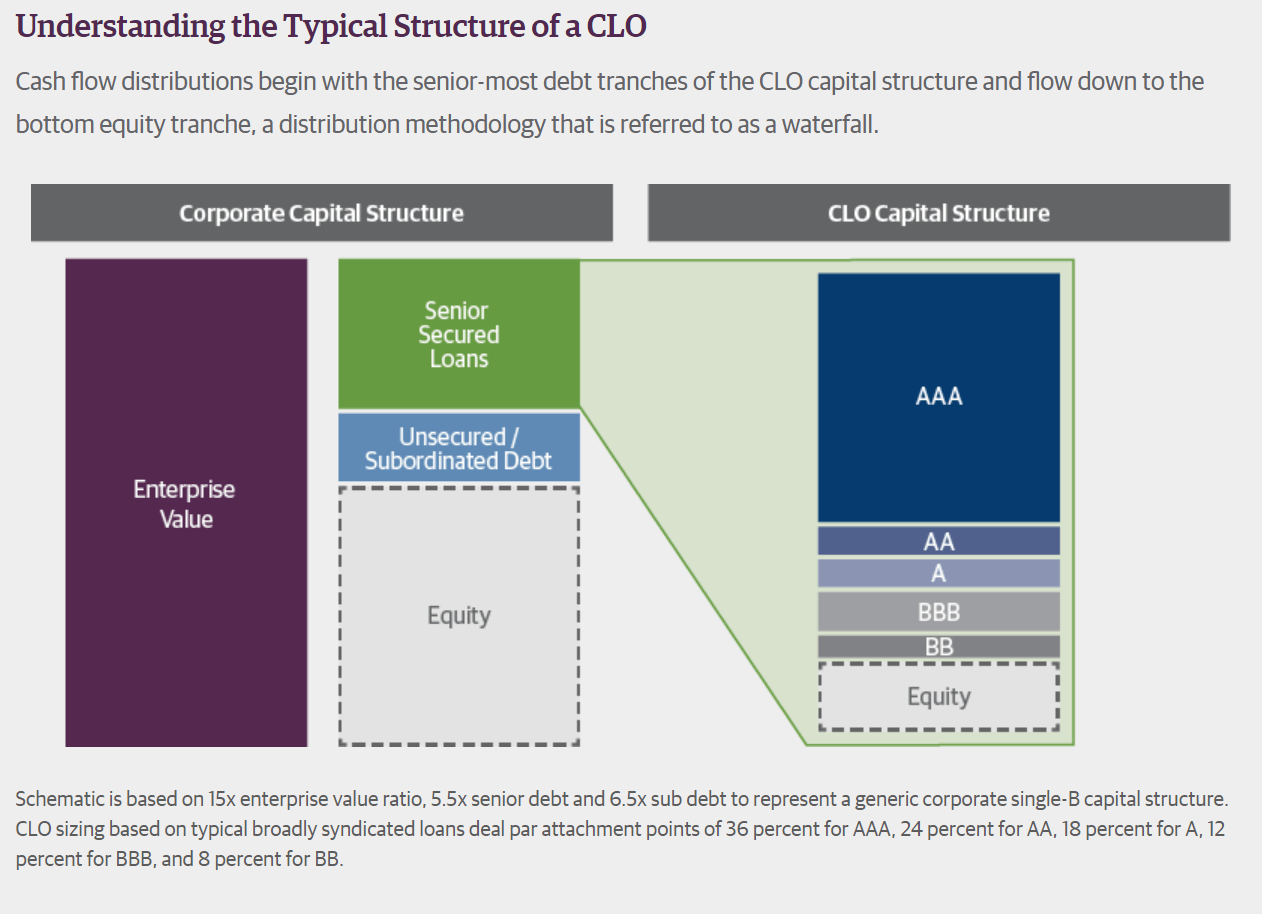
In contrast, CLO equity is in the CLO structure to provide protection for the senior debt tranches mentioned above. They are first in line to suffer losses and last in line to get paid.
Unrealized Losses Reflect Investor Risk Aversion
OXLC’s poor performance YTD could be a reflection of investors’ aversion towards holding risky CLO equity tranches, which has negatively affected the mark-to-market value of CLO investments.
For example, in the recent semi-annual report, management noted that,
For the nine months ending September 30, 2022, BB rated loan prices decreased 360 bps (or 3.62%), B rated loan prices decreased 746 bps (or 7.53%), and CCC rated loan prices decreased 1,135 bps (or 12.41%).
– OXLC management commentary, semi-annual report, September 30, 2022
With more senior CLO debt tranches falling 3.6% to 12.4% YTD, it is not surprising that the riskiest CLO equity tranches have fallen even more in value.
Investors Structurally Set Up To Lose
Another cause of OXLC’s underperformance is its cost structure. As I have mentioned previously, OXLC has a total expense ratio exceeding 10%. In fact, from the semi-annual report, we see the company’s total expense ratio have increased even further in fiscal 2023, to an eye-watering 12.57% annualized (Figure 4).
Figure 4 – OXLC expense ratio (OXLC Semi-annual report, September 30, 2022)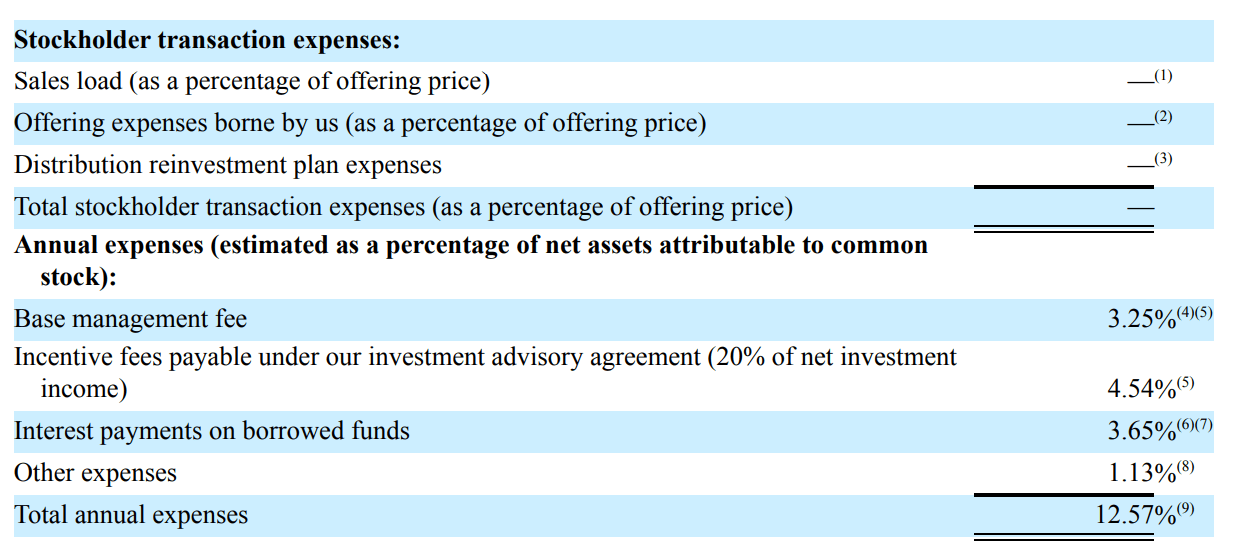
For many investors, earning 12.6% would be considered a very good year (the S&P 500 averages ~10% total returns per year). With such a high hurdle, how can equity investors expect to generate positive returns?
High Leverage Magnifies Returns
Furthermore, OXLC’s heavy use of leverage magnifies any losses (or gains) the portfolio experiences. As of September 30, 2022, OXLC had $200 million in debt and $287 million in preferred shares outstanding against $780 million in equity (Figure 5).
Figure 5 – OXLC capital structure (OXLC November investor presentation)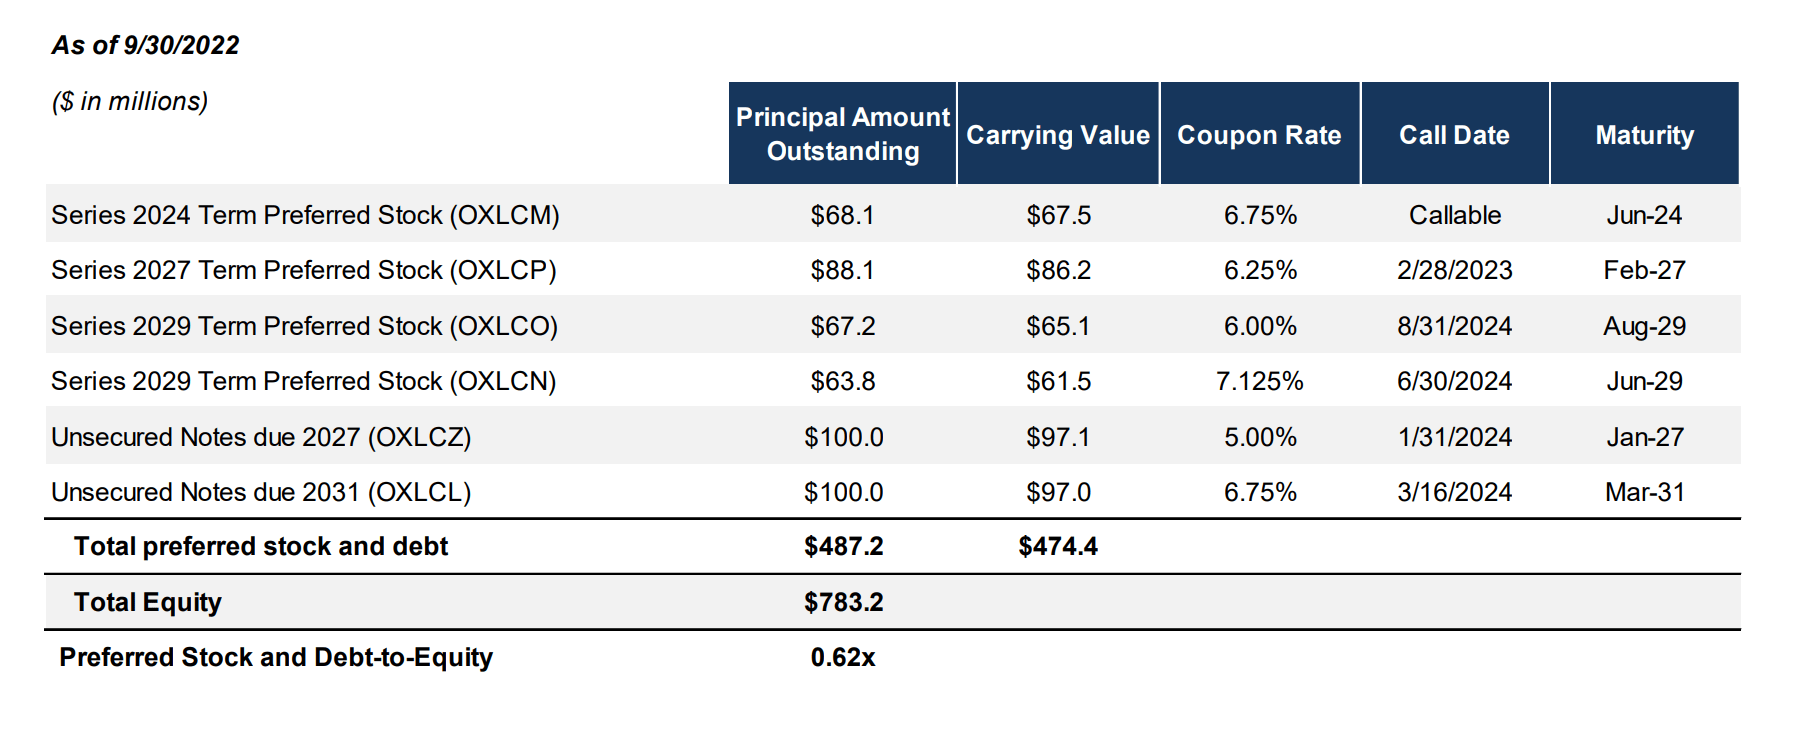
According to the fund’s own projections, OXLC’s heavy leverage can turn a modest portfolio loss of 10% into a disaster -19% loss for equity holders (Figure 6).
Figure 6 – OXLC hypothetical returns from leverage (OXLC Semi-annual report, September 30, 2022)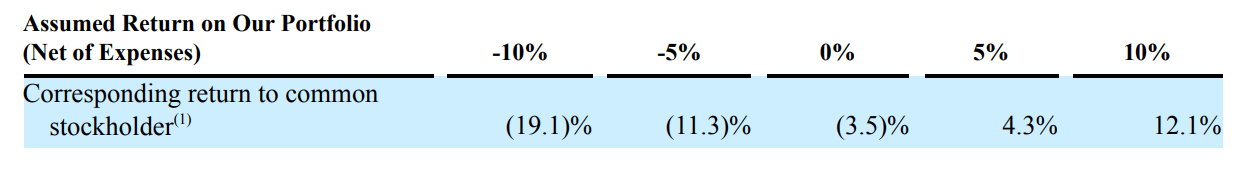
Recession Incoming
While credit has remained benign so far in 2022, the picture is expected to change as we head into 2023 as there are increasing signs of a recession in the next twelve months. For example, in October, the Conference Board released their recession outlook with a 96% probability of a recession in the next twelve months. This indicator has correctly predicted all 6 of the prior recessions since the 1970s (Figure 7).
Figure 7 – Recession probability at 96% (Conference Board)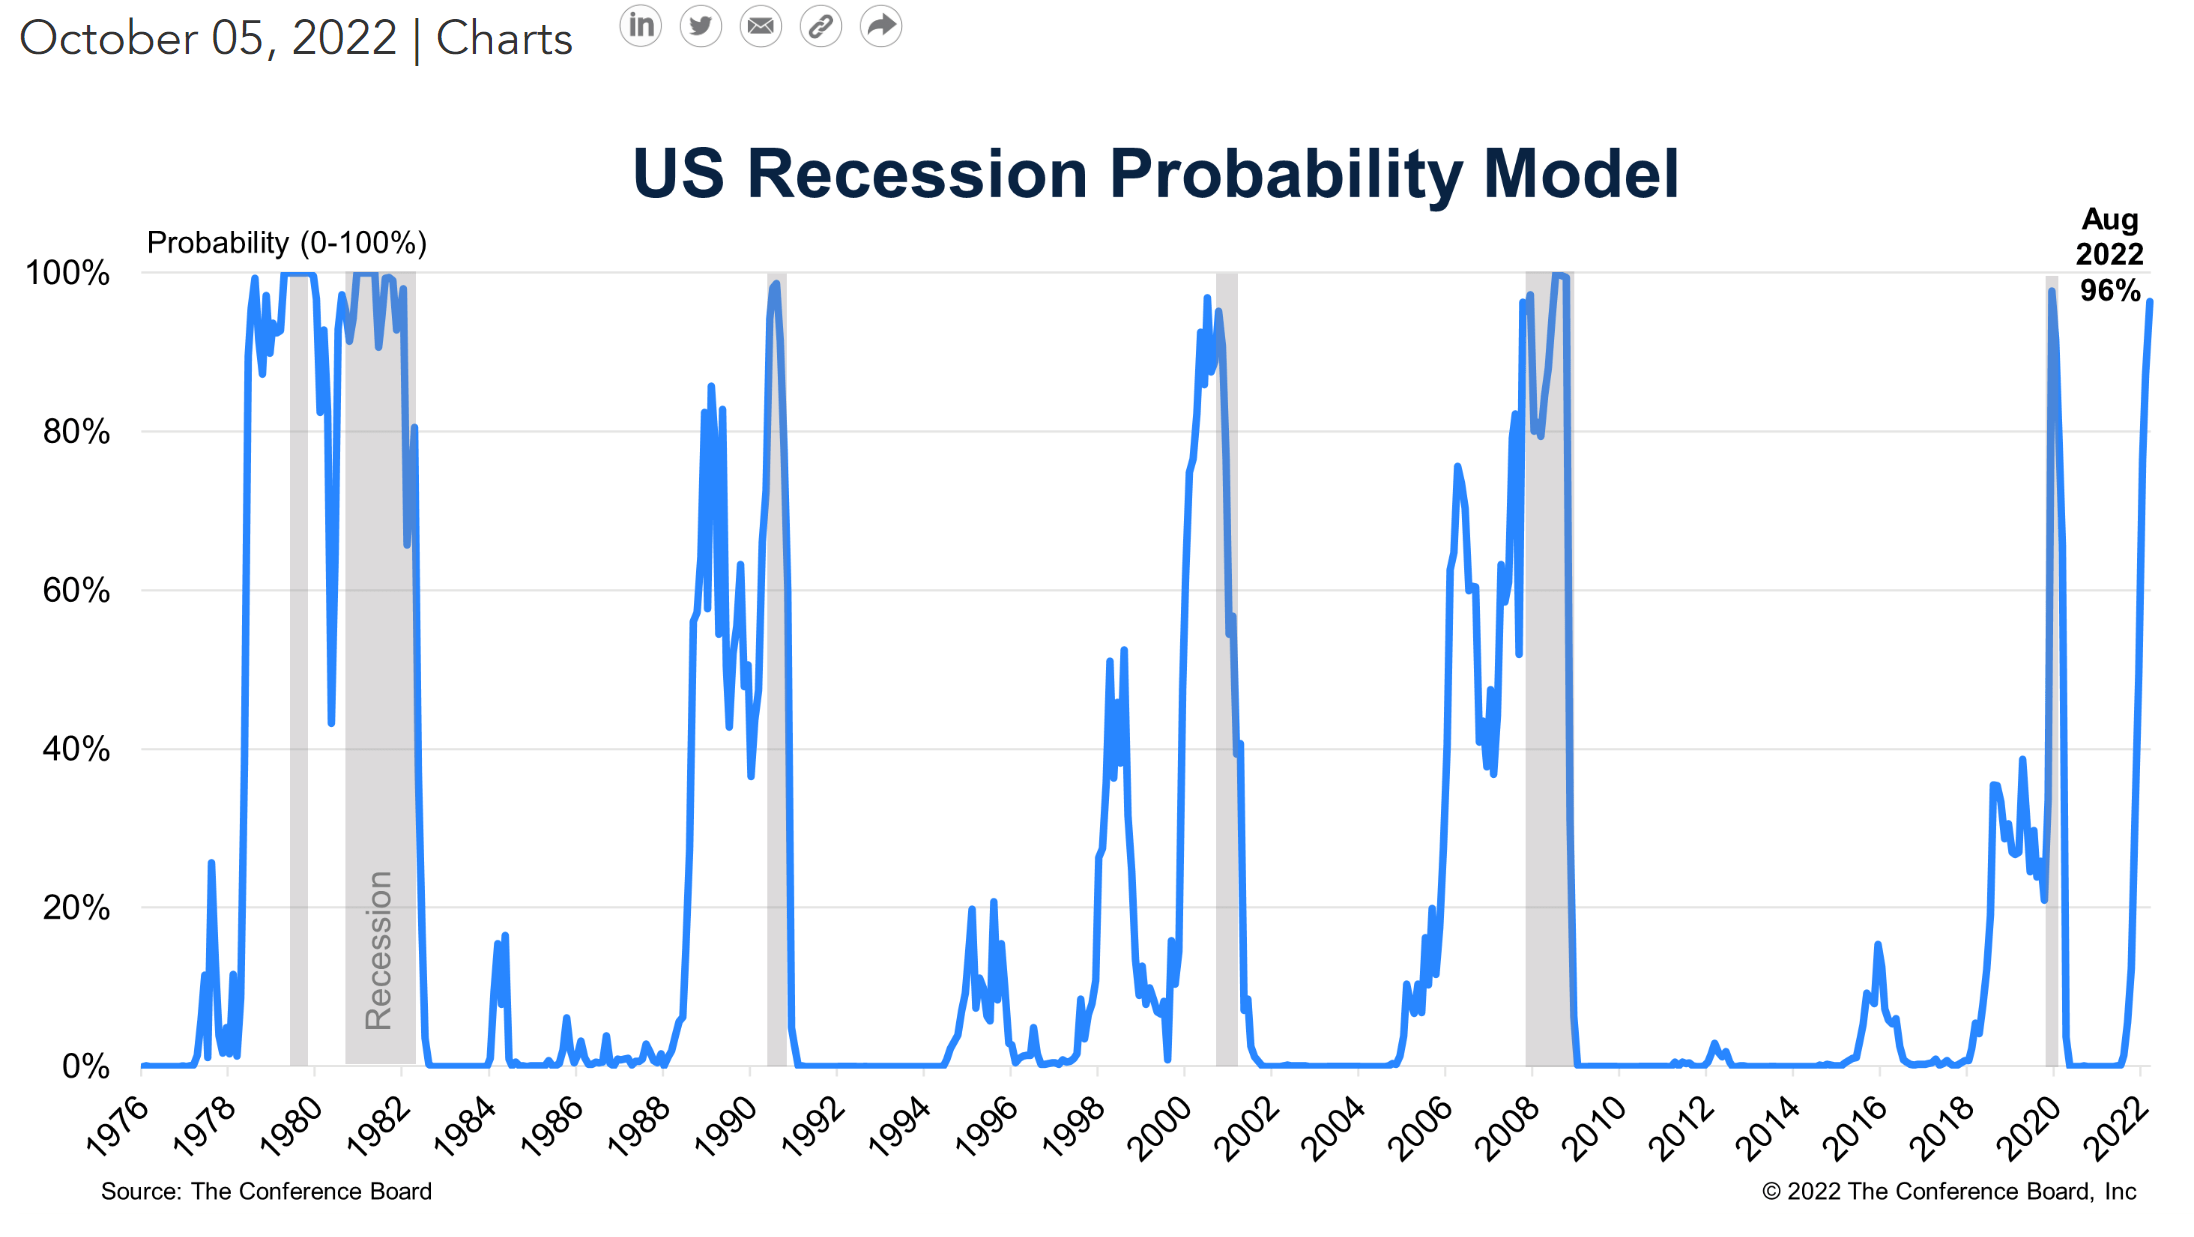
Similarly, the 3M-10Yr treasury yield curve, another strong recession predictor, has recently become the most inverted in years (Figure 8).
Figure 8 – 3M-10Yr yield curve most inverted in years (Axios)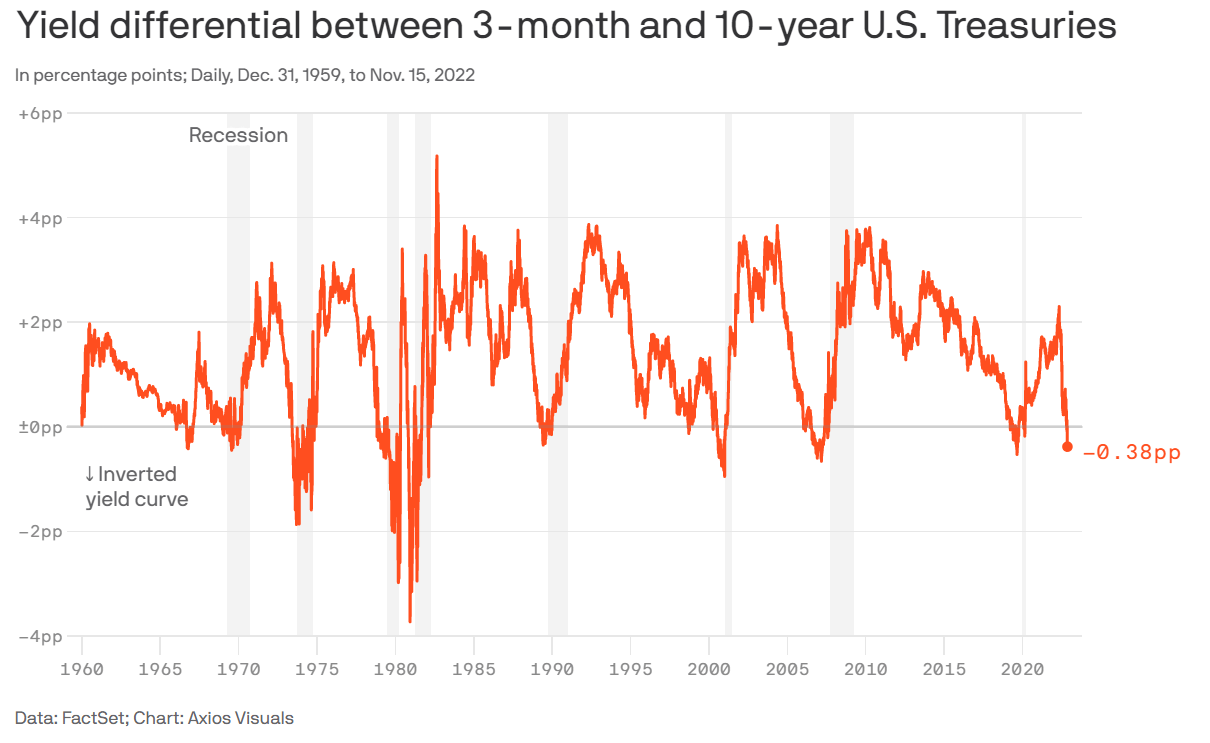
Finally, recent purchasing manager index (“PMI”) surveys from S&P Global suggest the U.S. economy is already in contraction:
“Business conditions across the US worsened in November, according to the preliminary PMI survey findings, with output and demand falling at increased rates, consistent with the economy contracting at an annualised rate of 1%.
Credit Is Already Deteriorating…
We can already see signs of credit deterioration within the senior loan space, as OXLC management highlighted in the semi-annual report:
Additionally, during 2022 the loan market exhibited an increase in default rates to 0.90% as of September 2022 compared with 0.29% at the end of 2021.
– OXLC management commentary, semi-annual report, September 30, 2022
…With Wall Street Expecting More Loan Losses In 2023
According to a recent Financial Times article, Wall Street analysts have been warning their clients of increasing leveraged loan defaults as the economy worsens:
Deutsche Bank expects the default rate on leveraged loans in the US to climb to 5.6 per cent next year – up from 1.6 per cent – before rising to 11.3 per cent in 2024. That would leave defaults close to all-time highs set in 2009.
Strategists at UBS forecast a default rate for low-grade loans of 9 per cent in 2023 alone.
– Financial Times article, “Defaults on US junk loans expected to climb as rate rises squeeze earnings”, December 13, 2022
Even bullish analysts like JPMorgan are expecting a rise in the default rate to 3.5% in 2023 and 4% in 2024, assuming an economic soft landing.
If OXLC performed so poorly in 2022 with benign credit conditions, how will it fare next year when credit is expected to deteriorate significantly?
Risk To My Call
Obviously, the upside risk to my cautious view is if the economy doesn’t enter a recession and credit conditions actually improve, then OXLC’s levered CLO equity positions may stage a dramatic rebound.
However, investors may be disappointed on the magnitude of any credit rebound, as OXLC has been busy diluting their shareholders by issuing new shares through an at-the-market (“ATM”) offering and through distribution reinvestments. In the quarter ended September 30, 2022, OXLC issued 8.1 million shares for net proceeds of $49.2 million, increasing the share count by 5.4%.
To understand why this is problematic, let’s go through a numerical example. Assume a fund has an asset worth $100, and 10 shares. The NAV / share is $10. If the asset is temporarily marked down to $80, then NAV per share trades down to $8. However, management is incentivized to maintain a high AUM (to earn high fees), so they issue 2 shares at $8 to bring in $16 in cash and take AUM back to $96 ($80 in asset plus $16 in cash). If the asset subsequently recovers to $100 in value, shareholders are worse off, as the NAV / share has been diluted to $9.67.
Conclusion
In summary, Oxford Lane’s poor performance in the past few months confirm my initial cautious stance. The fund’s outrageous 12.57% annualized expense ratio makes it extremely difficult for investors to generate decent returns. While investors are enticed with a 17.6% current distribution yield, after factoring in NAV declines, total return is -29% YTD. With the credit cycle set to enter a recession in 2023, I would avoid levered CLO equity funds like OXLC until credit spreads widen to unsustainable levels and the Fed is forced to cut rates to stimulate the economy.
Be the first to comment