

adaask
Both Owl Rock Capital (NYSE:ORCC) and FS KKR Capital (NYSE:FSK) are high yield business development companies (i.e., BDCs) (BIZD) that boast investment-grade credit ratings. In this article, we will compare them side by side and offer our take on which one is a better buy.
Owl Rock Capital Vs. FS KKR Capital – Balance Sheet
As was already stated, both boast investment grade credit ratings of Baa3 (Stable) or equivalent.
ORCC boasts considerable liquidity of $1.7 billion (~15.4% of its total enterprise value) that accompanies its leverage ratio of 1.2x to give it a solid balance sheet. Meanwhile, ~50% of ORCC’s liabilities have floating interest rates, giving it moderate exposure to rising interest rates that it more than offsets through its investment portfolio (more on that in a little bit)
Meanwhile, FSK has a slightly lower leverage ratio of 1.15x, with liquidity of $2.7 billion (~19.1% of its total enterprise value). FSK has just under 50% exposure to floating interest rates, also giving it moderate exposure to rising interest rates that it more than offsets through its investment portfolio.
While both appear to be in solid shape, we give FSK the slight edge here given that its liquidity is superior to ORCC’s on an absolute and relative basis, it has slightly less leverage, and slightly less of its debt is floating interest rate.
Owl Rock Capital Vs. FS KKR Capital – Investment Portfolio
ORCC’s investment portfolio is quite conservatively positioned, with 88% of it being invested in senior secured debt. Furthermore, it is very favorably exposed to rising interest rates, with 99% of its debt invested in floating interest rate securities, meaning that ~90% of its overall investment portfolio is positively exposed to rising interest rates. When compared to its slightly under 50% debt exposure to floating interest rates, ORCC is very well positioned to benefit from rising interest rates. Management emphasized this on its Q2 earnings call, stating:
we will see a meaningful benefit from rising rates starting in the third quarter. As you will recall, at the beginning of the second quarter, many of our borrowers reset their interest rate election to three months LIBOR, which was approximately 1% at the time and slightly above the average floor in our portfolio. So there was a limited benefit to our interest income in Q2.
The second quarter ended with three months LIBOR at 2.3% which meaningfully increase the base rate for those borrowers. Holding all else equal had our base rates as of June 30, has been in effect for the entirety of the second quarter, we estimate NII would have increased $0.02 per share, to a total of $0.34 per share in Q2. Additionally, borrowers will continue to reset their interest rate elections throughout the third quarter which will continue to benefit the yield on our portfolio and be accretive to NII.
On top of that, ORCC’s underwriting performance has been stellar thus far, with only 0.1% of its investments at fair value currently on non-accrual. This bodes well for its ability to weather an economic downturn, which appears increasingly likely.
Meanwhile, FSK has 93% of its portfolio invested in senior secured debt or asset-based finance investments and 87% of its debt investments in securities with floating interest rates. While this is not as good as ORCC’s, it is still pretty strong relative to its less than 50% debt exposure to floating interest rates. Management elaborated on how rising interest rates benefit their cash flow statement on their Q2 earnings call, stating:
During the third quarter, we expect to benefit from the rising interest rate environment by approximately $0.04 per share as existing portfolio company interest rate contracts began resetting at higher levels. And while there is a detailed breakout of how every 100 basis points of interest rate increases is expected to positively impact our investment income provided in our 10-Q. For planning purposes, our high-level view is that every 100 basis point move in short-term rates could increase our annual net investment income by up to $0.26 per share, which equates to approximately $0.06 per share per quarter.
FSK’s underwriting performance continues to be decent, but is lagging considerably behind ORCC’s, with non-accruals at fair value of 2.9%. That said, we expect this number to improve moving forward – barring a meaningful economic downturn – given that KKR originated loans are becoming an increasingly large percentage of the total investment portfolio and the non-accrual rate among those loans is only 0.5% of fair value.
Overall, we give the edge to ORCC here as its non-accruals are considerably lower than FSK’s and its exposure to rising interest rates is also considerably more favorable.
Owl Rock Capital Vs. FS KKR Capital – Dividend Safety
ORCC’s dividend is currently barely covered by net investment income, as its second quarter net investment income was $0.32 compared to its $0.31 dividend payout. Management believes this tight coverage is likely just a short-term issue due to receiving very little repayment income thanks to the fact that the M&A environment is seasonally quieter. Furthermore, its income is likely going to rise in Q3 due to rising interest rates.
FSK, meanwhile, pays out a varying dividend each quarter. As a result, its payouts will likely be more volatile than ORCC’s, but they are also generally considerably higher.
Owl Rock Capital Vs. FS KKR Capital – Track Record
Since both have traded publicly, FSK has outperformed ORCC by a considerable amount. This outperformance is even more pronounced since the bottom of the COVID-19 crash:
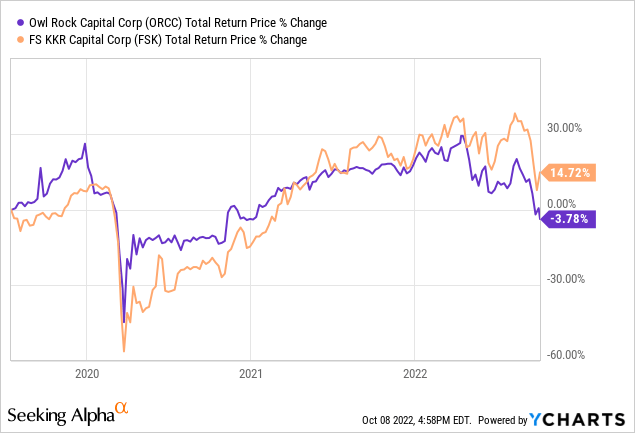
Furthermore, with FSK recently unlocking synergies and initiating a buyback in the wake of completing a merger and its investment portfolio increasingly being filled with KKR-underwritten loans, we think that FSK has even more potential to improve its performance moving forward.
Owl Rock Capital Vs. FS KKR Capital – Valuation
Both FSK and ORCC look very cheap across a variety of metrics on both an objective and historical basis:
| Valuation Metric | FSK | ORCC |
| P/E | 6.35x | 7.52x |
| P/E (3-Year Average) | 7.56x | 10.46x |
| Dividend Yield | 14.37% | 11.75% |
| Dividend Yield (3-Year Average) | 13.28% | 9.74% |
| P/NAV | 0.68x | 0.74x |
| P/NAV (3-Year Average) | 0.74x | 0.94x |
That said, from the above data metrics we conclude that FSK is clearly cheaper than ORCC on an objective basis whereas ORCC is cheaper relative to its own historical averages. This is largely due to the fact that FSK has undergone considerable transformative strides in recent years to improve its underwriting and operating efficiencies, so its multiple has improved over time on a normalized basis. Overall, we give FSK the slight edge here, given that it is cheaper on an objective basis.
Investor Takeaway
Both of these BDCs offer investors incredibly high dividend yields, deep discounts to NAV, and positive exposure to rising interest rates along with an investment grade balance sheet. However, it is important to keep in mind that – despite their heavy concentration in senior secured debt – their counterparties are smaller and weaker businesses. As a result, in the event of a recession, both are likely going to see non-accruals and defaults increase.
Overall, we rate both as Strong Buys at their current valuations given how steep the discounts are to NAV which give them considerable margins of safety. We slightly prefer FSK at the moment due to the fact that its balance sheet is slightly stronger in our view and – while its underwriting performance is currently inferior – we expect it to improve dramatically moving forward thanks to KKR playing a large role in underwriting new loans. Finally, with FSK we get a greater discount to NAV and a higher earnings and dividend yield. Still, for investors looking for diversification in the BDC sector, we think both of these companies are attractively priced right now, so there is nothing wrong with owning both.
Be the first to comment