

Mario Tama/Getty Images News
My today’s article is supposed to provide an update on the ALPS | O’Shares U.S. Quality Dividend ETF (BATS:OUSA), an investment vehicle offering exposure to 100 dividend-paying U.S. equities exhibiting remarkable quality characteristics. OUSA has a dividend yield of 1.87%, with an expense ratio of 48 bps.
The previous time I covered OUSA was in June 2021 when I assigned it a Hold rating owing to its mixed past performance and a too-low yield; I also highlighted that the ETF had neither growth nor a value tilt, though with most holdings having solid profitability characteristics, proving the strategy is capable of selecting high-quality players.
OUSA delivered a negative one-year total return of around 2%, which is the worst result compared to its peers Pacer US Cash Cows 100 ETF (COWZ), WisdomTree US Quality Dividend Growth ETF (DGRW), and Global X S&P 500 Quality Dividend ETF (QDIV). The iShares Core S&P 500 ETF (IVV) which represents the U.S. market bellwethers is the weakest performer in the group owing to the fact it was most exposed to the growth premia issue (mostly via its tech investments) that engendered compression of multiples. The likely reason for COWZ finishing higher than the selected peers and especially OUSA is that its value-focused portfolio is pronouncedly overweight in energy stocks (~16.5% as of end-March), which have been on a tear, supported by the historical tightness of the hydrocarbon market.
Seeking Alpha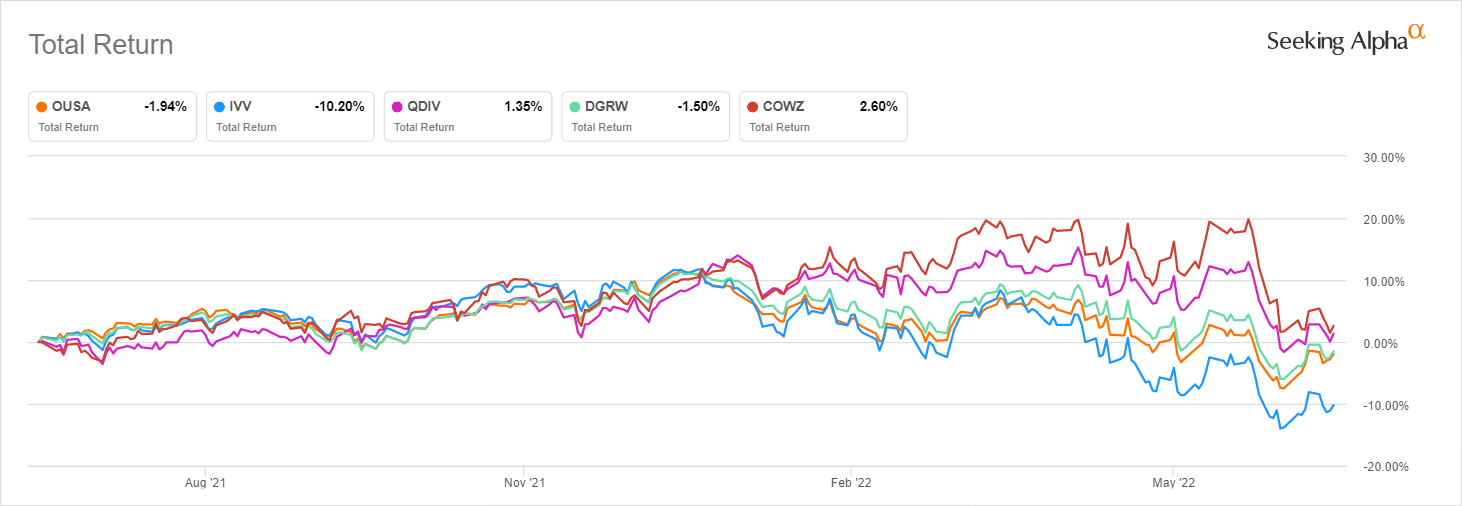
Today, I see no reason for an upgrade, principally because of the OUSA portfolio’s relative overvaluation. I appreciate the ETF’s exposure to the quality factor, but since I believe quality must be properly mixed with value right now due to the interest rates issue and supervening capital scarcity concerns, the fund is likely a suboptimal choice in the current environment.
A Few Minor Portfolio Changes But A Massive Shift In Valuation
On June 21, it was announced that O’Shares completed the “strategic transaction with SS&C Technologies, which owns SS&C ALPS Advisors.” In the wake of the reorganization, the ETF was renamed, with the reference to ALPS added. According to the press release, the proprietary index OUSA has been tracking remained the same, so the tectonic shift in portfolio composition did not happen.
As a reminder, to qualify for the index that lies at the crux of OUSA’s investment strategy, the O’Shares U.S. Quality Dividend Index, a constituent of the S-Network US Equity Large-Cap 500 Index must meet a long list of criteria; it is assessed whether it has exposure to the “quality, low volatility, dividend yield and dividend quality” factors. Those that managed to pass all the screens are weighted using market capitalization and the aforementioned factors. More details can be found in the methodology.
While evaluating historical performance, please keep in mind that before 1 June 2020, the fund also had a different name and tracked the FTSE USA Qual/Vol/Yield Factor 5% Capped Index.
OUSA Has A Valuation Problem
Although OUSA’s portfolio remained comparatively homogeneous, with only a few deletions (e.g., AT&T (T)) and CVS Health (CVS)) and additions (e.g., Gilead Sciences (GILD)), and healthcare replacing IT as the key sector (close to a quarter of the net assets vs. 22% a year ago), the ETF now has a valuation problem. Let us explain.
A few valuation techniques can be applied when it comes to ETF analysis, but I prefer to harness the power of the Quant data in the first place. Specifically, what certainly surprised me is that despite the comparatively stable portfolio (the newcomers account for less than 6%) as said above, OUSA’s valuation has noticeably deteriorated since June 2021. We see the share of stocks with at least a B- Quant Valuation rating declined from 34% to just 7.3%. Meanwhile, the weight of those with symptoms of overappreciation surged to 66%. In my view, this is the primary risk weighing on the fund’s returns in the short term. Most of the stocks with lofty multiples are from the healthcare and IT sectors that traditionally have richer valuations compared to the cyclical ones.
The most comparatively expensive stocks in the OUSA portfolio. (Created by the author using data from SA and the fund)
For investors who prefer to look at companies’ valuation through the lens of the P/E ratio, I should note that its weighted-average Forward P/E ratio is ~19.3x. Hopefully, all the holdings are forecast to deliver profits next year, so I made no adjustments to arrive at this figure. For better context, the last twelve months’ WA P/E is around 22x. IVV shows an 18.87x multiple (please take notice that methodology differences can skew the final figure and thus impact compatibility). To provide slightly more color, ~11% of the IVV portfolio has adequate valuation (no less than a B- grade), while almost the same share as in the case of OUSA is overvalued, around 66%.
For investors who are more into cash-centered methods, close to 47% of the OUSA holdings (financials were removed for obvious reasons) have net operating cash flow yields below 5%. Again, this level can be considered rather pricey.
It is pertinent to remark that there are no cash-burning companies in the portfolio, so this is clearly a tailwind for its dividend should recession finally arrive as self-sufficient companies are less sensitive to the capital scarcity issue; anyway, this by no means guarantee superior returns.
OUSA’s Quality Is Nothing Short Of Exemplary. This Explains Premium Valuation But Does Not Guarantee Upside
Speaking of the quality factor, here, OUSA certainly deserves high praise.
First, all the companies in its mix are profitable, and non-financial ones are both cash flow- and FCF to Equity-positive. Second, about 60% have EBITDA margins above 25%. Third, we see fairly decent FCFE margins in most cases, with the median standing at 14.5%. Just two companies have these margins below 1%, namely Walmart (WMT) and Commercial Metals Company (CMC).
Overall, there are only two stocks with a B Profitability rating, namely Hormel Foods (HRL) and Clorox (CLX).
Seeking Alpha Seeking Alpha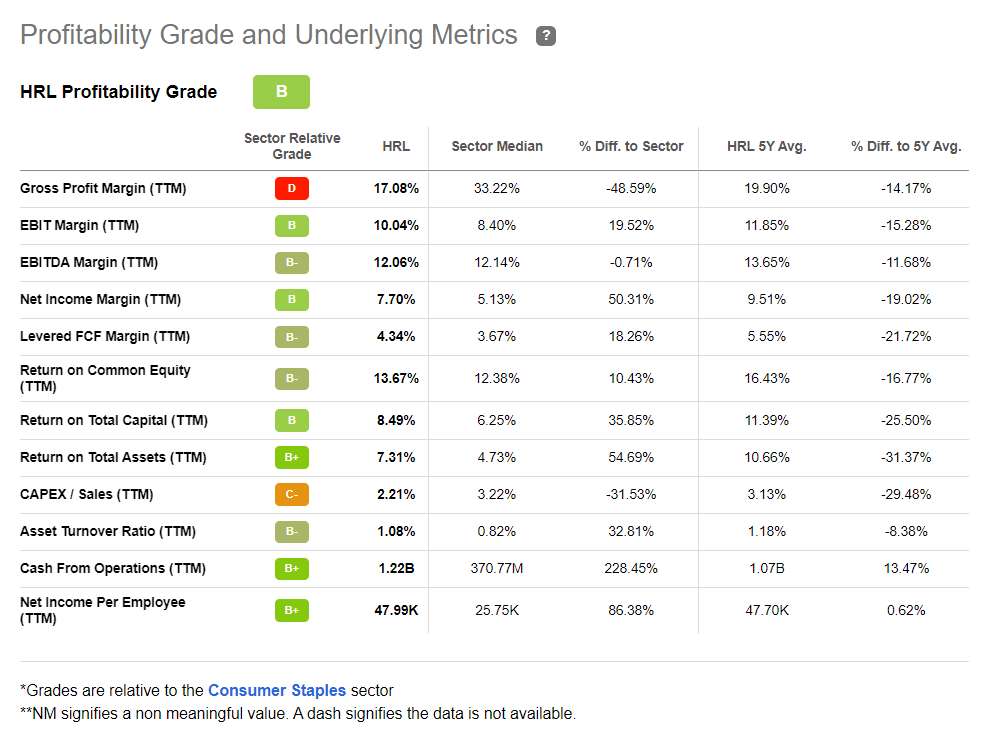
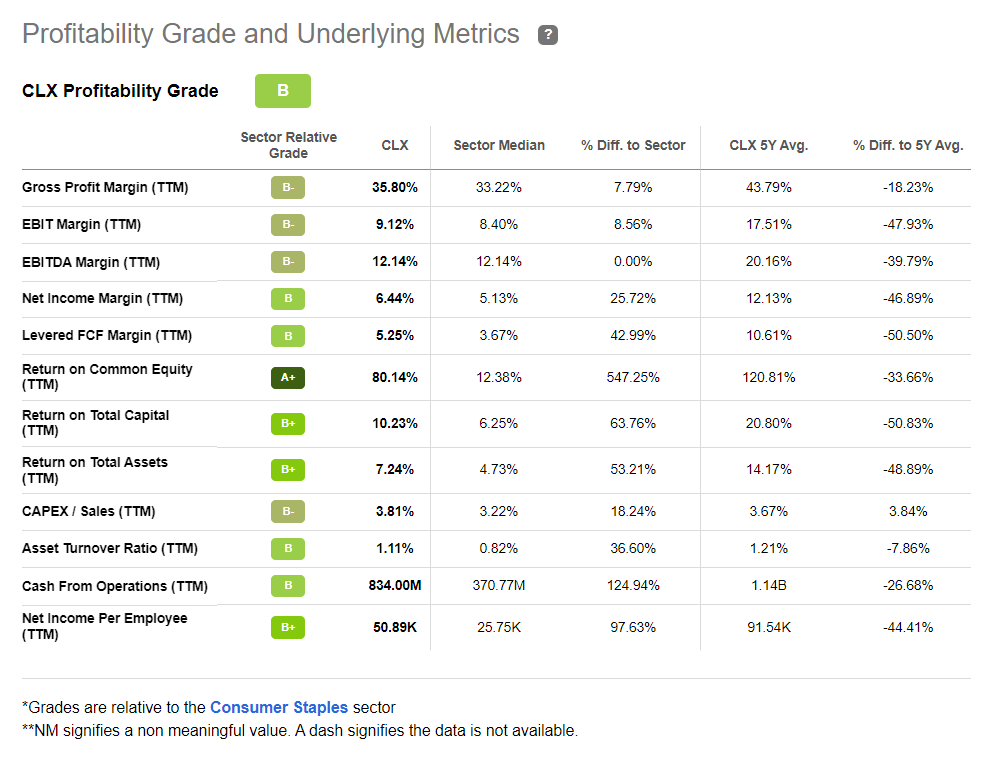
Four have B+ ratings, while the A league accounts for ~98.4% of the portfolio. For better context, IVV has ~87.3% allocation to such stocks.
Final Thoughts
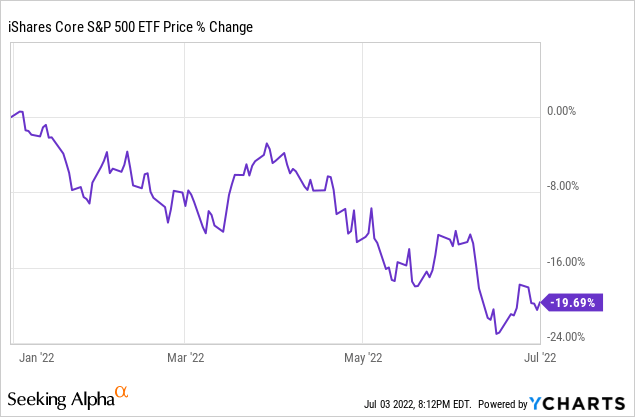
With IVV down by around 20% since the beginning of choppy 2022, investors might start positioning for the blue chips to rebound, flocking to battered growth bellwethers that are arguably becoming attractive. That is to say, there is an illusion that the rotation out of the value factor-heavy funds is the promising strategy at this juncture.
My point here is, though bubble-like valuations have been removed in most corners of the market, there are still risks ahead for investors as higher rates and subsequent capital scarcity have not gone anywhere. In this regard, a balance of value and quality is needed, probably with a tilt towards the former, while OUSA is overweight in the latter, with most holdings priced richly.
Additionally, the fund is steering clear of cyclical sectors like materials and energy that are ignored by its underlying index. This strategy might result in lower volatility and a more stable dividend less sensitive to recessions in the long term, but shorter-term, specifically this year, OUSA has missed a solid share of gains stemming from the oil price rally (bolstered by the energy crisis).
And also, its dividend yield of 1.87% is only marginally higher compared to IVV, and valuation is clearly among the factors dragging the yield down. On a side note, its monthly distributions do not demonstrate a trend a DGI investor would appreciate. In sum, OUSA is a Hold.
Be the first to comment