


Henrik5000
I view investing as a constant measure of worth against opportunity cost. The opportunity cost consists of the next best opportunity and is always in flux. In times like today when the entire market has sold off, opportunity cost is high because so many investments are cheap. As such, the criteria for inclusion in the portfolio are more stringent than normal.
This is why we have recently sold 2 strong stocks in Whitestone (WSR) and Healthcare Trust of America (HTA). While each presents a healthy forward return potential, other stocks surpassed them in relative opportunity.
Having a pre-existing gain or loss in a stock is irrelevant to its going forward returns and should only be considered with regards to taxation. In investing 2CHYP (2nd Market Capital High Yield Portfolio), I am careful to neither fall in love with winners nor get mad at losers. Each stock is continuously reassessed – its forward expected returns versus its opportunity cost.
It is by this method that we keep it perpetually invested in whatever is most opportunistic today. Tomorrow is a new day and tomorrow it will be invested in whatever is most opportunistic then. With updates of this nature, it cannot get stale and its performance is just a matter of whether I am right or wrong about the forward returns of the stocks within the portfolio. In that regard, allow me to share with you the reasoning behind why I have chosen these particular stocks.
In each monthly portfolio review I like to take a different angle and this month’s update will focus on growth. Specifically, I want to focus on how much each stock is growing, where that growth is coming from and where my view differs from consensus.
Here is the portfolio heading into the 2nd half.
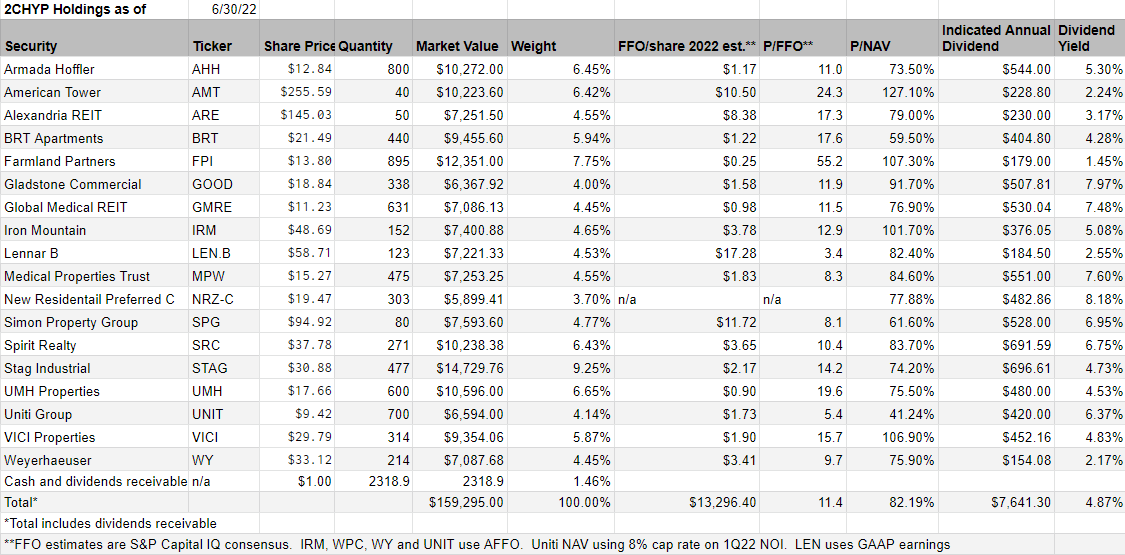
Portfolio Income Solutions
There are a few things that I think are key differentiators.
- The average stock in the portfolio is trading at 82% of net asset value. Getting properties at a discount to their private market value enhances the cashflow return on each dollar invested.
- $159,295 in market value is generating $13,296 in FFO annually. That is an FFO yield of 8.3%.
- The dividend yield, while high at 4.87% is only just over half of the FFO yield allowing these companies to retain a substantial amount of cashflow for growth. Retained cashflow is of particular importance at times like this when the market being cheap makes equity issuance prohibitively expensive.
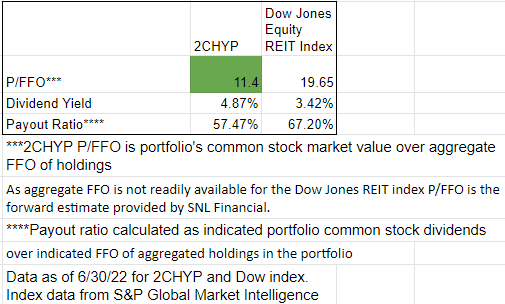
I believe this stacks up quite favorably against the REIT index. P/FFO of the portfolio is much lower at 11.4X compared to 19.65X for the REIT index.
Portfolio Income Solutions
I do not blindly buy value for the sake of value, but rather achieved the value through a combination of buying stocks that are undervalued and avoiding those that are overvalued. In this way, we can achieve similar or better fundamental growth rates, but at a higher going in yield.
The advantaged portfolio metrics come from a summation of the individual stocks and it is the stock selection that is the bread and butter of 2CHYP, so let’s get to it.
Armada Hoffler (AHH)
Armada Hoffler is going to have particularly lumpy growth due to timing of developments. Their in-progress construction is enormous relative to the size of the company so during construction it will be a drag on earnings, but as these developments complete and lease-up, the growth should be substantial. If one merely looks at consensus numbers, it appears as though AHH has little to no growth.
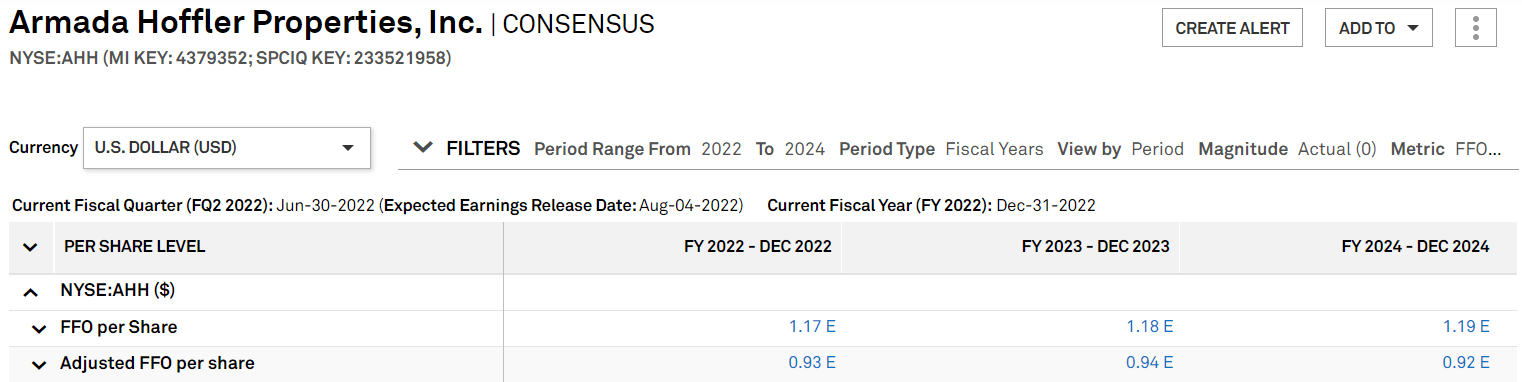
S&P Global Market Intelligence
What this actually reflects, however, is negative growth from developments as capital is spent on them while they are not yet generating return offsetting the strong organic growth in their retail and multifamily properties.
The cashflows from developments such as the T. Rowe Price (TROW) headquarters will primarily start flowing in 2024 and 2025, at which point the growth should be quite substantial.
There has been an ongoing question as to how AHH will pay for the developments and they just answered it in July with the sale of a couple triple net properties at 4% cap rates. I didn’t know 4% cap rates still existed with the rise in interest rates, but the excellent gain on sale makes for a cheap cost of capital to finance the construction.
American Tower (AMT)
AMT’s market price held up quite nicely in July while the rest of the investment world fell out of bed. The strength, I believe was the result of proof of concept within the tower industry as the major carriers collectively put massive investment into 5G equipment on macro towers.
It firmly placed 5G as a growth factor for tower REITs where it had previously been viewed as a potential risk of small cells obsoleting macro towers.
This, in my opinion, solidifies the organic growth story of AMT. In addition to a few percentage points of rent rollups on organic billings, AMT can add in lease amendments as carriers place 5G equipment on their towers. 2022 has been a slow growth year for AMT which caused its FFO multiple to plummet early in the year, allowing us an opportunity to get in.
With growth rates restored to the impressive historical level, I think AMT’s multiple will expand. As a near term catalyst, DISH has ramped up its tower rentals in an effort to truly become a major player.
Alexandria Real Estate (ARE)
Alexandria is the leading owner of life science labs with a dominant market share in the major research hubs of the U.S. From this position it has access to 2 significant sources of growth:
- Organic rent growth with 30% positive roll-ups anticipated on average as leases expire
- Development at high cap rates to meet the expanding demand for top tier lab space
With a staggered lease expiry schedule, the first results in smooth growth, while the 2nd is lumpier depending on delivery dates. Both sources, however, are substantial, netting to what I calculate at double digit annual growth for the next 5 years.
This differs from market consensus in that the market is bearish on the space due to the pullback in venture capital money to start-ups. While it is true that the reduced starter capital is reducing lab demand, ARE works overwhelmingly with mega-cap tenants that are well established and have their own sources of capital. The market pullback merely provides a nice value entry into a strong company like ARE.
BRT Apartments (BRT)
Residential real estate values of all kinds have expanded recently which has helped the entire REIT sector, but BRT is outperforming as a result of being very high leverage going into the appreciation.
So while other multifamily REITs got appreciation on assets that were maybe 140% of market cap, BRT got appreciation on assets that were many times its market cap. This amplified the value appreciation as felt by investors in the stock via somewhat explosive growth in NAV and FFO/share.
Further, BRT is locking in the appreciation by selling off assets at high prices and using the proceeds to consolidate joint ventures and reduce leverage. Coming out the other side of this transition, BRT’s transparency will be greatly enhanced and the market will be more able to see its asset value.
While BRT’s stock price is up quite a bit, the price growth did not keep up with growth in NAV resulting in it still trading at less than 60% of asset value.
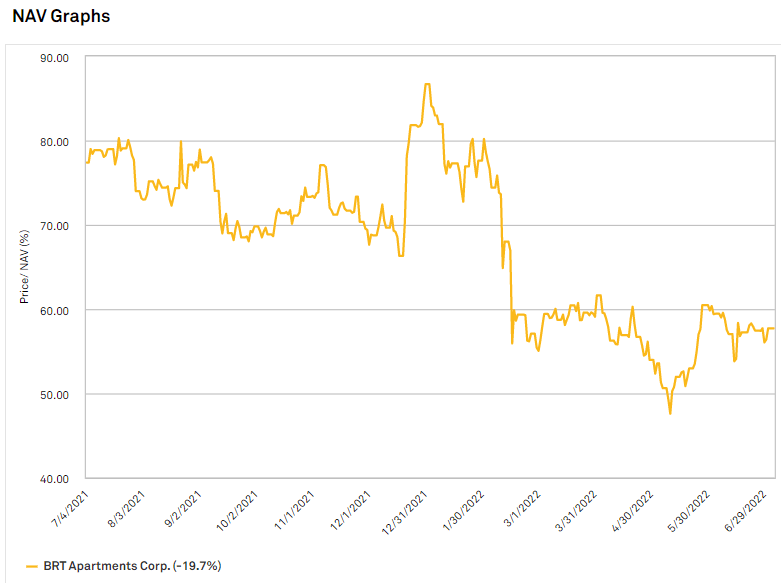
S&P Global Market Intelligence
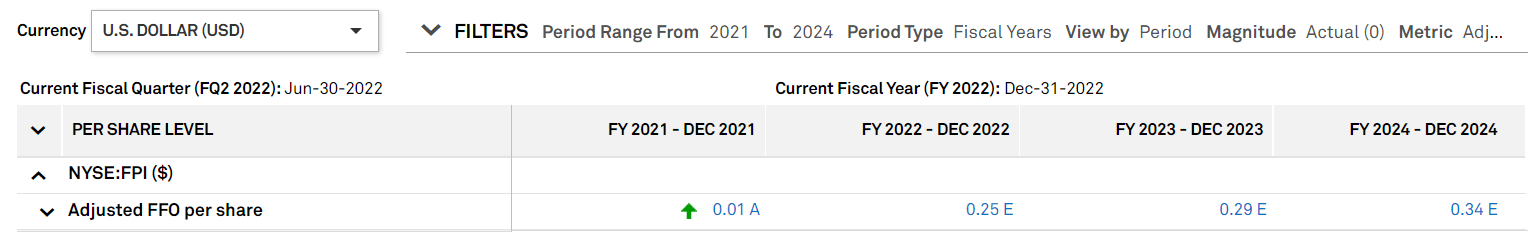
Farmland Partners (FPI)
FPI has recently changed its game plan to be more in-line with what the market demands. It had previously been an NAV growth play with intentionally high leverage, but with REITs, the market demands FFO/share growth.
Pittman has announced on conference calls that he intends to preserve the NAV growth aspects but pivot the strategy a bit to facilitate FFO/share growth. 3 things are helping FFO/share grow:
- Conversion of the expensive preferred
- Revival of the high interest rate loan program which provides revenue streams of about 7% overcollateralized by farmland
- Rental rates ticking up somewhere around 10% to 20%
The first 2 are strategic pivots while the 3rd is just a reflection of the environment. In total they result in rather significant AFFO/share growth going from $0.01 in 2021 to an anticipated $0.34 in 2024.
S&P Global Market Intelligence
I still see the AFFO portion of FPI’s return to be somewhat meaningless. The real gains come from NAV accretion. In August, the USDA will come out with its new land values and I anticipate it will show about a 10% increase from last year. That increases FPI’s NAV by about $120 million.
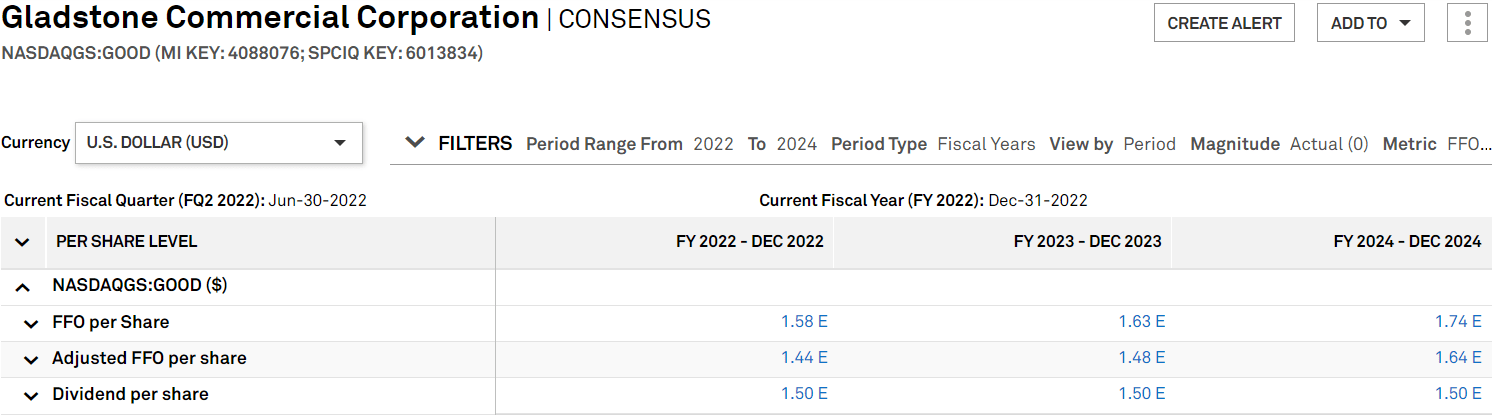
Gladstone Commercial (GOOD)
I don’t see GOOD as much of a growth stock. Its dividend payout ratio is fairly high, and while fully covered by cashflows it does not leave much capital for growth. Gladstone, the manager of GOOD has strong underwriting capabilities which does allow GOOD to acquire at slightly better than fair cap rates.
Often these high cap rate acquisitions can lead to growth, but presently, GOOD’s market price is sufficiently depressed that capital raising could prove challenging.
I suspect, GOOD will continue to trickle in acquisitions when opportunistic, but the volume is unlikely to be sufficient to move the needle.
I differ from analyst consensus estimates in that I think growth will come in significantly lower.
S&P Global Market Intelligence
I am looking for just a couple pennies of FFO/share growth per year, essentially from organic rent rollups and/or rent escalators. With a prohibitively low multiple for equity issuance, it would be quite hard for a triple net REIT to grow at the pace analysts are calling for.
Thus, GOOD is just a clean value and dividend play. While the low multiple slows growth it also makes it a very attractive stream of cashflows. At current pricing it has an 8.4% FFO yield, most of which goes directly to investors as a dividend. With that stream of cashflows, I am willing to wait for the growth.
Medical Properties Trust (MPW) and Global Medical REIT (GMRE)
Healthcare is a defensive sector as its demand does not wane as the economy slows. Growth for the REITs comes largely from spreads on acquisitions with perhaps slight roll-ups in leases over time. The success of this model requires strong asset selection from the REIT manager to assure that either the tenants are strong and wanting to stay in the building long term, or that the building itself has so much value as a center of operations that it can be accretively re-leased. We have chosen these particular REITs for the strength of their underwriting.
It is in the failures that strength is revealed. MPW has previously had a few operators go under. Such is the nature of the hospital business, but because the real estate is so strong, the re-leasing prospects of the properties were excellent. MPW’s hospital tenants are above average, but the real strength is the real estate itself.
GMRE’s underwriting was proven out in COVID as its collections proved superior to be big 3 healthcare REITs.
My growth estimates for MPW and GMRE are about in line with consensus which has each company growing at a slow to medium pace. The difference between my opinion and that baked into market price is that I see the chance of tenant/property failure as significantly lower. The market often gets worried when tenants are in trouble, but the REIT only gets substantially harmed when the tenant and the real estate are in trouble. With MPW’s and GMRE’s properties generating EBITDAR that is 3X and 5X rent, respectively, the real estate is clearly in high demand.
I recently met with GMRE’s management at REITWEEK and asked a series of bearish questions to get a sense for their views on the major risk factors in healthcare. Often the things that don’t show up in paper can show up in facial expressions and tone of voice, but they seemed genuinely confident in the business.
Iron Mountain (IRM)
Bill Meaney (CEO of IRM) announced at the REITWEEK conference a decade-long growth runway of rapid growth.
Such nebulous long duration plans are often nothing more than hype, but I have learned to not doubt Bill Meaney. When he first took over at Iron Mountain, I misjudged him as a sensationalist who attached jargon to everything. His cost cutting initiative was called “Project Summit” and revenues were categorized into “records information management” and “information services”.
What the heck does any of that mean?
Well, it turns out that behind business school style code names there were actual ideas with significant merit. Project Summit was initially supposed to save a few hundred million in run-rate EBITDA and has since substantially exceeded underwriting. Along with cost savings, other operational efficiencies were realized, increasing margins across the entire business.
His expansion into data centers proved highly successful as pre-existing business relationships in IRM’s legacy business were leveraged to lease up acquired and developed data centers are incredible speed.
The legacy paper business which long ago was declared by external observers to be in secular decline is still growing in both profit margins and volume of boxes stored.
IRM simply executes well and they have a great niche at the intersection of information archiving, security and retrieval that I believe is unmatched by any other provider. Incremental business comes with minimal incremental expense allowing a scale of growth not typical of REITs which typically require capital outlay for new revenues.
I don’t think IRM will trade at a low AFFO multiple for long.
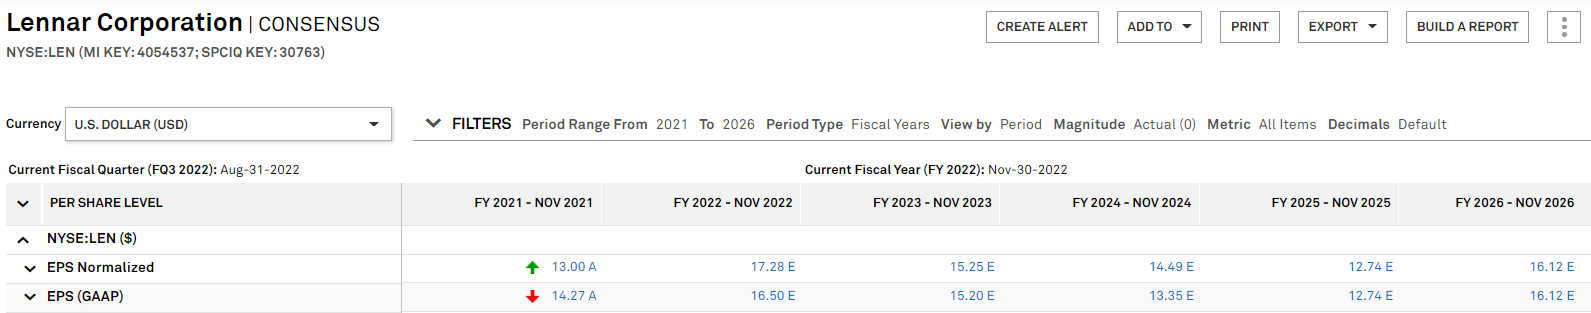
Lennar (LEN)
Lennar is cyclical and perhaps hit peak earnings in 2022. Smoothing out the cyclicality, its growth comes in 3 forms:
- Efficiency improvements in core business
- Expansion into development of multifamily
- Single Family Home development
I am significantly more bearish than analyst consensus, but if consensus were correct, this would be a well over $100 stock. Consensus has earnings declining to $12.74 in 2025 and then presumably starting its climb in the next cycle in 2026.
S&P Global Market Intelligence
While I certainly prefer increasing earnings over declining earnings, a cyclical decline is very different than a secular decline. So, while earnings are probably at peak for this cycle, I would anticipate the next cycle’s peak to be higher.
While analysts think earnings will remain strong, the market is pricing in a housing recession just about as severe as the popping of the housing bubble just before the financial crisis. Frankly, LEN is absurdly cheap relative to earnings.
I differ from the market in that I think it will be a mild housing recession driven primarily by mortgage rates being higher than people are used to. The rest of fundamentals still look healthy. Homes are undersupplied and the economy is okay or better.
The other difference and the reason I own Lennar instead of a different home builder is that LEN.B allows us to buy Lennar 16% cheaper than its market price. Even if the outcome is as bearish as the market seems to think it will be, by owning it 16% cheaper we should come out nicely ahead of those who own LEN regular.
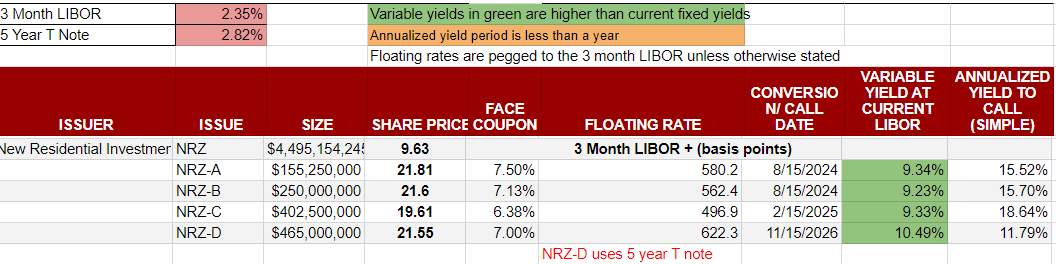
New Residential (NRZ) Preferred C (NRZ.PC)
We recently wrote a full piece on how fixed to floating preferreds are mispriced by the market because they are being traded down like fixed income securities, but due to the near-term conversion to floating rate, they should not be so interest-rate sensitive.
NRZ preferred C is arguably one of the best opportunities of the group due to the magnitude of discount to par.
Portfolio Income Solutions preferred tracker
On 2/15/25, its coupon moves to 3 month LIBOR plus 496.9 basis points which at today’s LIBOR rate equates to a 9.33% yield. However, the Fed is anticipated to hike another 75 basis points in a couple weeks and a few more times after that. This will likely take it over a 10% floating yield.
NRZ itself is a growing business that has actually been gaining book value while other mortgage REITs have been losing book value due to its mortgage servicing rights. By that time, I believe it will have access to cheaper capital in other forms and might redeem the preferred. Redemption pays $25 per share, so at $19.61, it would be a substantial capital gain for preferred holders.
In brief, it is a big yield with significant upside and only average preferred level of risk.
Simon Property Group (SPG)
Coming out of the COVID crash, SPG’s growth story was re-leasing vacant mall space as the world re-opened. That has been happening to some success with SPG’s FFO/share rebounding nicely and on the cusp of surpassing pre-COVID levels.
Consensus estimates are calling for somewhat choppy but still moderate growth going forward.
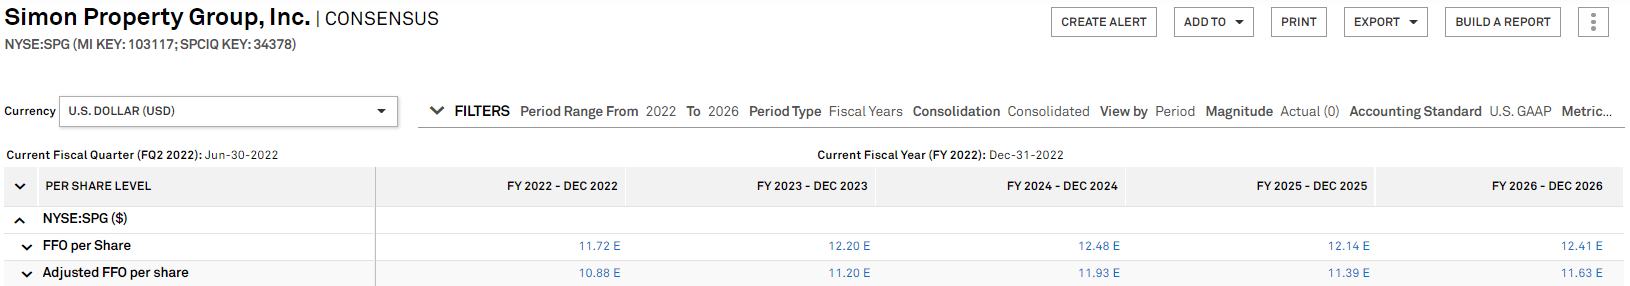
S&P Global Market Intelligence
I largely agree with these estimates. Retailer bankruptcies have been extremely low, supply of competing retail space is shrinking and new types of stores are coming in to fill up space.
I think rental rate growth will be flattish in the near term with some strength in the outyears. Occupancy trends look quite favorable.
Overall I think it will be tepid growth which is a great outcome for a stock trading at 8X FFO.
Spirit Realty Capital (SRC)
I just wrote a full thesis on SRC so rather than duplicate it here you can check it out at your leisure.
STAG Industrial (STAG)
STAG has long derived its growth from external acquisitions. Organic rental rate growth has been strong too in the mid teens on rollovers, but the rental rate gains have been canceled out by a natural tick down from acquired occupancy at 100% to stabilized occupancy around 96%.
For STAG I think the analysts are way off because they seem to have just straight lined this type of growth into the future at a slow to moderate pace.
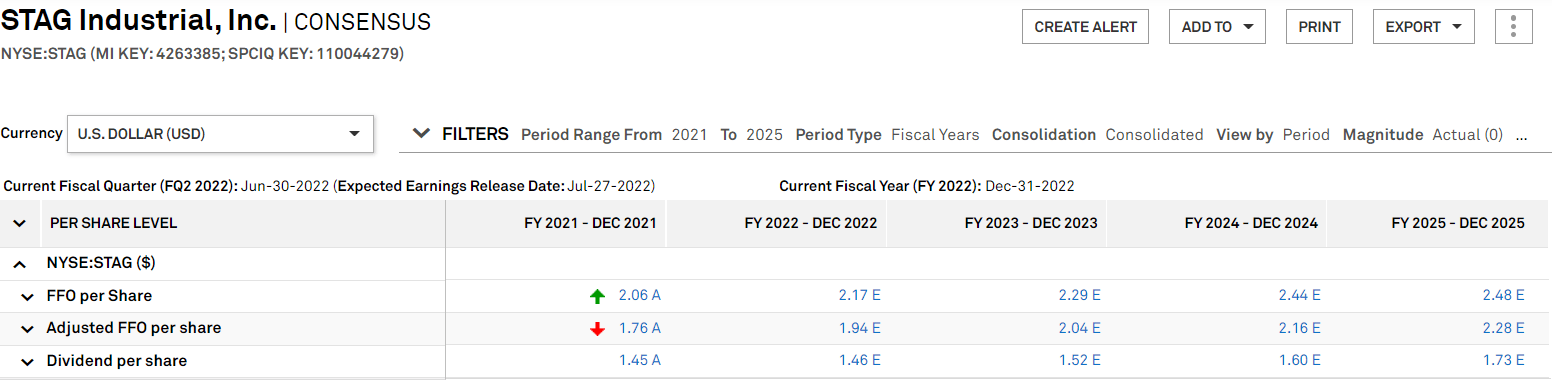
S&P Global Market Intelligence
However, I believe they are missing a few aspects of STAG’s business that will cause an upward inflection in growth rate:
- STAG’s moderate growth rate historically was partially due to deleveraging. Starting from a very low leverage base going forward, its growth rate will be higher
- The larger asset base relative to acquisition volume will cause the organic rent growth to outsize the tick down in occupancy of newly acquired assets.
- Rental rate growth has been accelerating in STAG’s markets.
I view STAG’s growth rate as closer to 8-10%. We shall see over time whether I or the consensus is right, but even if the growth is as anemic as consensus suggests, STAG’s valuation is attractive.
UMH Properties (UMH)
Manufactured housing continues to be an area of high growth. Supply constraints keep development to a minimum, resulting in occupancy and rental rate growth for incumbents like UMH.
On top of the property fueled growth UMH is on the cusp of FFO/share accretion from refinancing.
In a world where cost of capital is rising rapidly, UMH is particularly well prepared. Their FFO/share over the past few quarters has been dragged down by an abundance of extra capital sitting on the balance sheet.
This capital is earmarked to redeem an expensive preferred later this month which will immediately improve FFO/share. Due to timing, 2nd quarter will still come in fairly weak in terms of FFO/share, but a much higher runrate will be unlocked after redemption.
There is also a bit of a catalyst for UMH’s share price in the form of a new group of investors. UMH has been dual-listed on the Tel Aviv Stock Exchange, allowing Israelis to directly buy into UMH. More demand without a commensurate increase to supply of shares will likely have a tendency to increase the price.
Even after many years have gone by, Windstream drama continues to dominate the Uniti narrative.
I believe this is causing the non-Windstream portion of UNIT’s growth to be overlooked. Demand for fiberoptic cable is increasing from a variety of new categories and UNIT’s leasing has ramped up. Since there is minimal incremental expense associated with leasing up to a higher capacity, these revenues are high margin.
I don’t think UNIT will grow rapidly, but a few percentage points per year is well within the base case.
That said, we should take into account that a portion of UNIT’s earnings are temporary. While it is unknown as to what will happen with the WIN lease, I think it is likely there will be a small or medium sized rolldown. Thus, the current run-rate and growth is not indicative of the long run. At current run rate, UNIT would be an absolute slam-dunk investment. With a medium rolldown at lease expiry it is still a solid investment, just know that UNIT is not quite as deep value as it appears.
VICI Properties (VICI)
Although casinos are not typically of the sector, VICI is a true triple net REIT. Its lease terms are longer than most of the typical triple nets and its lease terms are better. In particular, there are 2 aspects of VICI’s leases that just blow the doors off of other triple net REITs:
- Tenants are responsible for a higher level of maintenance capex. It is not mere snow removal, rather tenants have to pay hundreds of millions to improve properties to fully maintain the trophy level of appeal.
- Thorough lease escalators have VICI’s entire revenue stream growing a couple percent per year passively
VICI has largely sat out the market sell-off which is great having owned it for that period, but it does make its valuation less desirable on a relative basis. VICI is earning its premium valuation through superior operations, but the relative strength of its market price does mean it will need to continue growing at a nice pace to keep its spot in the portfolio.
Weyerhaeuser (WY)
Weyerhaeuser’s market price fluctuates with lumber prices, as do its near term earnings. Since such a large portion of WY’s revenues comes from wood products, the price realized from their sales directly hits the bottom line. This can make it difficult to track what WY’s long-term earnings run-rate might be.
Presently, WY is far out-earning its long-term run rate, but aside from what I anticipate to be a nice special dividend later this year, that is only a minor factor in its overall value. The best measure of WY’s long term earnings potential would be a normal economic return on its assets.
Buying WY at NAV likely yields the investor a proper risk adjusted return. Buying it at 76% of NAV, however, likely nets the investor a superior return.
A lot of people are bearish on WY right now because of how far lumber prices have fallen, but I would note that the fall is more a feature of how absurdly high prices got rather than where they are today. In fact, lumber prices are still rather high and WY can earn a fantastic margin at these levels. The short term earnings look very strong and the long term earnings potential justifies a higher market price.
Diversification
While focused on bottom-up individual stock selection we do intentionally maintain diversification with overweights in the property sectors that are beneficiaries of the macro environment and underweights in sectors plagued by oversupply.
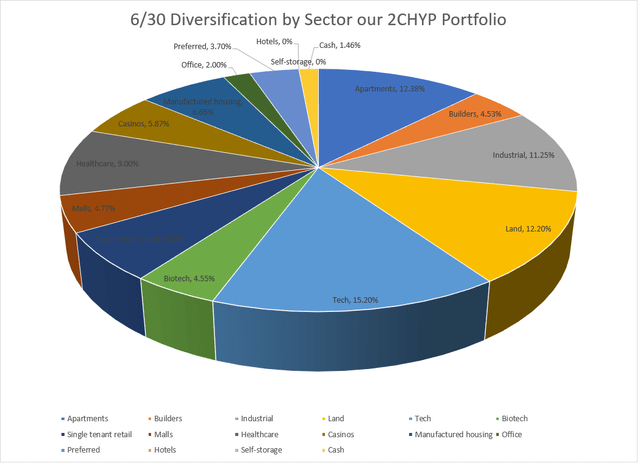
Author generated
There is nothing special about my assessment that office is a bad sector. It is an overwhelming consensus that office, particularly that in oversupplied coastal cities, is hurting. However, the phenomenon of index-based investing which is now about 50% of the total market is that it still buys the junky stuff even if it is known to be junky.
So, while active managers like myself are already mostly out of office, the index ETFs are still buying office for one simple reason – the office REITs are big.
A few areas in which we are substantially overweight relative to the index are
- Land – 12.2% vs almost none in the index
- Manufactured housing – 6.65% vs ~1% in the index
- Casinos – 5.87% vs almost none in the index
Performance
I began trading the 2CHYP portfolio on 7/1/16 with $100,000. No capital has been added or removed since allowing for clean tracking of performance.
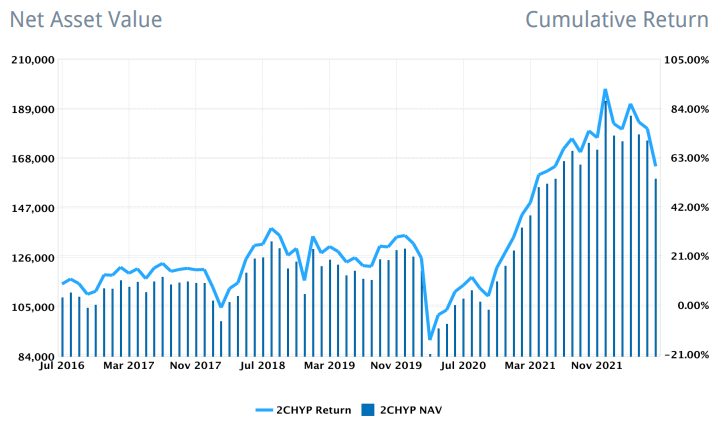
Interactive Brokers. See accompanying notes and disclosures
The 6 years in which 2CHYP has been open have been quite a rough period for the market with the COVID crash and now the Fed driven or recession fearing crash of the present. Careful stock selection and constantly watching for opportunities to pivot into superior opportunity have helped me outperform the index.
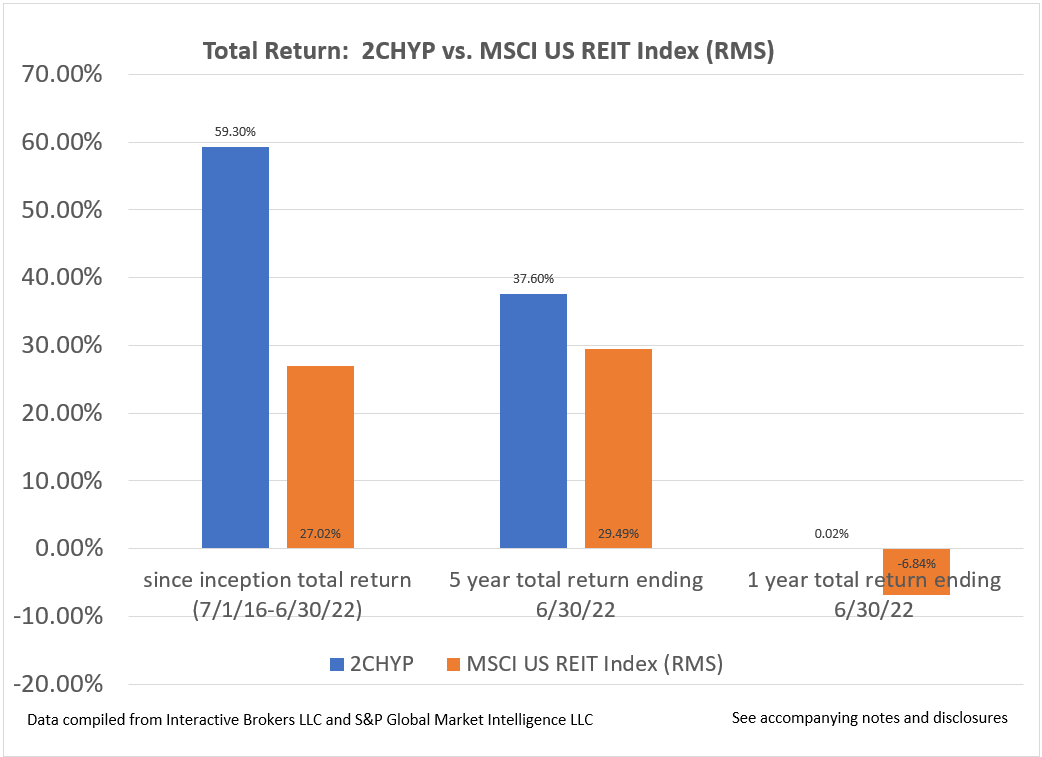
IBKR
Since inception on 7/1/16, 2CHYP has returned 59.3% while the REIT index (RMS) has returned 27.02%.
Wrapping it up
I will continue to analyze the REIT universe in the face of a rapidly evolving macro environment. As things change and prices move, new opportunities arise. I have every intention to capture them.
Be the first to comment