

Devonyu/iStock via Getty Images
Introduction
Montreal-based Osisko Gold Royalties (NYSE:OR) released its third quarter of 2022 results on November 9, 2022.
Important Note: I have followed OR quarterly since 2018. This new article is a quarterly update of my article published on June 16, 2022. All numbers indicated in this article are converted into US$
Osisko Gold Royalties owns 70% of Osisko Development Corp. As a result, the assets, liabilities, results of operations, and cash flows of the Company consolidate the activities of Osisko Development and its subsidiaries. However, the company indicated it will de-consolidate Osisko Development Corp. as of September 30, 2022, and the presentation of its results will be indicated as discontinued operations on the statements of loss and the statements of cash flows.
CEO Sandeep Singh said in the conference call:
the portfolio is doing well, the growth assets are moving forward. In the meantime, we continue to make records, we continue to return capital to shareholders, and we continue to invest in our future. All the while simplifying the company, which is what we’ve said all along,
1 – 3Q22 Results snapshot
Net loss attributable to Osisko’s shareholders was US$118.93 million or US$0.65 per share compared with an income of US$1.42 or US$0.01.
The quarterly dividend was US$0.055 per share or a yield of 1.73%.
OR 3Q22 highlights (Fun Trading)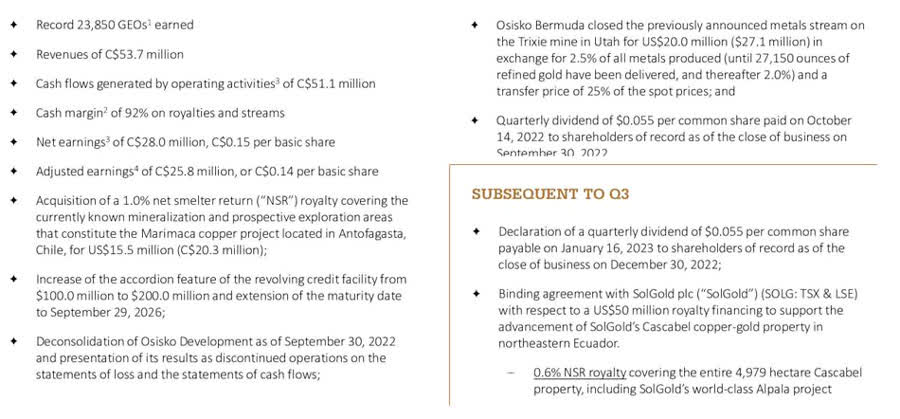
2 – Stock performance
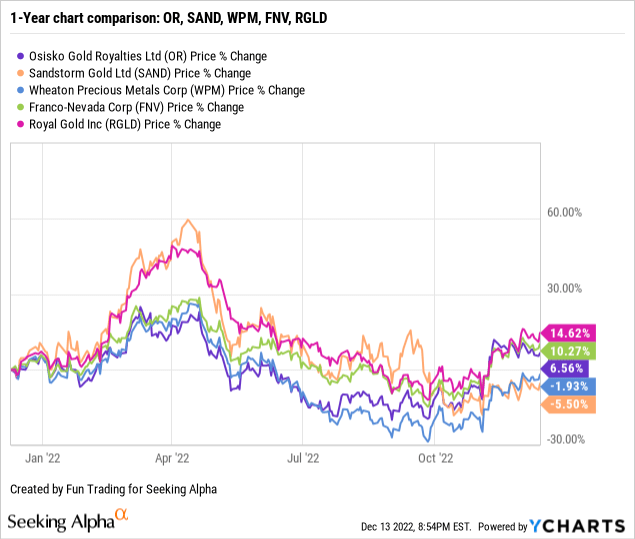
Osisko Gold Royalties belongs to the five streamers I regularly cover on Seeking Alpha.
My long-term streamers are Wheaton Precious Metals (WPM) and Franco-Nevada (FNV). I consider the company a good alternative in the streamer segment, especially for those who want to trade the sector short term. We can compare OR with Sandstorm Gold (SAND).
OR is now up 7% yearly, beating SAND and WPM.
Osisko Gold Royalties – Financials And Production In 3Q22 (In US$)
Note: Values can differ slightly due to the conversion from CAD to USD. Osisko Gold Royalties indicates CAD$ results with an exchange rate (CAD vs. USD) of 0.766 in 3Q22.
| Osisko Gold Royalties | 3Q21 | 4Q21 | 1Q22 | 2Q22 | 3Q22 |
| Total Revenues (including off-take interest) in US$ Million | 39.49 | 39.59 | 46.92 | 49.95 | 40.23 |
| Net Income in US$ Million | 1.4 | -16.55 | 0.26 | 13.40 | -118.93 |
| EBITDA US$ Million | 13.7 | -9.95 | 16.76 | 39.09 | 43.85 |
| EPS diluted in US$/share | 0.01 | -0.10 | 0.00 | 0.07 | -0.65 |
| Operating cash flow in US$ Million | 32.4 | 9.98 | 18.65 | -0.17 | 28.52 |
| Capital Expenditure in US$ Million | 63.7 | 49.22 | 17.63 | 16.38 | 17.30 |
| Free Cash Flow in US$ Million | -31.3 | -39.24 | 1.02 | -16.55 | 11.22 |
| Total Cash US$ Million | 119.92 | 90.39 | 357.35 | 350.89 | 225.31 |
| Long-term Debt in US$ Million | 319.87 | 320.65 | 327.30 | 238.39 | 223.58 |
| Dividends per share are US$ | 0.038 | 0.044 | 0.044 | 0.044 | 0.055 |
| Shares outstanding (diluted) in Million | 168.22 | 167.15 | 167.28 | 185.63 | 184.85 |
| GEOs | 3Q21 | 4Q21 | 1Q22 | 2Q22 | 3Q22 |
| Estimated Production gold equivalent Oz Eq. | 20,032 | 19,830 | 18,251 | 22,243 | 23,850 |
| Gold price realized in US$ per ounce | 1,790 | 1,798 | 1,877 | 1,871 | 1,729 |
| Silver price realized in $US per ounce | 24.00 | 23.51 | 24.01 | 23.00 | 19.23 |
Source: Company release. More data are available to subscribers only.
Analysis: Revenues, Earnings Details, Free Cash Flow, Debt, And Production Details (In US$)
1 – Revenues were US$ million in 3Q22.
OR Quarterly Revenues history (Fun Trading)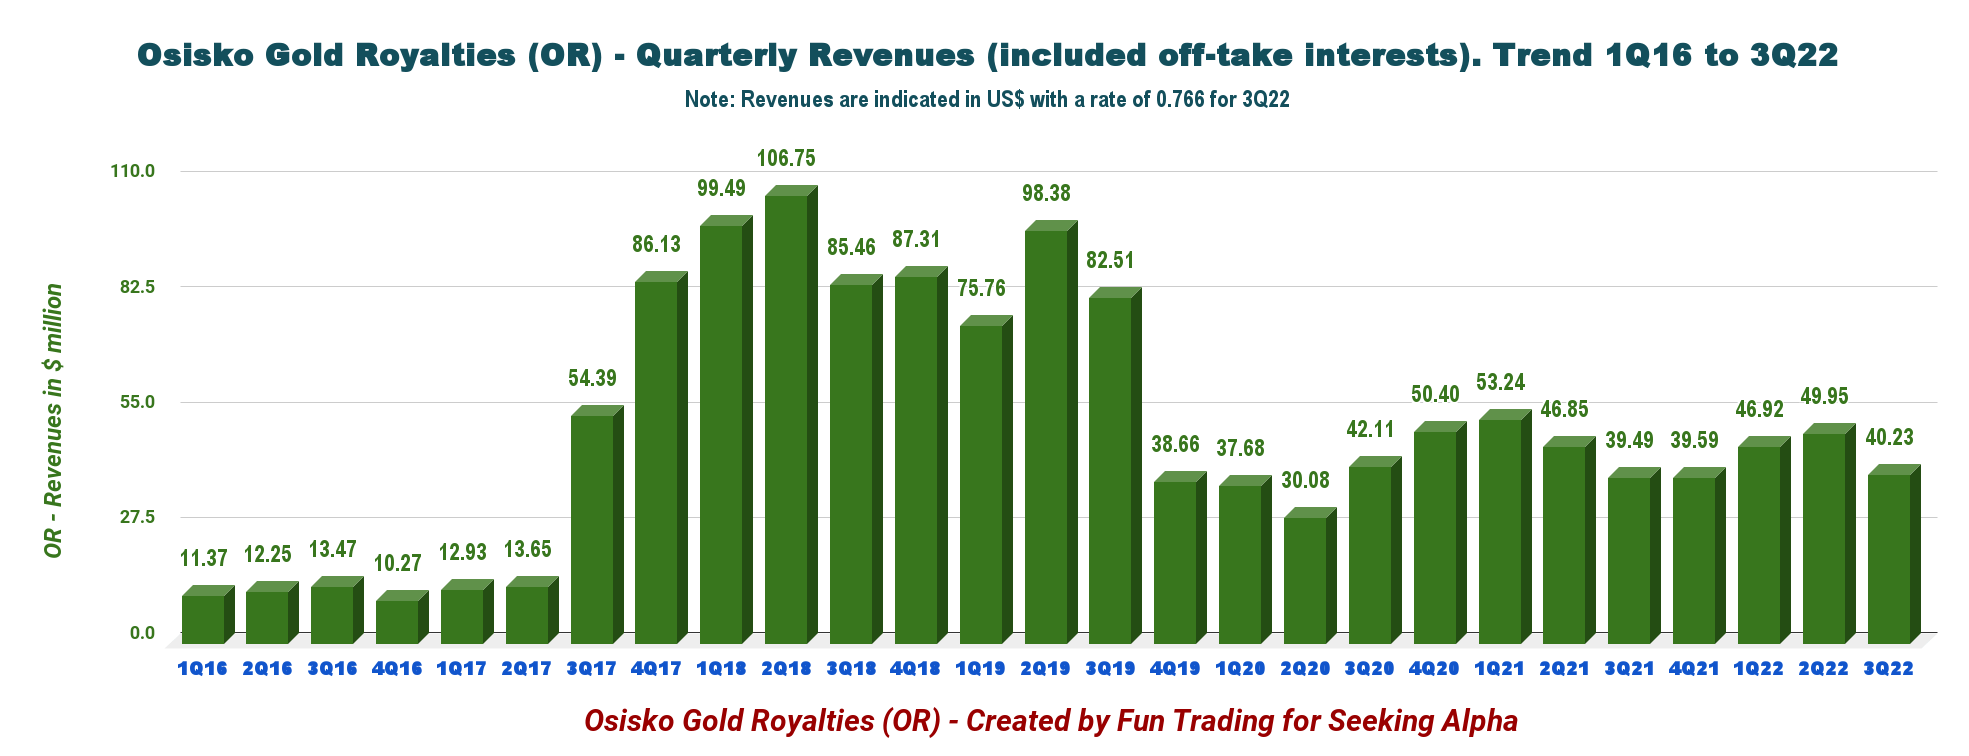
Osisko Gold Royalties posted revenues of US$40.23 million in the third quarter of 2022, down from US$39.49 million in the same quarter a year ago.
On a consolidated basis, the net loss for the third quarter was US$118.93 million, compared to an income of US$1.42 million in 3Q21. The adjusted earnings were US$19.8 million or US$0.11 per share.
The loss was due mainly to the deconsolidation of Osisko Development with non-cash deconsolidation of $140.9 million. In the press release:
On September 30, 2022, the Corporation derecognized the assets and liabilities of Osisko Development from its consolidated balance sheet, recorded its interest in Osisko Development at fair value as an investment in an associate at $207.0 million, recognized royalty and stream interests on assets held by Osisko Development of $122.1 million (these assets were previously eliminated on consolidation prior to the loss of control) and recognized a net non-cash loss on deconsolidation of $140.9 million.
Cash operating margin was 92% from royalty and stream interests. The company owns over 175 royalties, streams, and offtakes. Canadian Malartic is the cornerstone royalty for Osisko, with the Odyssey underground on schedule, which will be transferred to Agnico Eagle (AEM) soon.
OR Details numbers (OR Presentation)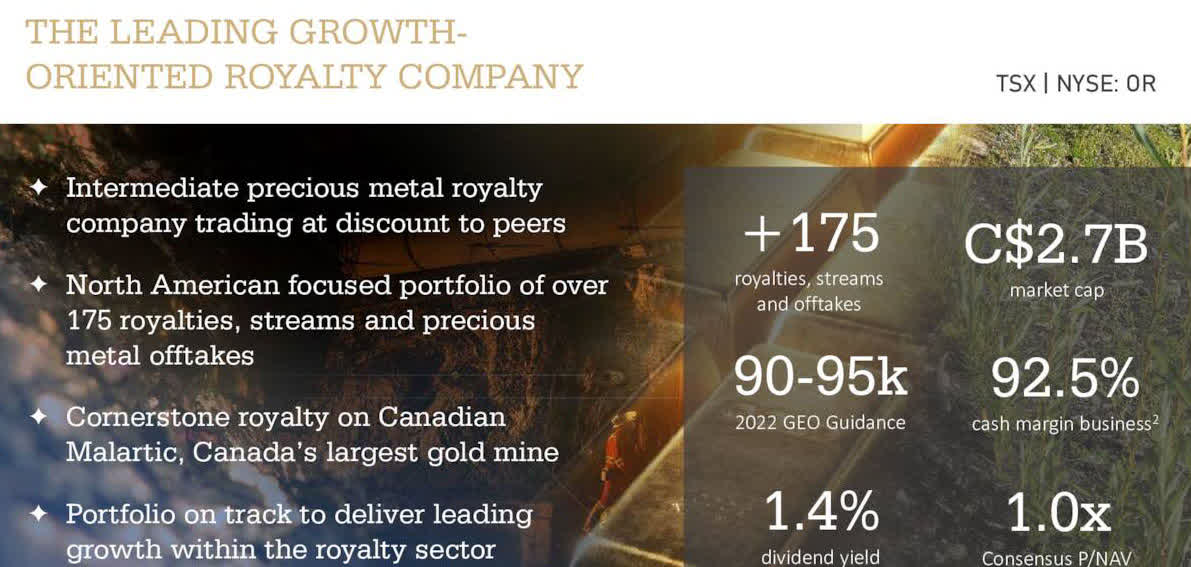
CEO Sandeep Singh said in the conference call:
it was a successive quarter of records on all fronts in terms of GEOs delivered to us, revenues and cash margins despite gold and silver prices being down quite significantly over the quarter versus Q2 and records on GEOs despite the gold silver ratio not really working in our favor either with the same silver ounces converting into fewer GEOs at the time, that’s kind of since resolved itself.
2 – Free cash flow was a loss of US$ million in 3Q22
OR Quarterly Free cash flow history (Fun Trading)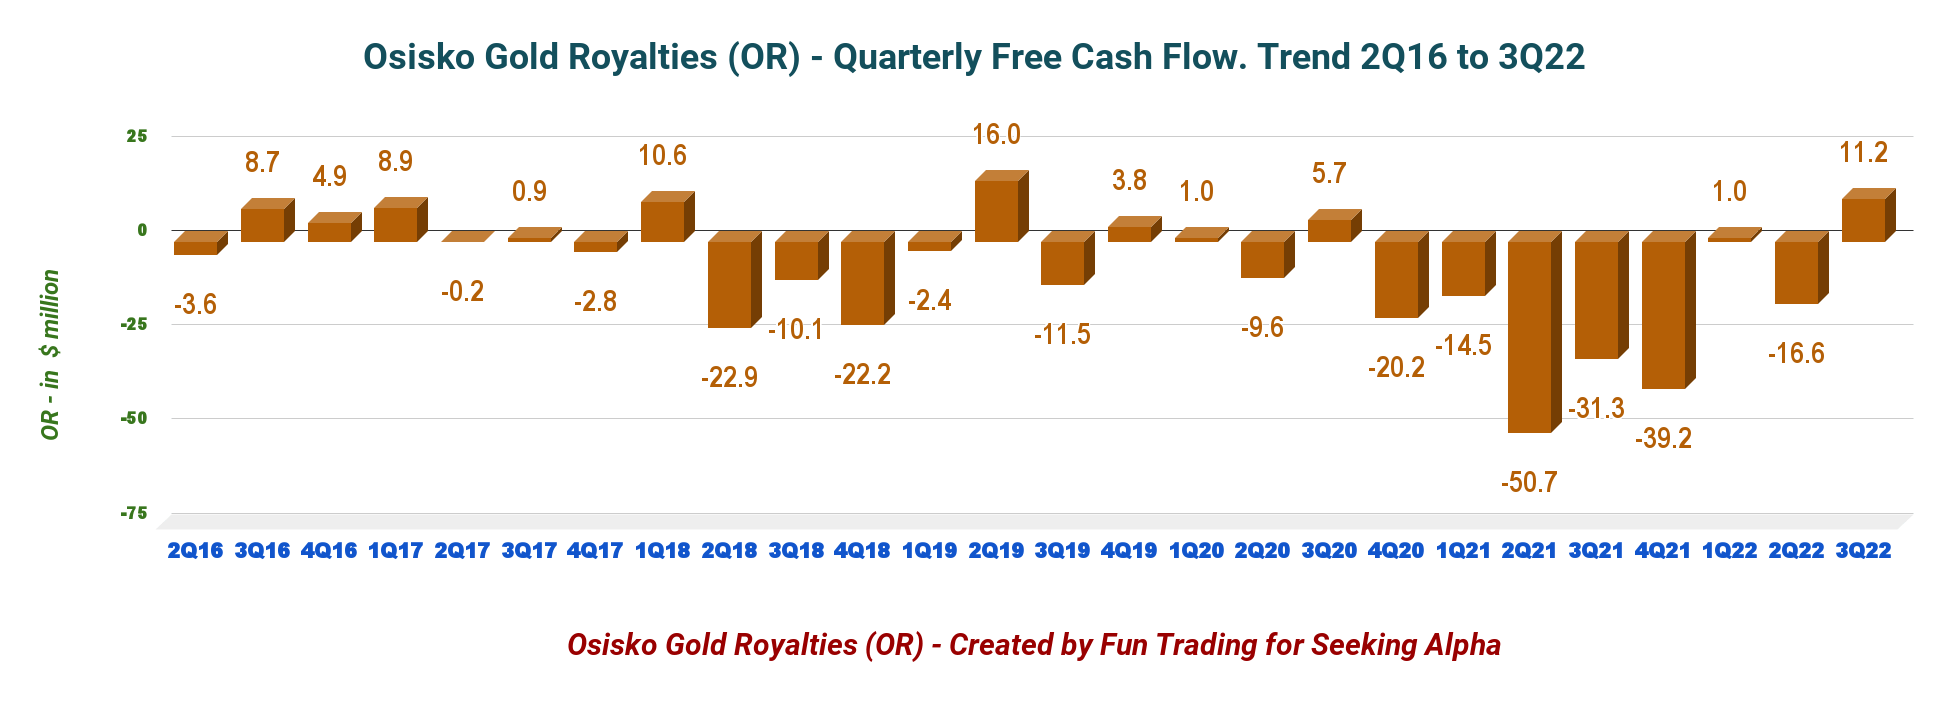
Note: The generic free cash flow is the cash from operating activity minus Capex.
Free cash flow for the third quarter of 2022 was US$11.22 million, with a trailing 12-month free cash flow loss of $156.46 million.
3 – No Net debt in 3Q22 and total cash of US$225.31 million.
OR Quarterly Cash versus Debt history (Fun Trading)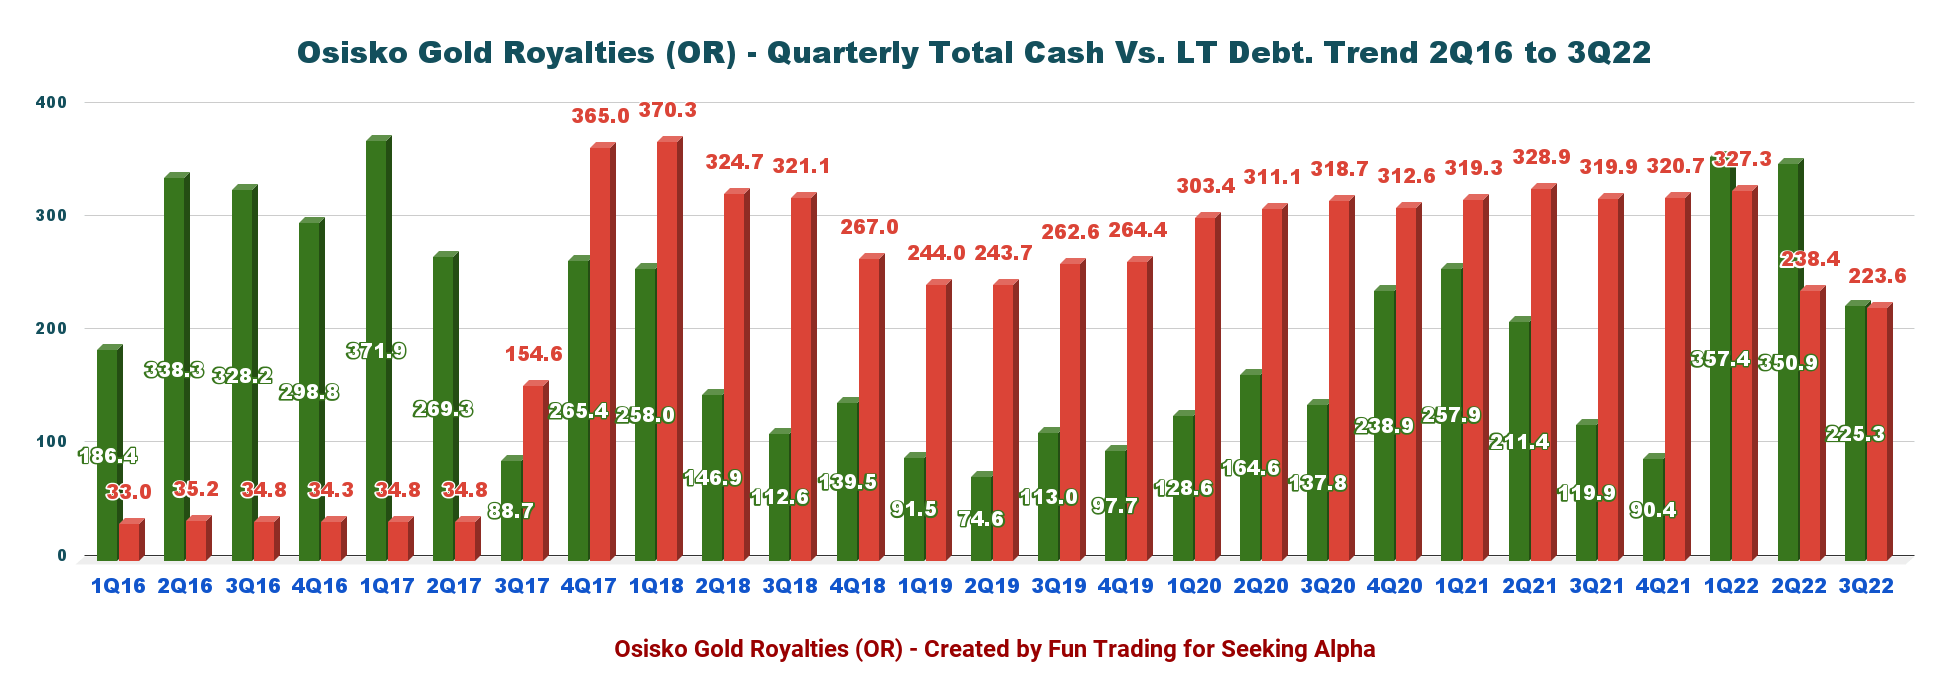
No more Net debt this quarter, with a total cash position of $225.31 million and total debt of $223.58 million in 3Q22. Liquidity is approximately US$800 million. Also, the company increased the accordion feature of the revolving credit facility from C$100.0 million to C$200.0 million and extended the maturity date to September 29, 2026.
Below are the details (in CAN$):
OR Balance sheet Presentation (OR Presentation)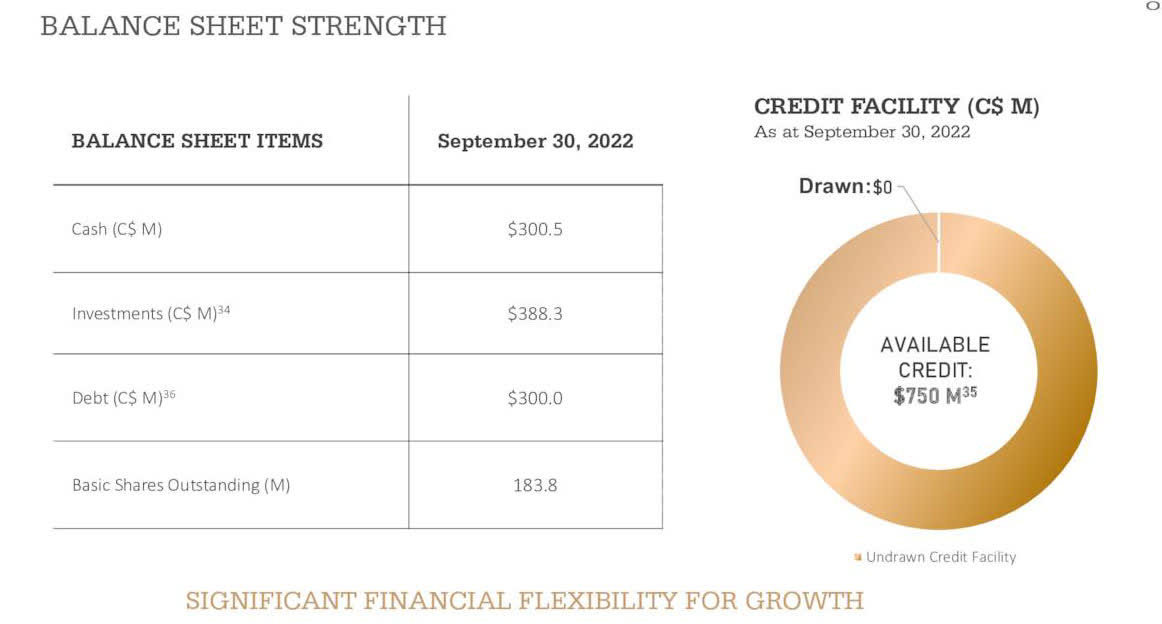
4 – Production in gold equivalent ounce and details
OR Quarterly Gold equivalent history (Fun Trading)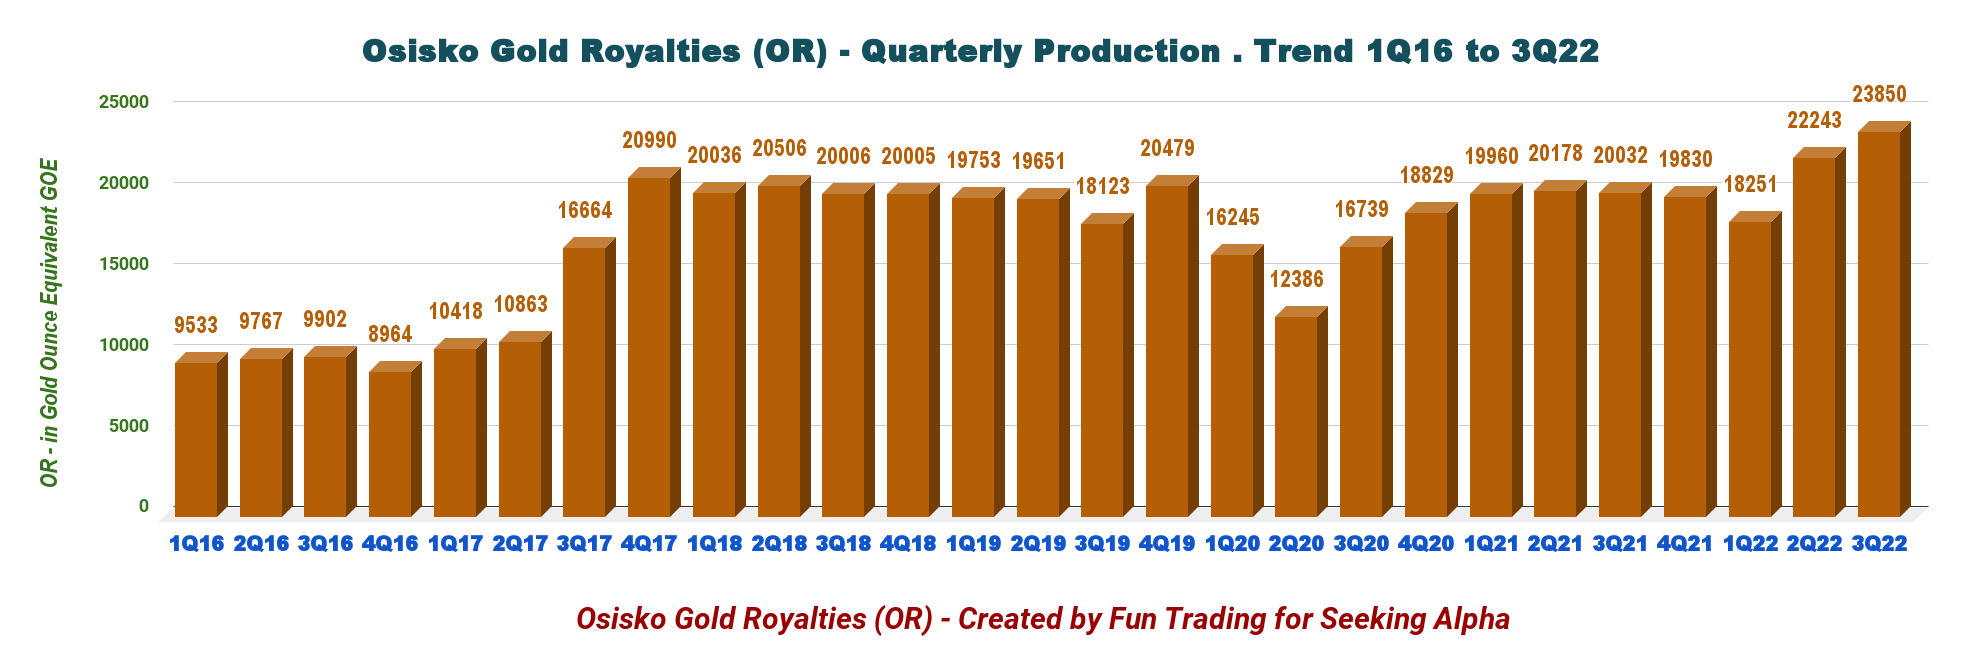
Osisko Gold Royalties produced a record of 23,850 GEOs in the third quarter of 2022, up 19.1% from 3Q21 and 7.2% sequentially.
OR Production details 3Q22 (OR Presentation)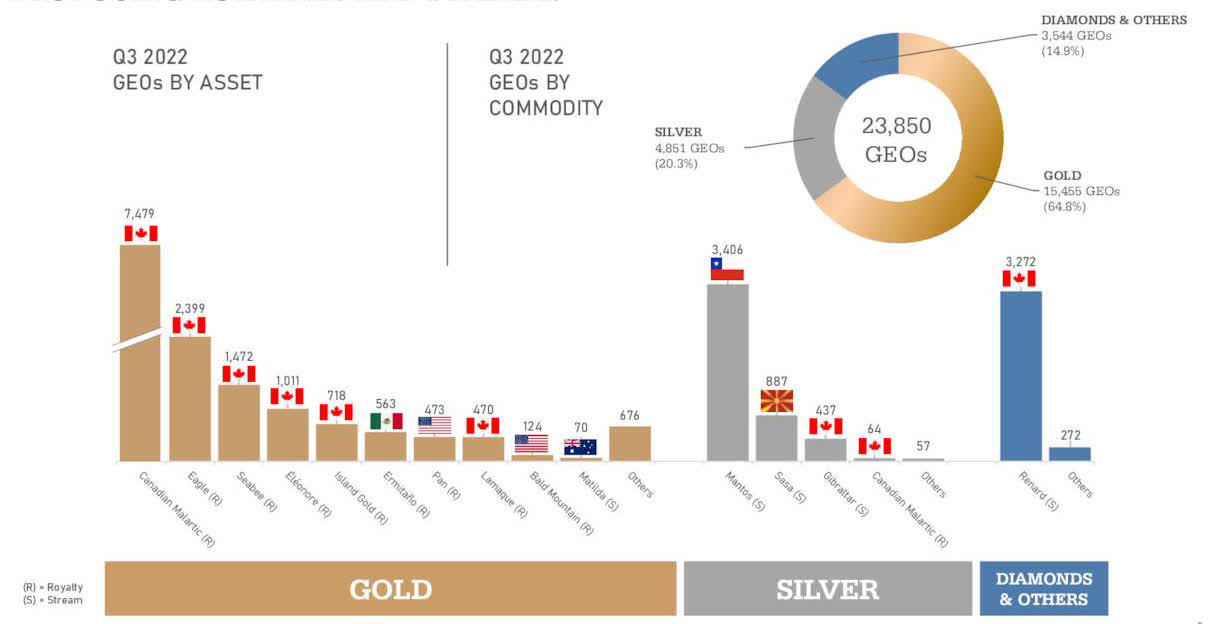
Gold price increased this quarter to $1,729 per oz, and silver was $19.23 per ounce.
OR Quarterly Gold price history (Fun Trading)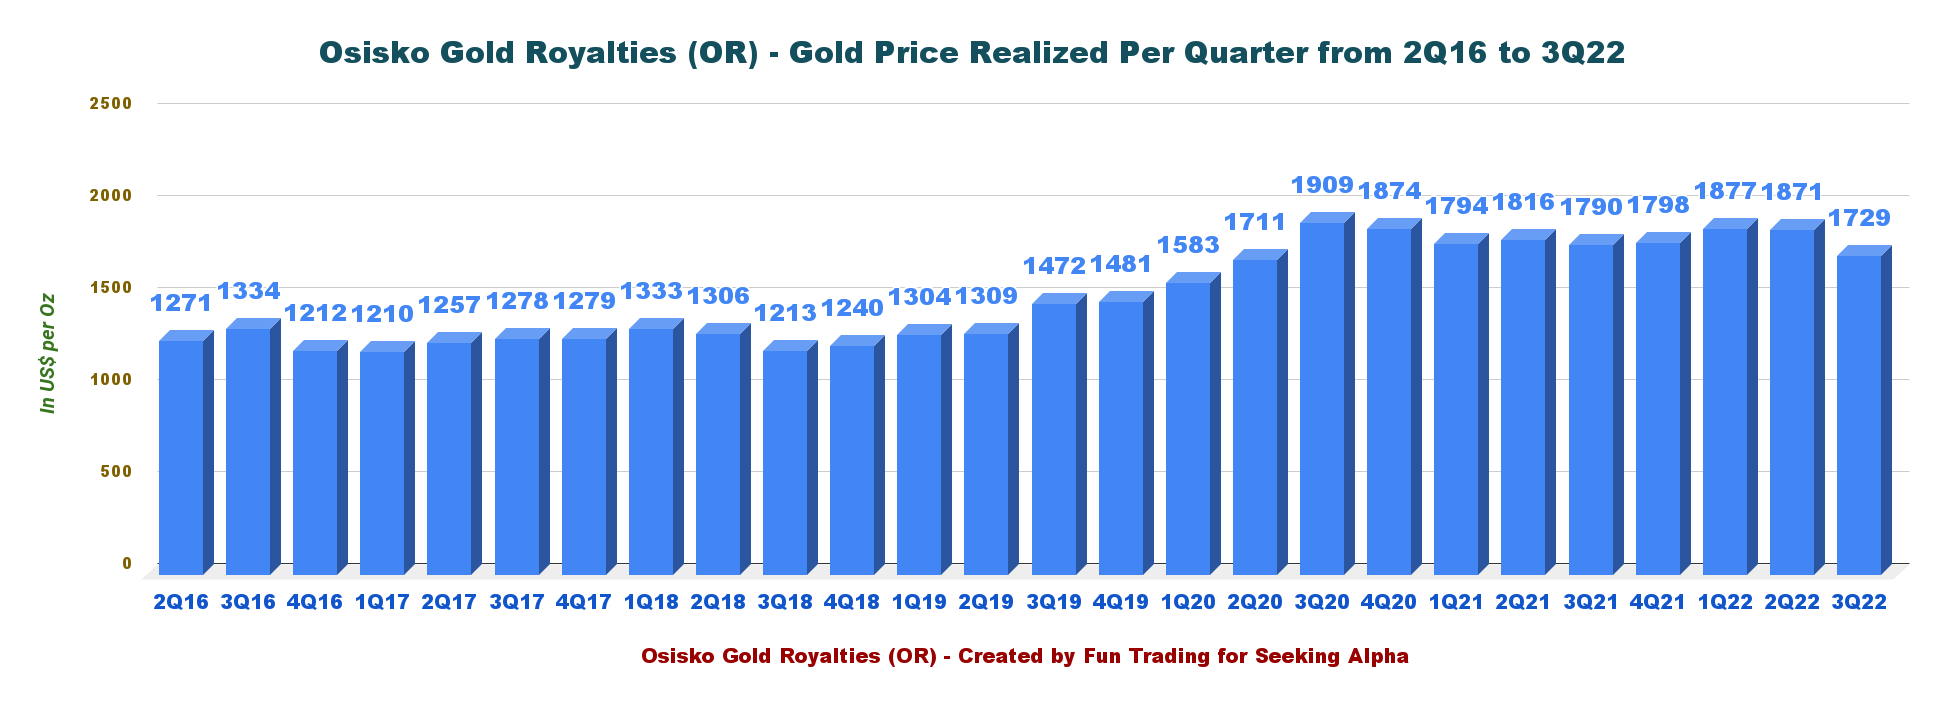
5 – Guidance 2022 and Odyssey project.
The company expects between 90K and 95K GEOs in 2022.
Also, at the Canadian Malartic underground, also called Odyssey, the shaft sinking is scheduled to begin in 4Q22.
OR Odyssey underground (OR Presentation)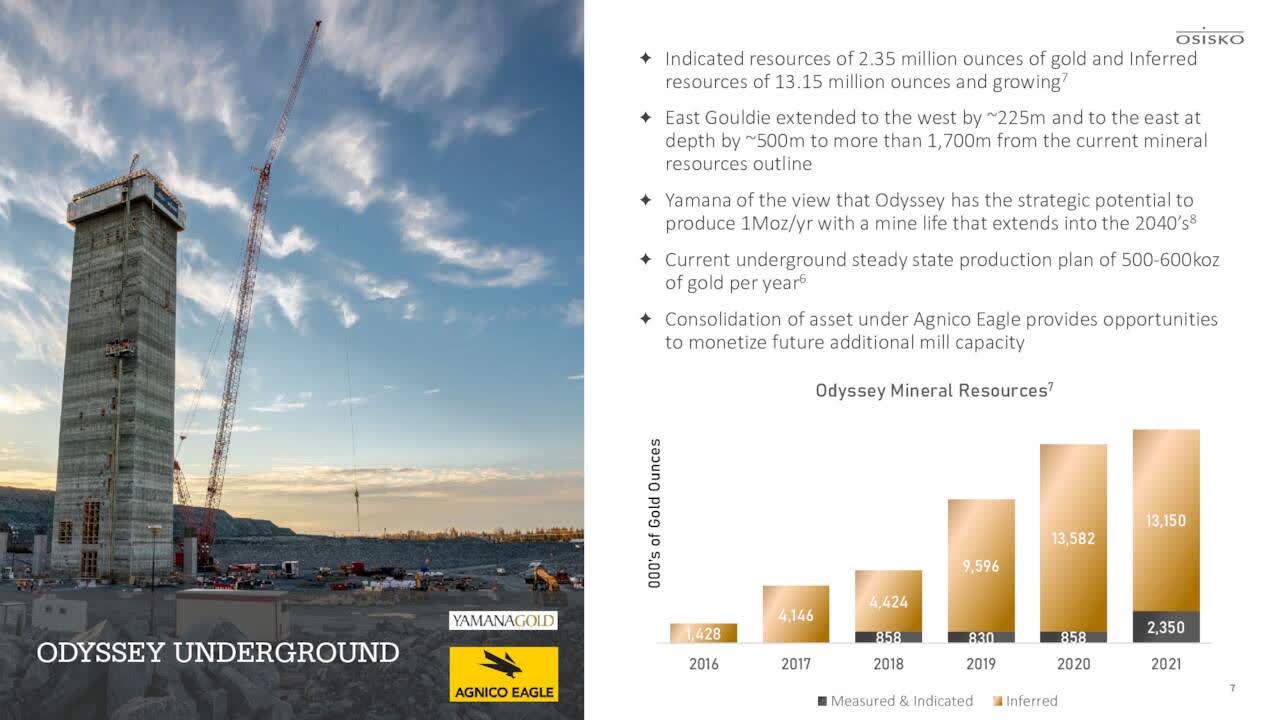
The company offers excellent growth potential, with an estimated production of 130K to 140K GEOs by 2026. I like the growth here.
OR Growth outlook (OR Presentation)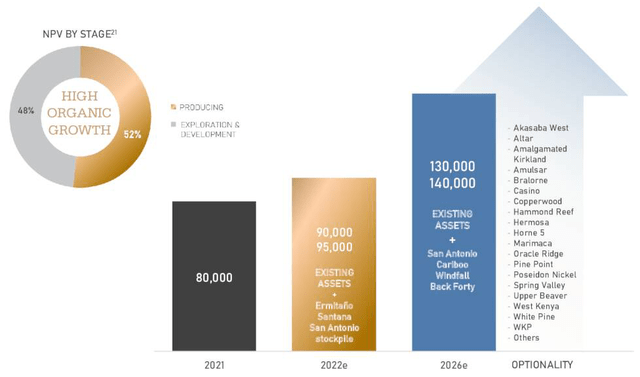
Technical Analysis And Commentary
OR TA Chart short-term (Fun Trading StockCharts)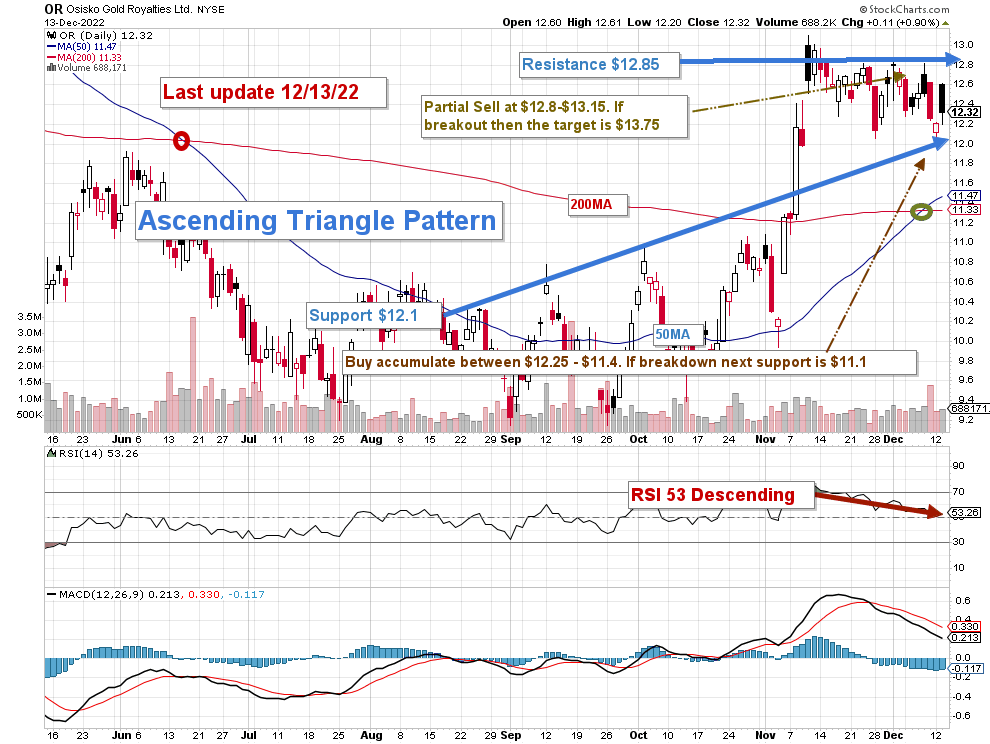
The stock OR forms an ascending triangle pattern with resistance at $12.85 and support at $12.1.
Ascending triangle patterns are bullish, indicating the stock’s price is likely to climb higher as the pattern completes. However, RSI is descending at 53, and volume is weak, which may indicate further weakness before breaking out later.
The short-term trading strategy is to trade LIFO about 60%-65% of your position. I suggest selling between $12.8 and $13.15, with possible higher resistance at $13.75, and waiting for a retracement between $12.25 and $11.4 to accumulate again, with potential lower support at $11.10.
If the gold price loses momentum and dips below $1,800 per ounce, depending on the inflation threat, and after the FED hiked by 50 points today, OR may break down faster to $11.1 or below. In this case, I see it as an opportunity to accumulate.
Gold and silver have been doing well lately.
OR 1-Year chart gold and Silver (Fun Trading StockCharts)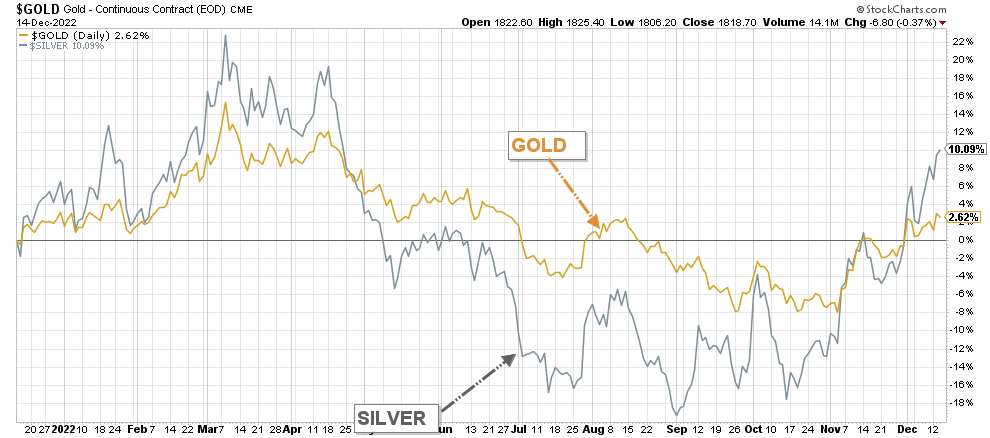
Conversely, if the gold price strengthens and reaches $1,850 per ounce. In this unlikely case, OR could reach $14.25.
Watch gold like a hawk.
Warning: The TA chart must be updated frequently to be relevant. It is what I am doing in my stock tracker. The chart above has a possible validity of about a week. Remember, the TA chart is a tool only to help you adopt the right strategy. It is not a way to foresee the future. No one and nothing can.
Author’s note: If you find value in this article and would like to encourage such continued efforts, please click the “Like” button below to vote for support. Thanks.
Be the first to comment