Olivier Le Moal
“A 60:40 allocation to passive long-only equities and bonds has been a great proposition for the last 35 years… We are profoundly worried that this could be a risky allocation over the next 10.” – Sanford C. Bernstein & Company Analysts (January 2017)
“Bull markets are born on pessimism, grow on skepticism, mature on optimism, and die on euphoria.” – Sir John Templeton
“Life and investing are long ballgames.” – Julian Robertson
“If everybody indexed, the only word you could use is chaos, catastrophe… The markets would fail.” – John Bogle, May 2017
Try to buy assets at a discount rather than earnings. Earnings can change dramatically in a short time. Usually, assets change slowly. One has to know much more about a company if one buys earnings. – Walter Schloss
Introduction
Last night, I was talking with an investing friend, and lamented to me that it has been a very difficult year in the investment markets. Having empathy, I said I know, given that the broader equity indices have generally had drawdowns this year. More specifically, the SPDR S&P 500 ETF (SPY) is down 17.4% year-to-date through Wednesday December 21st, 2022, the Invesco QQQ Trust (QQQ) is down 30.8%, and the ARK Innovation ETF (ARKK) is down an eye opening 65.4% YTD.
SPY, QQQ, ARKK YTD Performance (Author, StockCharts)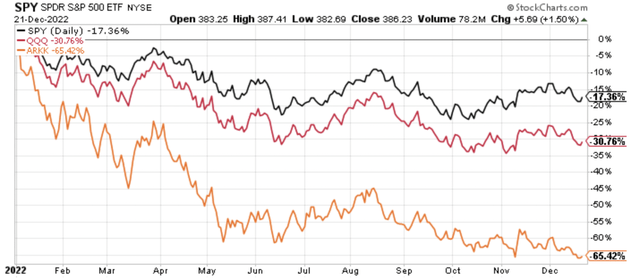
Having been publicly bearish on all three of these market barometers, most prominently with the ARK Innovation ETF, particularly with my August 10th, 2021 article titled, “ARKK Implosion Is On The Horizon,” I felt somewhat vindicated. Recall that many in the investment industry said I was an old, out of touch value dinosaur that thrived in a bygone era.
Author’s August 10th, 2021 SA Article (Author, Seeking Alpha)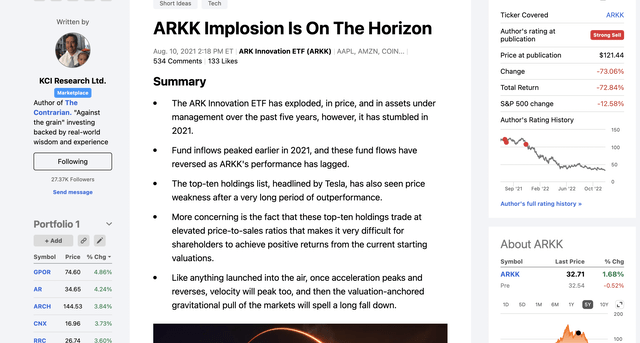
My friend said no, that was not what he was talking about with respect to the difficulty of the investment markets. Rather, he said, the difficulty was in the fact that almost all investments had become increasingly highly correlated this year, with individual equities impacted by the broader market’s overall movements. Again, I empathize, as this idea has been gaining a lot of traction recently, and it was even discussed in a recent Financial Times article titled, “End of ‘fantasy’ stock market brings relief and pressure for short sellers.”
A highlighted excerpt from that article really resonated on this topic of the markets becoming increasingly correlated.
Excerpt From Financial Times December 14th Fantasy Stock Market Article (Financial Times)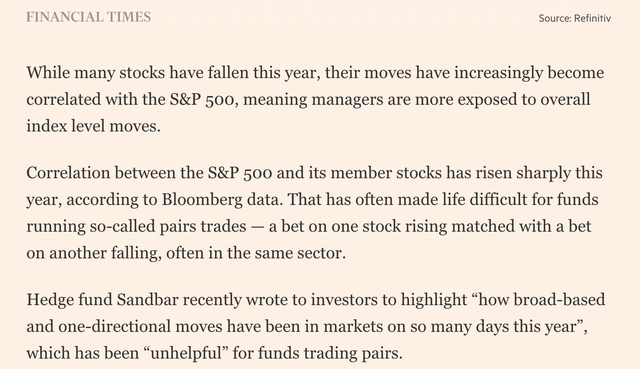
There’s a lot of data showing that correlations have increased this year, however, there’s substantial evidence that being contrarian at selected times has been more important than ever. In this article, we will delve into three companies, Antero Resources (AR), Peabody Energy (BTU), and Exxon Mobil (XOM), and show how they have differed from the markets in 2022, and in 2021, and 2020 as well.
The Importance Of Being A Contrarian Exhibit #1 – Antero Resources
In the spring of 2020, I called Antero Resources a generational buy, ironically sparking much ridicule and scorn at the time. Seeing a diamond in the rough, one of America’s largest natural gas liquids and natural gas producers whose shares were temporarily downtrodden, I penned a series of articles, including this one, “Antero Resources Is A Generational Buy: Dispelling The Myth Of Antero As High-Cost Producer.”
Author’s February 19th, 2020 Generational Buy Antero Resources Seeking Alpha Article (Author, Seeking Alpha)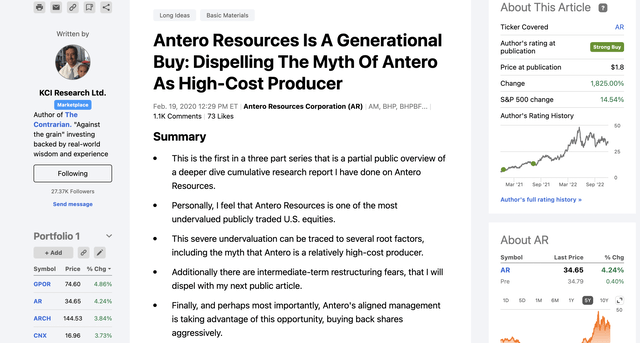
The article, which was written on February 19th, 2020, and shown in the screen snapshot above, proved on point, as Antero Resources shares are up 1825.00% since the article’s publication, versus a 14.5% gain in the S&P 500 Index (SP500).
Specific to 2022, Antero Resources shares are up 98.0% YTD, with the SPDR S&P 500 ETF down 17.4% YTD.
Antero Resources 2022 YTD Performance (Author, StockCharts)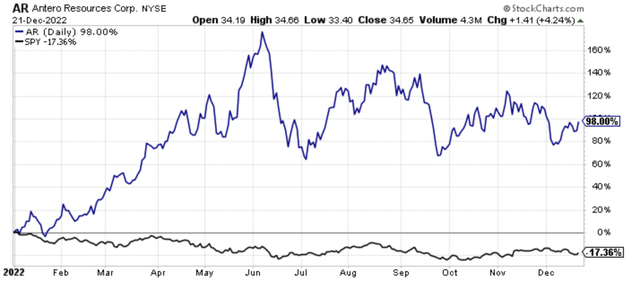
The tremendous absolute and relative performance in 2022 for Antero Resources shares comes on top of gains of 221.1% in 2021, and a peer leading gain of 91.2% in 2020.
The Importance Of Being A Contrarian Exhibit #2 – Peabody Energy
Peabody Energy was our candidate for Seeking Alpha’s Marketplace Top Idea contest in 2021. This excerpt was from a May 2021 update article that year.
Peabody Energy has been a big winner for our group in 2021, a literal full-circle comeback after Peabody was previously one of my larger investment mistakes, namely in 2016, in what turned out to be an otherwise very strong year for our group.
Building on that narrative, 2016 was what I call the “Appetizer” to what’s the developing “Main Course,” which began in 2020, and has continued in 2021. On this note, our group is perhaps best publicly known for our success with Antero Resources (AR), where we have accumulated significant realized and unrealized profits navigating a gauntlet of a journey. We also are well known for our focus on natural gas equities, which have been an obscure corner of the market that has significantly outperformed their more fabled FAANG peers the past two years.
These aforementioned success stories have been our public banners for contrarian investing, however, behind the scenes we have been laser focused on the bigger picture developing opportunity in out-of-favor value equities, and more specifically in commodity equities, driven by our understanding of the capital cycle, which ironically comes to the forefront in coal perhaps more than in any other commodity subsector.
Why coal?
Put simply, coal is loathed more than just about any other commodity, rightfully so in some instances, even though metallurgical coal is a necessary ingredient for virgin blast furnace steel (have you looked at steel prices lately…they are at all-time highs providing ample incentive for increased metallurgical coal utilization), and thermal coal is still widely used in global electricity generation, especially in emerging markets. Adding to the narrative, with robust global natural gas prices, Newcastle thermal coal prices have surged in 2021, benefiting from both a rebounding global economy and a substitution effect.
Said another way, as much as many market participants want to cast coal aside to the dustbin of market history, it’s still a critically important building block for infrastructure, and electricity generation. Since being an investor in many commodities, including coal, has been an arduous exercise, to say the least for much of the past decade, including a restructuring at Peabody in 2016, where shareholders were wiped out, there’s a heavy reluctance to add to supply, which is only going to buoy future prices further. In fact, similar to the 1970s when commodities were the leading asset class, we’re already seeing price controls implemented for coal, which is a potential sign that we are only in the early innings of potentially a commodity super cycle.
Peabody Energy went on to have a fantastic 2021, with its stock price up 317.8% for calendar 2021, however, the performance in 2021 was only the beginning.
In fact, because fundamentals had turned so dramatically positive, yet investors were still understandably reluctant to embrace the stock, I nominated Peabody Energy as a breakout stock candidate in 2022. Specifically, on January 28th, 2022, the article titled, “Peabody Energy: A Breakout Stock For 2022” was published. Since that publication date, Peabody Energy shares are higher by 157.0%, with the S&P 500 Index lower by 12.5%.
Snapshot Of Author’s January 28th, 2022 Seeking Alpha Article (Author, Seeking Alpha)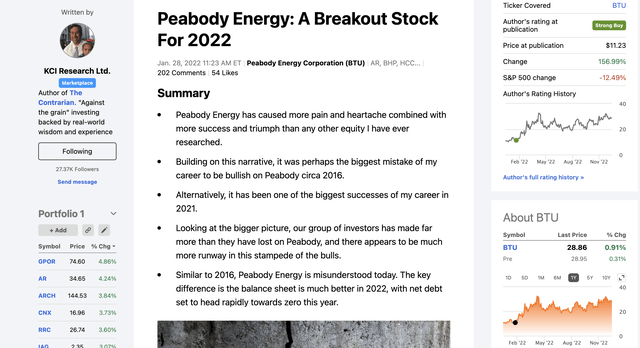
As good as that relative performance has been since the January 28th, 2022 publication date, Peabody has done even better for the full calendar year in 2022.
Peabody Energy’s YTD Performance 2022 (Author, StockCharts)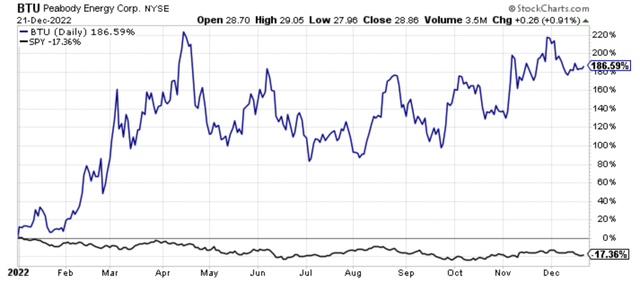
The cherry on the proverbial sundae of outperformance is that the price-to-earnings ratio of Peabody Energy is below 4 for 2022, and projected to be below 5 for 2023. This is for a company that has over $1 billion in projected net cash at year-end 2022, and has a free cash flow yield of over 30% right now. Said another way, Peabody Energy is still a contrarian idea today, the company is still unliked, unloved, and the starting valuation from here is still very reasonable, providing a further runway for share price appreciation.
The Importance Of Being A Contrarian Exhibit #3 – Exxon Mobil
When I was putting together the article titled, “Exxon Mobil Exit From Dow Reveals S&P 500 Index Structural Flaws,” which was published on August 28th, 2020, it felt like a seminal turning point in the structure of the markets.
At the time, the very human people behind the index inclusion decisions at S&P Global (SPGI), felt like they were looking forward to the future, replacing venerable Exxon Mobil, which was the Dow Jones Industrial Average’s (DIA) longest tenured member, with Salesforce.com (CRM), a technological leader.
Again, with the benefit of hindsight, that was a significant mistake, as Exxon Mobil shares are up 200.2% vs. a 51.9% decline in Salesforce.com shares since the switch.
XOM Versus CRM Since CRM Replaced XOM In The DJIA (Author, StockCharts)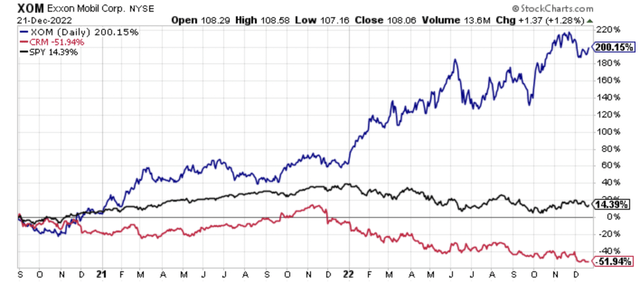
Exxon Mobil had a strong performance year in 2021, rising 57.6% for calendar 2021, when the SPDR S&P 500 ETF was up 28.7%, however 2022 has really been the year that the rubber meets the road so to speak. More specifically, Exxon shares are higher by 83.6% YTD, with SPDR S&P 500 ETF down 17.4% YTD.
XOM 2022 Performance (Author, StockCharts)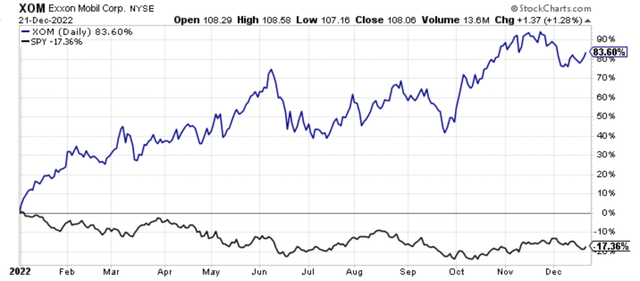
Exxon Mobil has strongly outperformed on a relative and absolute basis, and the old energy dinosaur that was exiled from the Dow Jones Industrial Average in August of 2020, has recently overtaken Tesla (TSLA) in market capitalization. This is the same Tesla that’s the poster child for the next era of energy.
Bigger picture, this Murray Stahl comment that I highlighted in the August 2020 Exxon Mobil article has proven prophetic (with emphasis added my own).
Murray Stahl: I personally think that indexation, which has really been a 20-25-year phenomenon in terms of raising assets and becoming unquestionably the dominant investment strategy, is just about ready to come to its end. And I say that because I think the index methodology is going to prove, at the end of the day, to be stenotic, narrowing to the point of failure.
There are a number of good characteristics about indexation, because, anything can be a good if you don’t take it to an extreme. But that’s a problem with investing, which is a problem in social science: People take things to extremes. They also lack patience, but the bigger problem is they take things to great extremes. No investment strategy is a strategy for all times. The indexation strategy is a good idea in the sense that, in theory, it’s a diversified portfolio with exposure to basically everything that’s in the market. So, some elements in the index will do well and, obviously, some others will not, but in the fullness of time, assuming the market as a whole does well, the whole of the index should do well.
And in the last 20 years, at least the part of the index that is technology, which is now clearly its biggest element, has done outstandingly well. And it’s obvious how that happened: Because of the growth of the internet, from a handful of users to now, if I’m not mistaken, over 4.8 billion of the roughly 7.7 billion people on this planet. The growth rates, if you measure country by country, are just astonishing. And a lot of that internet activity is concentrated on the platforms of certain companies, and you know which ones they are: Amazon (AMZN) and Microsoft (MSFT), and Facebook (META), and Apple (AAPL), and Google (GOOGL) (GOOG).
So, they’ve been incredible growth companies. And I don’t believe that they are going to be unprofitable. I’m not really saying anything bad about them. I’ll only say two things, one of which is completely obvious. By definition and by simple math, there’s a clear and calculable limit to how much growth they’re going to have in the sense that if we’re at almost 4.8 billion users and there are only 7.7 billion people on the planet, well, then, the maximum cumulative growth in users can only be the 60%, that being from the current number of users to 7.7 billion, and that’s if every single human on the planet is connected. Which means you’re not going to get the returns of the past. I personally think that’s self evident, but as I look around at sales projections, no one else seems to agree with me.
More importantly, let’s just imagine the following possibility: Let’s just say something else, some other segment of the index – of the S&P 500 – is going to do extraordinarily well at some point in the future. Well, if that’s true, the problem is that the index is now dominated by a handful of companies, meaning that it has undiversified itself and might no longer have much exposure to that other segment that will do extraordinarily well in the future. Many people don’t think about this, but that eventually happens to every index: Sooner or later, even if every stock in an index goes down, some stock is going to be the best-performing one, and that’s going to become the biggest position, and the next best performing stock is going to be the second biggest position, and eventually the index will be heavily dependent upon some particular few companies or sector.
This undiversifying happens over a very extended period of time and, because of that, this phenomenon hasn’t been studied – but in our case, that time is now. The S&P 500 is now a concentrated portfolio, and has undone the logic of its original purpose and is not diversified at all. The top five companies, out of 500 constituents, now account for 21% of the index.
The problem is not that something horrific will befall the largest investments, although that can happen, of course. In all likelihood, they will remain profitable. The problem – and perhaps the least appreciated one – is that some other group in the index will become desirable, but its exposure will have become negligible within the index as it gets crowded out. Hence, no matter how high the return of the negligible part of the index, it will have virtually no impact upon the total index.
So, imagine you were in control of the S&P 500 index, and you would like to rebalance it in order to give it exposure or greater exposure to some other sector of the economy. And let’s just make believe that sector is energy. Now, here I’m just asking you to admit the possibility. I understand it’s very controversial. I’m not making an argument that energy is going to do well. I’m just saying theoretically there’s a possibility that energy might do well, and you’re in control of the index and you want to alter the weightings such that energy, which is now not even 3% of the index, is going to be higher. How much higher? Let’s say you wanted to make it 15%. How would you actually go about doing it? Well, arithmetically it’s pretty easy. You would come up with a formula, and the computer would do the rest of the work. And once upon a time, you could even do that.
But in another way, it’s impossible. Why? Because, in practice, most of the investment world is now indexed, so this theoretical rebalancing would take place at a time when indexation is the dominant strategy – which never happened before. And it becomes more dominant with every passing day as the world divests itself of its active management community. In fact, rebalancing is impossible in two separate but completely related ways.
Here’s the first problem: There’s no longer enough money being managed in the active investment community to accommodate such a change. All the major indexes – and it’s not just the S&P 500, because they all have so much overlap in holdings – are going to be doing the exact same thing. They’ll want to sell their leading positions to rebalance, but who in the world are you going to sell to, even if they wanted to buy them? The buyers, the active managers, don’t have enough money. So, you can’t change or rebalance the index.
And, second, why should they buy it? The terms of trade are about to change radically in favor of the active management community, small and battered though it may be.
This quote, which was presented in a question and answer format in Horizon Kinetics’ Q2 2020 investment commentary, has hit the bullseye. Apple shares are down 23.3% YTD in 2022, Microsoft shares are down 26.6%, Alphabet shares are down 38.2%, Amazon shares are down 48.0%, and Meta Platforms shares are down 64.4%. Remember, the SPDR S&P 500 ETF is down 17.4% YTD, so the concentrated part of the S&P 500 Index, the technology sector, has vastly underperformed. Meanwhile, the energy sector, which is still only roughly 5% of the S&P 500 Index, has vastly outperformed, with the Energy Select SPDR Fund (XLE) up 62.2% YTD.
Exxon Mobil, which again was up 83.6% YTD, is the largest component of the Energy Select SPDR Fund. Yet many investors remain underweight in the energy sector, and if you are relying on passive indices to give you material exposure, that process will take many years of energy outperformance before it happens. Said another way, we are in the golden age of active investing, where the ability to have a portfolio composition different from the dominant indices is a significant advantage.
Closing Thoughts: We Are Just Entering The Golden Age Of Active Investing
Near the beginning of 2022, I wrote an article advocating the merits of going to cash because starting valuations for the broader bond and equity market were so historically poor. The title of this article was, “It’s Time To Go To Cash For The Next 7 Years – 1-Year Update” and it was published on January 20th, 2022.
Author’s January 20th, 2022 Seeking Alpha Article (Author, Seeking Alpha)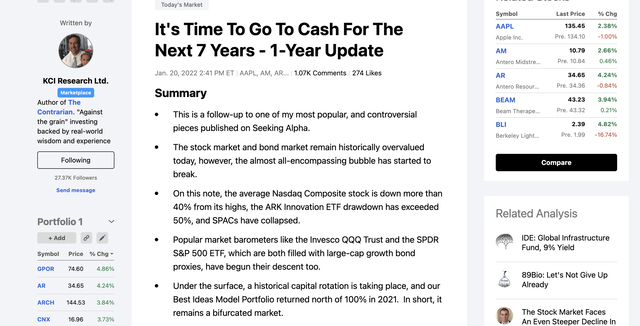
Naturally, this article received a lot of discussion, and a lot of pushback, however, with the benefit of hindsight, going to cash at the beginning of 2022 was definitely not a bad move given what we know now today. In fact, the relative and absolute performance of cash, and the higher yield of cash today, with 2-Year Treasury rates above 4%, should dispel the notion that cash is trash. This cash is trash narrative was so heavily circulated prior to the recent declines in traditional stocks and bonds, yet now, we don’t hear that today. Remember, narrative follows price as I like to say.
While the going to cash article sparked a robust discussion in the comments section, one facet of the article that was missed was the commentary in the article about the historic capital rotation that was taking place below the surface of the market. Building on this narrative, while very few were invested in the energy sector, since the weighting in the S&P 500 Index was a paltry roughly 3% to start 2021, that’s where the opportunities were, meaning in the places that most investors were not looking.
In summary, as we have highlighted in this article, the market has been a tough place to be the past year, with the SPDR S&P 500 ETF down 17.4% YTD, and the Invesco QQQ Trust ETF down 30.8%. Having said that, Antero Resources shares are up 98.0% YTD, Peabody Energy shares are up 186.6%, and Exxon Mobil shares are higher by 83.6%, so clearly there have been places to find outperformance if an investor has been willing to view the market through a contrarian, value-oriented lens.
The outperformance of loathed asset classes has been a trend that has been ongoing since the March 23rd, 2020 broader equity market lows.
XOP, XME, XLE, QQQ, SPY, GDX Performance Since March 23rd, 2020 Broader Equity Market Lows (Author, StockCharts)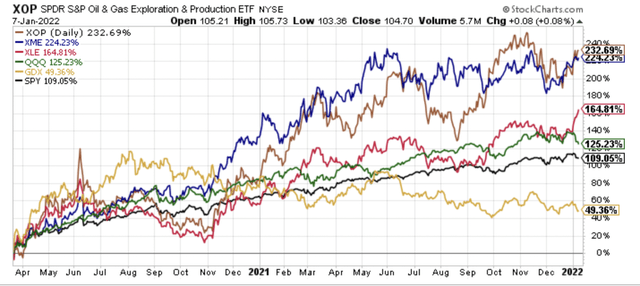
Since that broader equity market bottom, the SPDR S&P Oil & Gas Exploration & Production ETF (XOP) is higher by 232.7%, the SPDR S&P Metals & Mining ETF (XME) is higher by 224.2%, the Energy Select SPDR Fund is up 164.8%, with the Invesco QQQ Trust higher by 125.2%, and the SPDR S&P 500 ETF higher by 109.1%. Only the VanEck Vectors Gold Miners ETF (GDX) has materially underperformed, and this should be a clue in of itself, for contrarian investors.
In closing, I want to emphasize that we are in the early innings of the golden age of active investing. Quietly at first, and now more rapidly as the capital rotation has broadened in scope, we have seen a passing of the baton of market leadership. At this juncture, many investors may think it is too late to jump on board, however, energy prices are still comparatively low, with oil prices trading far below where their 2008-2014 price band would be if these prices were inflation adjusted.
Recognizing this changing backdrop after years of study, including being too early, I have been pounding the table on the extremely out-of-favor commodity equities for several years now, and I still think we’re in the early innings of what will be a longer-term secular bull market, albeit with significant volatility. Personally, I think we will supersede the capital rotation that took place from growth-to-value during 2000-2007, which also coincided with the last secular commodity bull market which ran from 2000-2008.
Investors skittish of commodity equities should research cast aside financials as they also will benefit from a renewed steepening of the yield curve, which is probably forthcoming following the eventual Fed pause and pivot, whenever it occurs, which could even be a year out at this juncture.
Understanding the bigger picture, then having an understanding of the bottoms-up fundamentals has been the key to outperformance, and this is a path that has not been easy with those participating confirming this reality. However, the road less taken is sometimes the better one, and I firmly believe that today, as traditional stocks, bonds, and real estate continue to offer very poor starting valuations, though they’re better than at the start of this year when I opined it was better to be in cash for the next seven years, and very poor projected future real returns from today’s price levels. More specifically, the out-of-favor assets and asset classes, including commodities and commodity equities and out-of-favor specific securities, are where the historic opportunity has been, and that’s where it still stands, from my perspective.


Be the first to comment