

smodj
Earnings of OP Bancorp (NASDAQ:OPBK) will likely increase this year thanks to moderate loan growth, which will, in turn, be driven by strong regional economies. Further, the margin will benefit from rising interest rates. Overall, I’m expecting OP Bancorp to report earnings of $2.25 per share for 2022, up 19% year-over-year. Compared to my last report on the company, I’ve barely changed my earnings estimate. For 2023, I’m expecting OP Bancorp to report earnings of $2.39 per share, up 6% year-over-year. The year-end target price suggests a high upside from the current market price. Therefore, I’m maintaining a buy rating on OP Bancorp.
California’s Economic Factors to Sustain Loan Growth
OP Bancorp’s loan growth slowed to 3.9% in the second quarter from 8.8% in the first quarter of 2022. Going forward, loan growth will likely decelerate even further as the increasing interest rates will tone down credit demand.
On the plus side, regional economic strength will likely continue to support loan growth. OP Bancorp mostly operates in California, with a concentration in Los Angeles. The company also has some presence in Atlanta GA, Aurora CO, Lynnwood WA, Seattle WA, and Carrollton TX. OP Bancorp focuses on Korean Americans, but it’s not limited to them alone. The coincident economic activity index for California paints a promising picture, which should keep loan growth elevated in that region.
Federal Reserve Bank of Philadelphia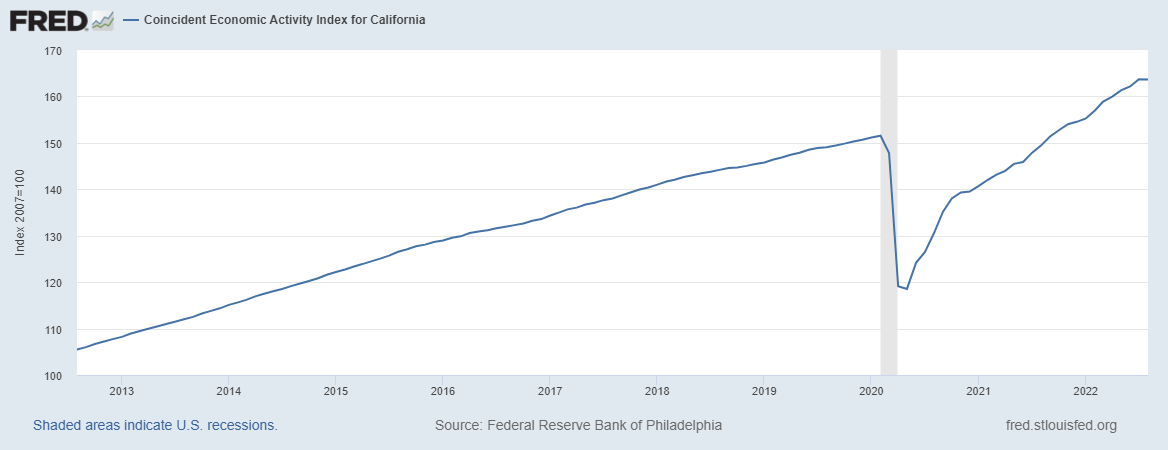
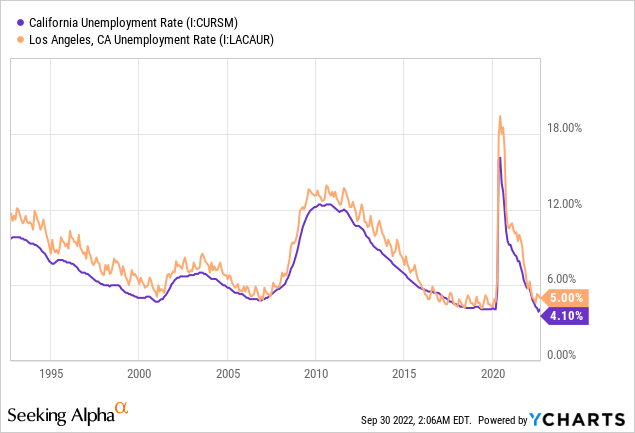
Further, the unemployment rate for the state has improved considerably, as shown below.
Considering these factors, I’m expecting the loan portfolio to grow by 3% every quarter till the end of 2023. This will lead to loan growth of 19.9% for 2022. In my last report on OP Bancorp, I projected a loan growth of 18.9% for 2022. I’ve slightly increased my loan growth estimate because the second quarter’s performance beat my previous expectation.
Meanwhile, I’m expecting deposits and other balance sheet items to grow somewhat in line with loans. The following table shows my balance sheet estimates.
| FY18 | FY19 | FY20 | FY21 | FY22E | FY23E | |
| Financial Position | ||||||
| Net Loans | 865 | 980 | 1,084 | 1,298 | 1,556 | 1,752 |
| Growth of Net Loans | 17.1% | 13.2% | 10.6% | 19.7% | 19.9% | 12.6% |
| Other Earning Assets | 63 | 68 | 129 | 251 | 270 | 292 |
| Deposits | 905 | 1,021 | 1,200 | 1,534 | 1,848 | 2,080 |
| Borrowings and Sub-Debt | – | 10 | 13 | 10 | 10 | 11 |
| Common equity | 130 | 141 | 143 | 165 | 184 | 215 |
| Tangible BVPS ($) | 8.3 | 8.8 | 9.4 | 10.9 | 12.1 | 14.1 |
|
Source: SEC Filings, Author’s Estimates (In USD million unless otherwise specified) |
Loan and Deposit Mixes Make the Margin Moderately Rate Sensitive
The average loan yield is moderately rate-sensitive thanks to the presence of variable-rate loans, which make up 36.9% of total loans, as mentioned in the latest earnings presentation. Further, hybrid loans totaling $23 million will reprice within one year, representing 2% of total loans.
The deposit cost, on the other hand, will be somewhat sticky as around 47% of the deposit book comprised of non-interest-bearing deposits at the end of June 2022. However, money market and other interest-bearing deposits that reprice frequently made up 30% of total deposits. These quick-to-reprice deposits will let the average deposit cost rise as interest rates increase. Additionally, certificates of deposits totaling around $160 million will mature in the third quarter and around $59 million will mature in the fourth quarter of 2022, altogether representing 13% of total deposits.
The results of the management’s interest rate sensitivity analysis given in the 10-Q filing showed that a 200-basis points hike in interest rates could increase the non-interest income by 5.46% over twelve months.
2Q 2022 10-Q Filing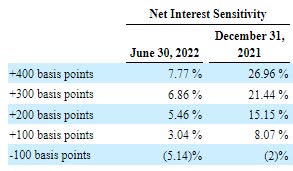
Historically as well, the margin has been only slightly rate-sensitive.
2Q 2022 Earnings Presentation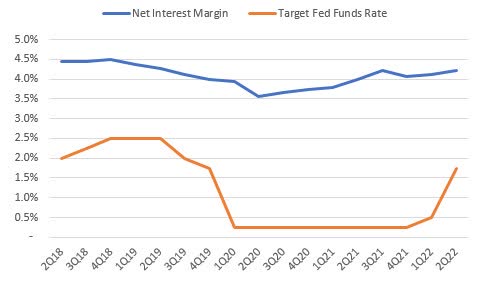
Considering these factors, I’m expecting the margin to grow by 20 basis points in the second half of 2022 and by 5 basis points in 2023. Compared to my last report on OP Bancorp, I’ve slightly increased my margin estimate as my interest rate outlook is now more hawkish than before.
Expecting Earnings to Grow by 19%
The anticipated loan growth and margin expansion will be the key drivers of earnings in the next year and a half. On the other hand, growth in non-interest expenses will restrict the increase in earnings. OP Bancorp reported a surge of 19% in non-interest expenses during the second quarter, which exceeded my expectations. Going forward, non-interest expenses will likely remain elevated due to the impact of inflation on salary expenses. Additionally, the low unemployment rate is already leading to wage pressure as OP Bancorp cannot afford to lose its employees in the current market.
Meanwhile, the provisioning will likely remain at a normal level through the end of 2023. Non-performing loans were 0.15% of total loans, while allowances were 1.19% of total loans at the end of June 2022. This allowance coverage appears somewhat excessive; therefore, I’m not expecting economic headwinds, including high inflation, to lead to higher provisioning in future quarters. I’m expecting the net provision expenses to make up around 0.21% of total loans every quarter till the end of 2023, which is the same as the average for the last five years.
Overall, I’m expecting OP Bancorp to report earnings of $2.25 per share for 2022, up 19% year-over-year. Further, I’m expecting the company to report earnings of $2.39 per share for 2023, up 6% year-over-year. The following table shows my income statement estimates.
| FY18 | FY19 | FY20 | FY21 | FY22E | FY23E | |||||
| Income Statement | ||||||||||
| Net interest income | 41 | 44 | 45 | 61 | 78 | 92 | ||||
| Provision for loan losses | 1 | 1 | 6 | 1 | 3 | 4 | ||||
| Non-interest income | 9 | 11 | 11 | 16 | 19 | 18 | ||||
| Non-interest expense | 30 | 33 | 32 | 36 | 45 | 50 | ||||
| Net income – Common Sh. | 14 | 16 | 13 | 29 | 34 | 36 | ||||
| EPS – Diluted ($) | 0.89 | 1.03 | 0.85 | 1.88 | 2.25 | 2.39 | ||||
|
Source: SEC Filings, Earnings Releases, Author’s Estimates (In USD million unless otherwise specified) |
||||||||||
Although I have increased my net interest income estimate, my updated full-year earnings estimate for 2022 is lower than my previous estimate of $2.28 per share given in my last report on the company. My earnings estimate has slightly declined because of the substantial jump in non-interest expenses.
Actual earnings may differ materially from estimates because of the risks and uncertainties related to inflation, and consequently the timing and magnitude of interest rate hikes. Further, a stronger or longer-than-anticipated recession can increase the provisioning for expected loan losses beyond my estimates.
Maintaining a Buy Rating
OP Bancorp is offering a dividend yield of 4.3% at the current quarterly dividend rate of $0.12 per share. The earnings and dividend estimates suggest a payout ratio of 20% for 2023, which is below the last three-year average of 23%. Therefore, there is room for a dividend hike next year. However, to remain on the safe side, I’m not assuming an increase in the dividend level.
I’m using the historical price-to-tangible book (“P/TB”) and price-to-earnings (“P/E”) multiples to value OP Bancorp. The stock has traded at an average P/TB ratio of 0.94 in the past, as shown below.
| FY19 | FY20 | FY21 | Average | |||
| T. Book Value per Share ($) | 8.8 | 9.4 | 10.9 | |||
| Average Market Price ($) | 9.5 | 7.2 | 10.5 | |||
| Historical P/TB | 1.08x | 0.77x | 0.96x | 0.94x | ||
| Source: Company Financials, Yahoo Finance, Author’s Estimates | ||||||
Multiplying the average P/TB multiple with the forecast tangible book value per share of $12.1 gives a target price of $11.4 for the end of 2022. This price target implies a 1.5% upside from the September 29 closing price. The following table shows the sensitivity of the target price to the P/TB ratio.
| P/TB Multiple | 0.74x | 0.84x | 0.94x | 1.04x | 1.14x |
| TBVPS – Dec 2022 ($) | 12.1 | 12.1 | 12.1 | 12.1 | 12.1 |
| Target Price ($) | 8.9 | 10.1 | 11.4 | 12.6 | 13.8 |
| Market Price ($) | 11.2 | 11.2 | 11.2 | 11.2 | 11.2 |
| Upside/(Downside) | (20.1)% | (9.3)% | 1.5% | 12.4% | 23.2% |
| Source: Author’s Estimates |
The stock has traded at an average P/E ratio of around 7.8x in the past, as shown below.
| FY19 | FY20 | FY21 | Average | |||
| Earnings per Share ($) | 1.03 | 0.85 | 1.88 | |||
| Average Market Price ($) | 9.5 | 7.2 | 10.5 | |||
| Historical P/E | 9.3x | 8.5x | 5.6x | 7.8x | ||
| Source: Company Financials, Yahoo Finance, Author’s Estimates | ||||||
Multiplying the average P/E multiple with the forecast earnings per share of $2.25 gives a target price of $17.5 for the end of 2022. This price target implies a 56.7% upside from the September 29 closing price. The following table shows the sensitivity of the target price to the P/E ratio.
| P/E Multiple | 5.8x | 6.8x | 7.8x | 8.8x | 9.8x |
| EPS 2022 ($) | 2.25 | 2.25 | 2.25 | 2.25 | 2.25 |
| Target Price ($) | 13.0 | 15.3 | 17.5 | 19.8 | 22.0 |
| Market Price ($) | 11.2 | 11.2 | 11.2 | 11.2 | 11.2 |
| Upside/(Downside) | 16.5% | 36.6% | 56.7% | 76.8% | 96.9% |
| Source: Author’s Estimates |
Equally weighting the target prices from the two valuation methods gives a combined target price of $14.4, which implies a 29.1% upside from the current market price. Adding the forward dividend yield gives a total expected return of 33.4%. Hence, I’m maintaining a buy rating on OP Bancorp.
Be the first to comment