

Richard Drury/DigitalVision via Getty Images
Introduction
In September, I wrote an article titled “Global Gas Shortages Are A Blessing For ONEOK Dividends”. Since then, the gas crisis has gotten a lot worse in Europe as well as other countries. It’s one of the reasons why inflation has come back roaring, which is currently hurting the stock market and the economy in general. Since October 4, the S&P 500 is down 10.3%. ONEOK Inc. (NYSE:OKE) is up 7.8% as it has two qualities that make it stand out: high-quality natural gas infrastructure and a high yield that comes in handy in these times.
While I have focused a lot on dividend growth in the past few months, I will discuss the benefits of buying high-yields in this article, using OKE as an example given the natural gas tailwind that allows the company to ramp up free cash flow to more than $2.2 billion next year, which not only secures the juicy 5.8% dividend yield but also opens up the opportunities for future hikes as debt is now slowly falling. Hence, this high-yielder is in a good spot to continue generating outperforming total returns.
Now, let’s look at the details!
Why High-Yield Investing Works
There’s more than one way to skin a cat. Or multiple roads lead to Rome to give you a vegetarian alternative. On June 6, I wrote an article covering Microsoft (MSFT). It was based on fundamental research that explained how low-volatility dividend growth investing is a very efficient way to generate outperforming returns. Even if you don’t care for Microsoft, I invite you to read the first half of the article, if you’re interested in the details that explain why dividend growth is the (or at least one) way to go.
In 2018, Global X Management published a presentation titled “High Dividend Stocks In Rising Interest Rate Environment”. 2018 is four years ago, but it’s still – if not more – important in this environment. After all, rising rates are one of the reasons why stocks are selling off.
The company focused on the highest decile of dividend-paying stocks, which means 10% of the highest dividend-paying stocks, back then, the average yield was 6.4%.
Global X Management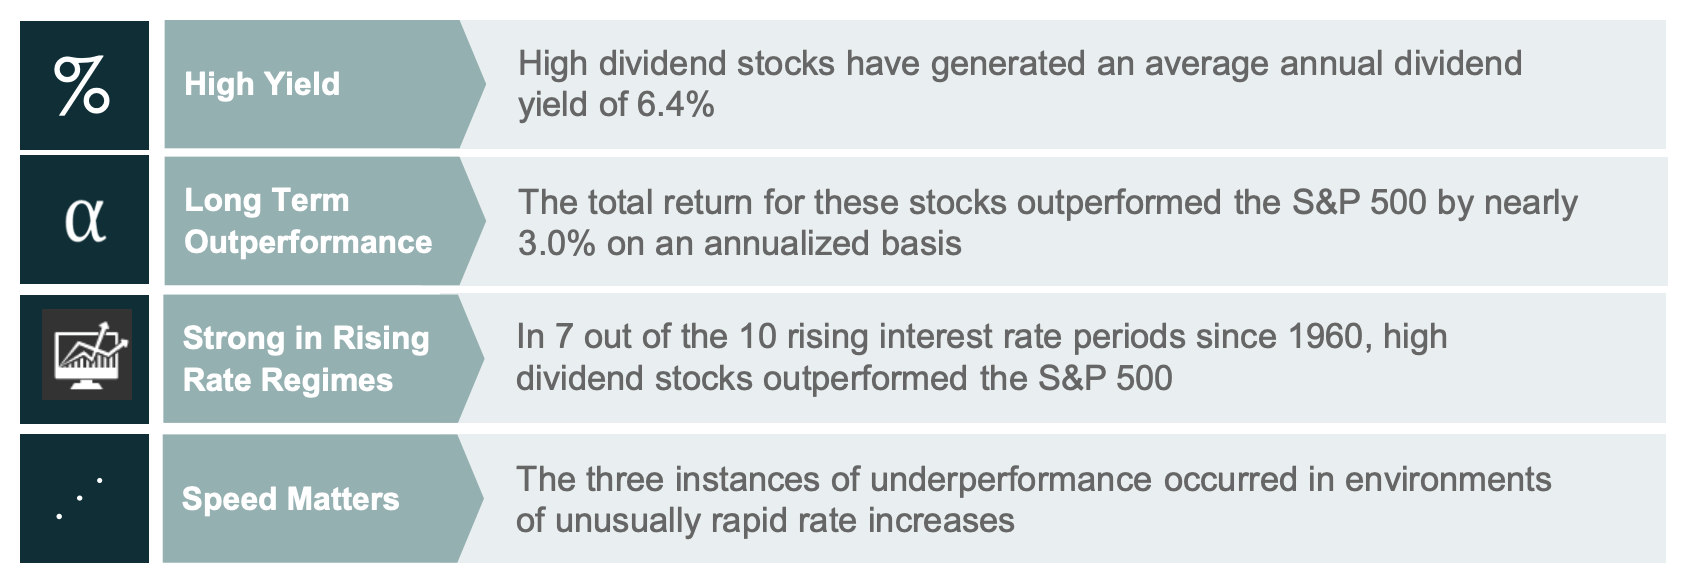
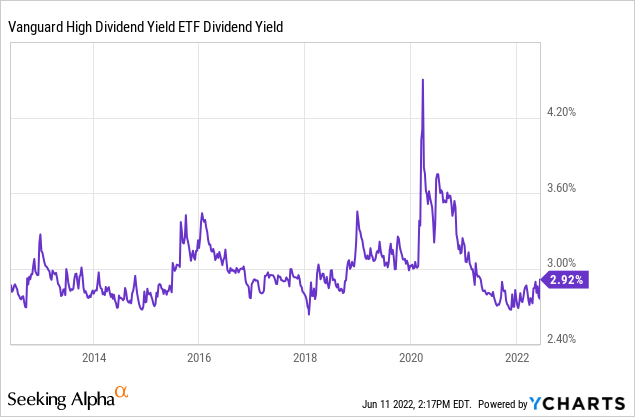
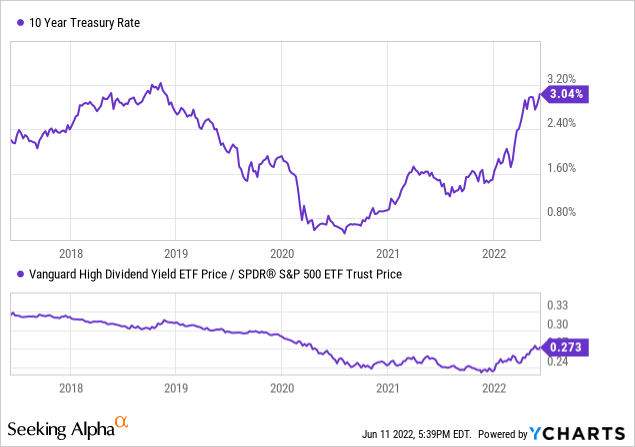
Right now, the “average” high dividend yield is 2.9% using Vanguard’s High Dividend Yield ETF (VYM) as a benchmark. 2.9% doesn’t sound like a lot, yet the yield is back at its 10-year median yield.
In the case of Global X, the company looked at 58 years’ worth of data (1960-2017), using the S&P 500 Total Return Index as a benchmark. In its presentation, the company showed that the 10% highest dividend payers generated half of their returns from their dividends. In other words, investors re-invested their dividend proceeds, which expanded their positions. The other half came from price returns.
Global X Management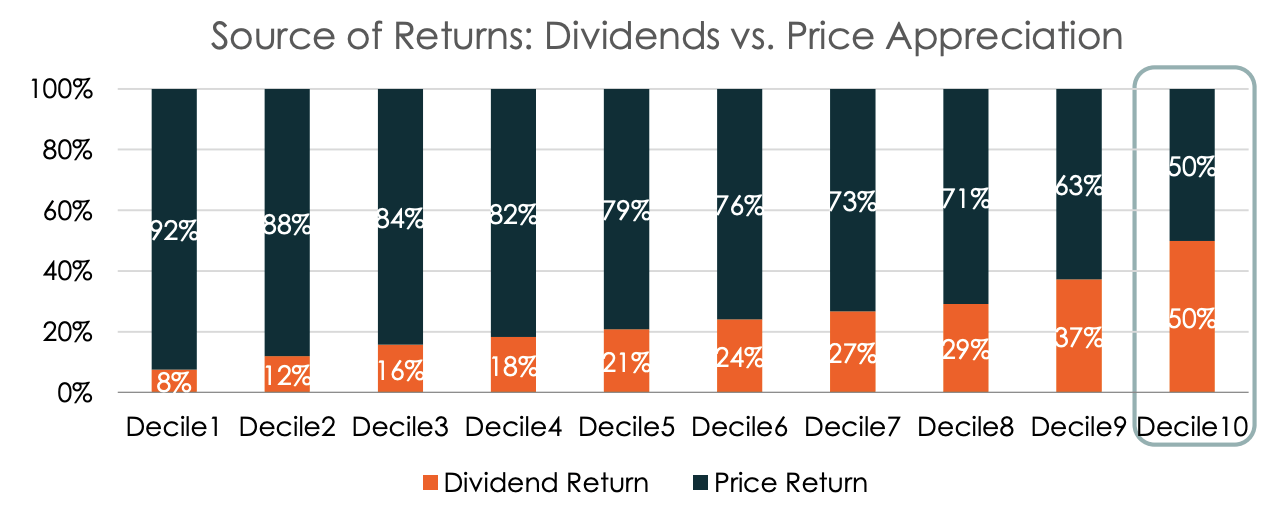
These high dividend stocks had a long-term correlation of 0.56 with the S&P 500 and 0.75 with the S&P 500 value index. This makes sense as “value” stocks tend to behave differently when rates rise. In times of rising rates, investors look for stocks that generate high free cash flow and have strong earnings instead of companies that generate a lot with expected profits somewhere in the future – discounting future growth becomes less attractive when rates rise.
Now, the good news is that high dividend stocks – when picking the right ones – aren’t just giving you a decent yield, but a strong total return as well. Between 1960 and 2017, high dividend stocks returned 13.0% per year. This beats the S&P 500 by 300 basis points. The standard deviation is also 300 basis points higher, which leads to a more favorable Sharpe ratio (volatility adjusted return).
Global X Management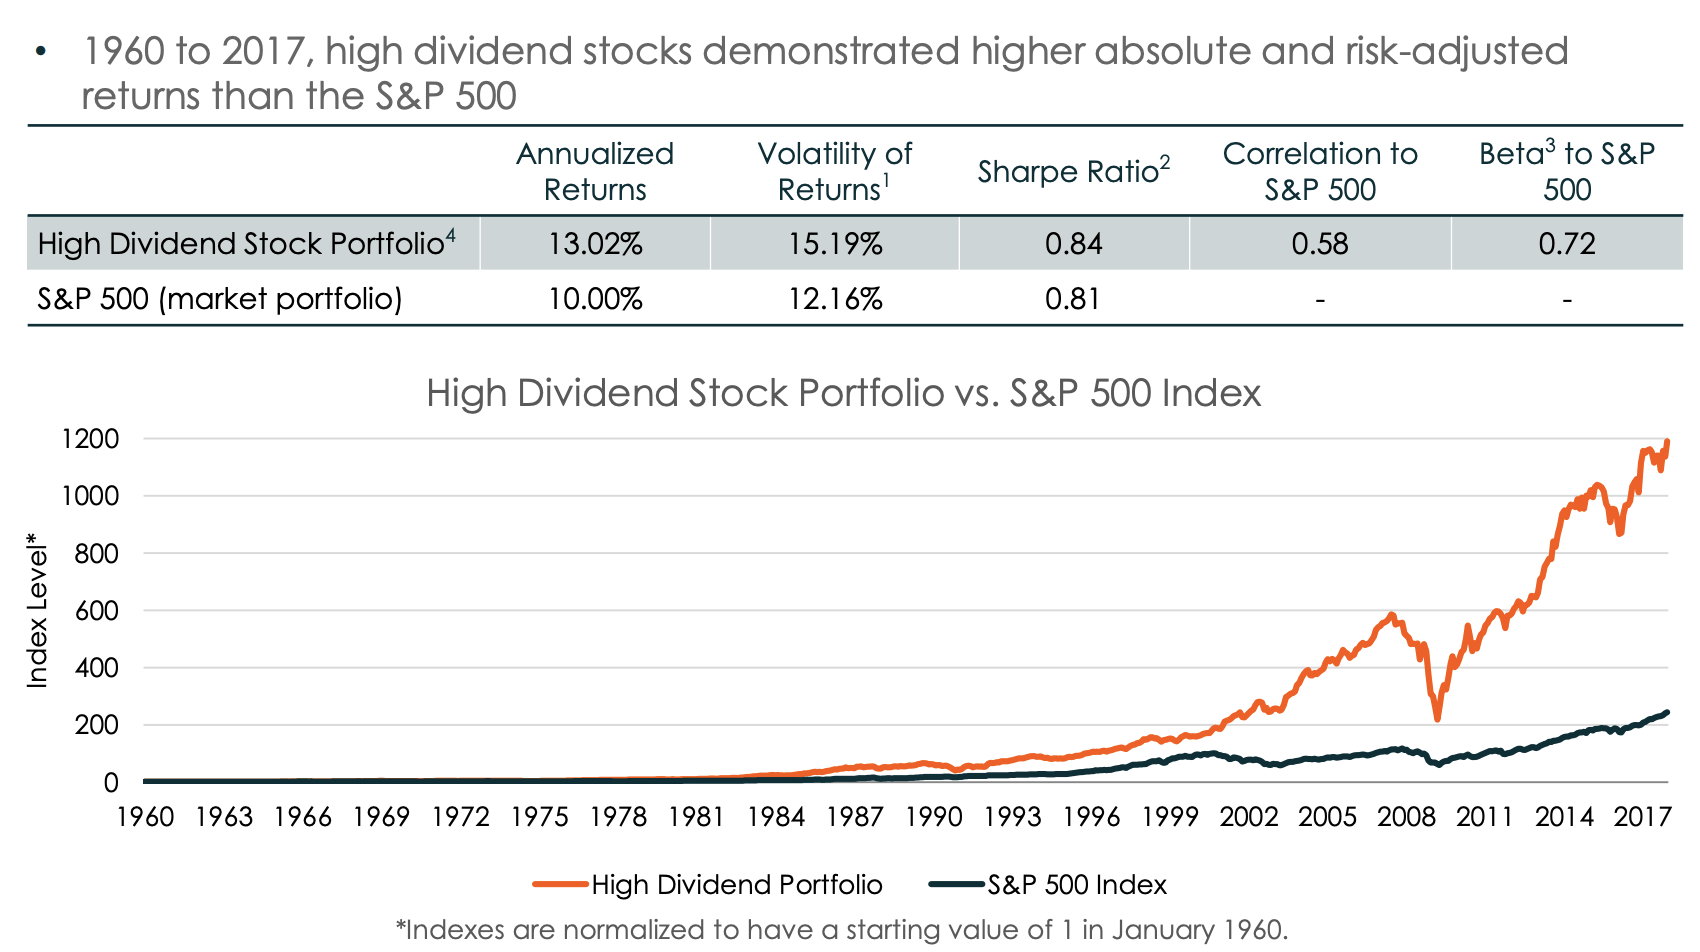
With regard to rising interest rates, high yield stocks outperformed the market in 7 out of 10 observed regimes.
According to Global X:
- Across rising interest rate regimes, high dividend stocks outperformed the market by an annualized average of 0.80%
- High dividend stocks outperformed the market in 7 out of the 10 observed rising interest rate regimes
- The three instances of underperformance occurred in periods with among the most rapidly increasing interest rates
Global X Management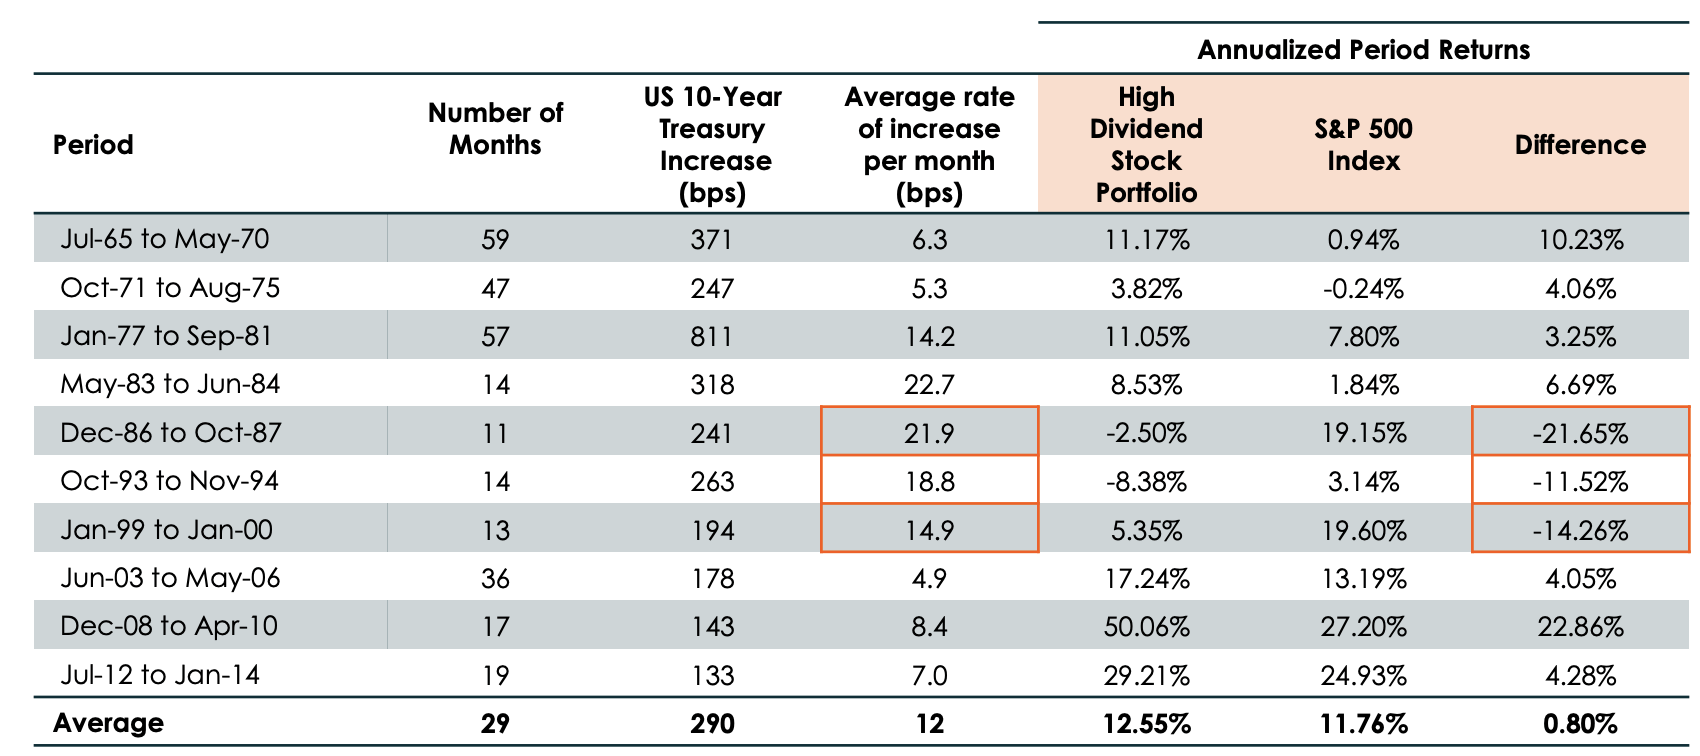
So far, this theory is turning out to be correct. The high yield ETF VYM is outperforming the S&P 500 – even when excluding dividends. Note that this started as soon as rates bottomed as the graph below shows.
With that said, here’s why ONEOK is a good pick.
Buying ONEOK’s High Yield
ONEOK is one of America’s biggest oil & gas midstream companies with a market cap of $28.9 billion.
The beauty of OKE is that the company is basically a highway for natural gas and related products. It makes money by allowing customers to use its pipeline network as it combines producers, processors, and customers of natural gas products.
It’s like owning a toll bridge.
As the map below shows, the company is well-diversified, connecting the major southern gas production areas to the Powder River Basin as well as Bakken and Williston in the north.
ONEOK Inc.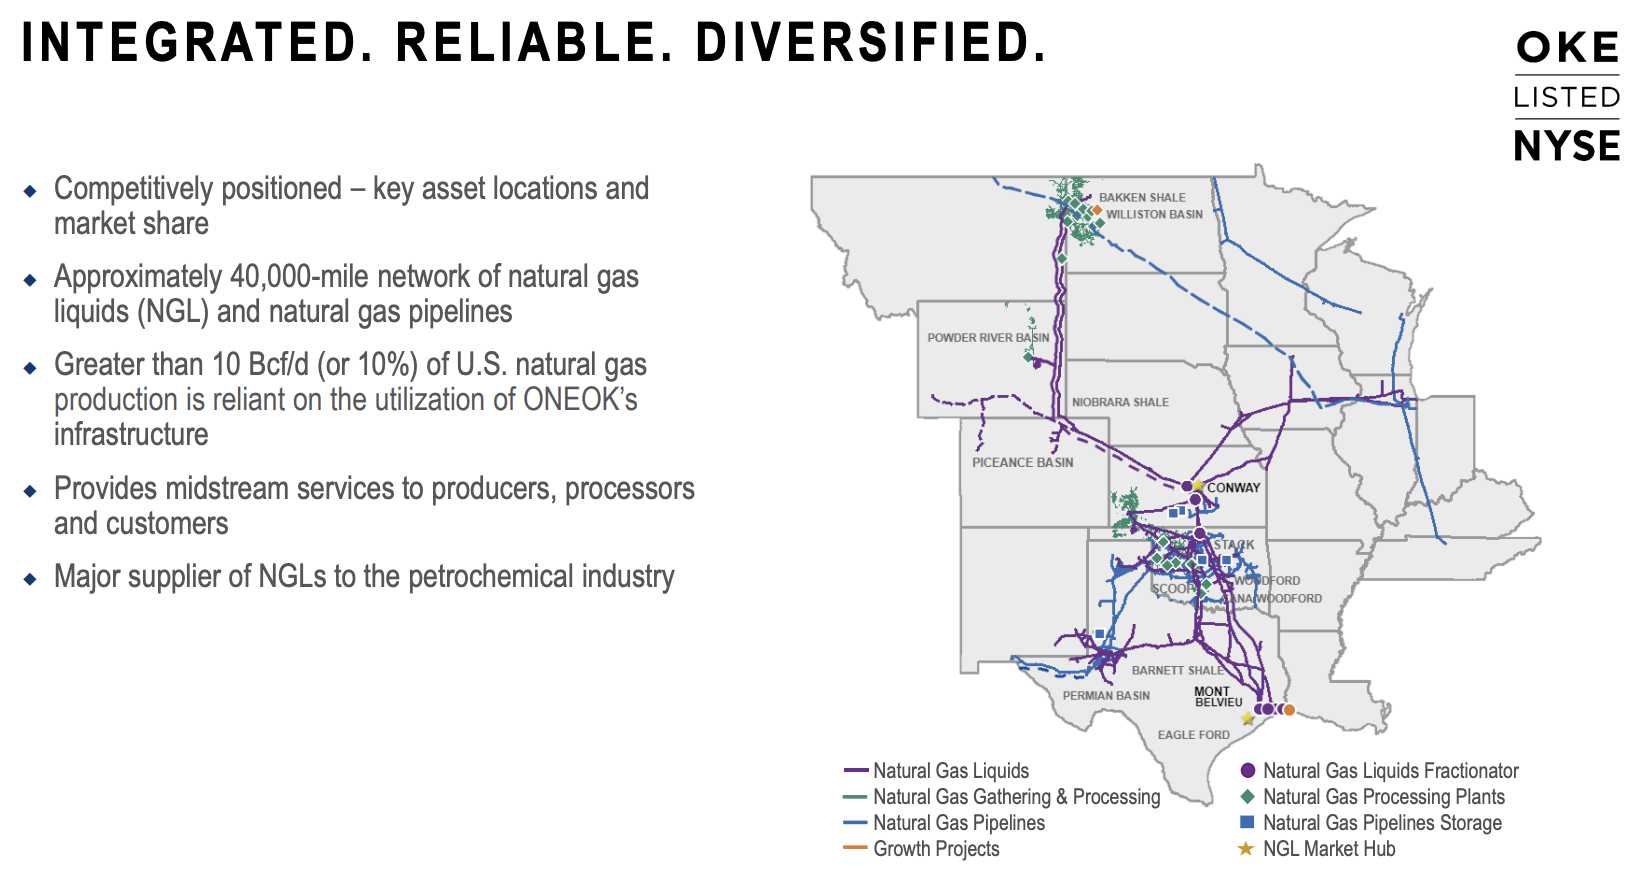
The network includes roughly 40 thousand miles of natural gas liquids and natural gas pipelines, covering more than 10 billion cubic feet per day. That’s roughly 10% of US natural gas production.
Just like a toll bridge, most of the company’s earnings are fee-based. Its largest segment, natural gas liquids, accounts for 60% of expected 2022 EBITDA. 90% of segment earnings are fee-based.
ONEOK Inc.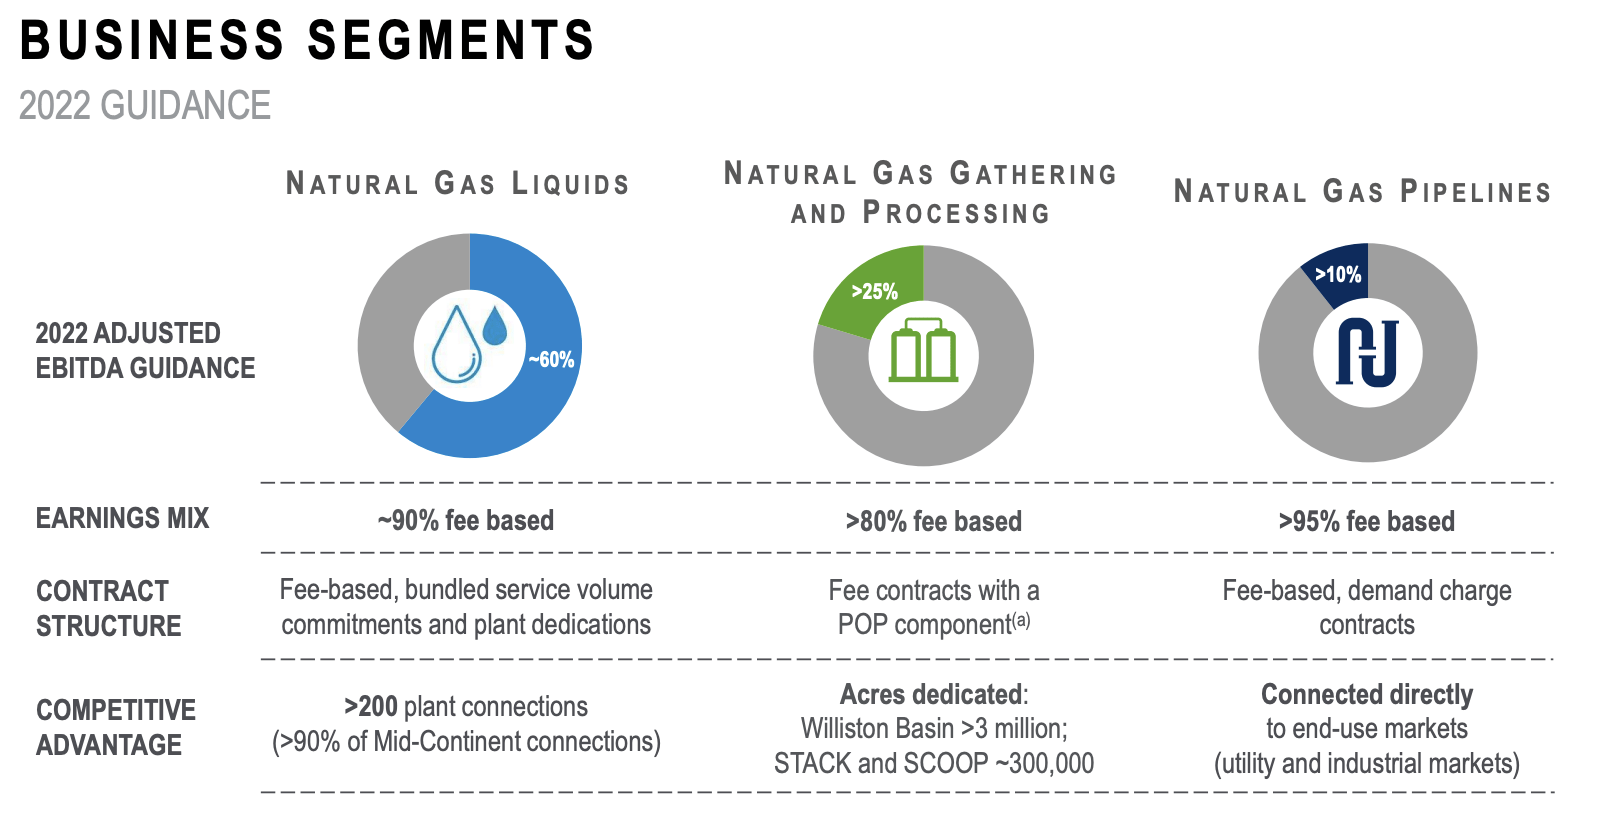
With that said, the company is operating in a very capital-intensive industry. Whereas a software company needs a building and smart programmers (to put it very bluntly), ONEOK needs to build and maintain a massive network of pipelines.
The graph below shows three financial indicators (including forecasts). Capital expenditures show that the company’s investment requirements have dropped significantly. This year, CapEx is expected to be less than $1.0 billion (again) with a drop towards $700 million in 2024. Prior to the pandemic (especially in the post-Great Financial Crisis years), the company had very high capital spending, which caused net debt to rise to almost $14 billion in 2020.
Now, net debt is declining as investments are lower and income higher. This is now leading to strong and rising free cash flow. Bear in mind that free cash flow is operating cash flow minus CapEx. It’s cash a company can spend on dividends, buybacks, and debt reduction.
TIKR.com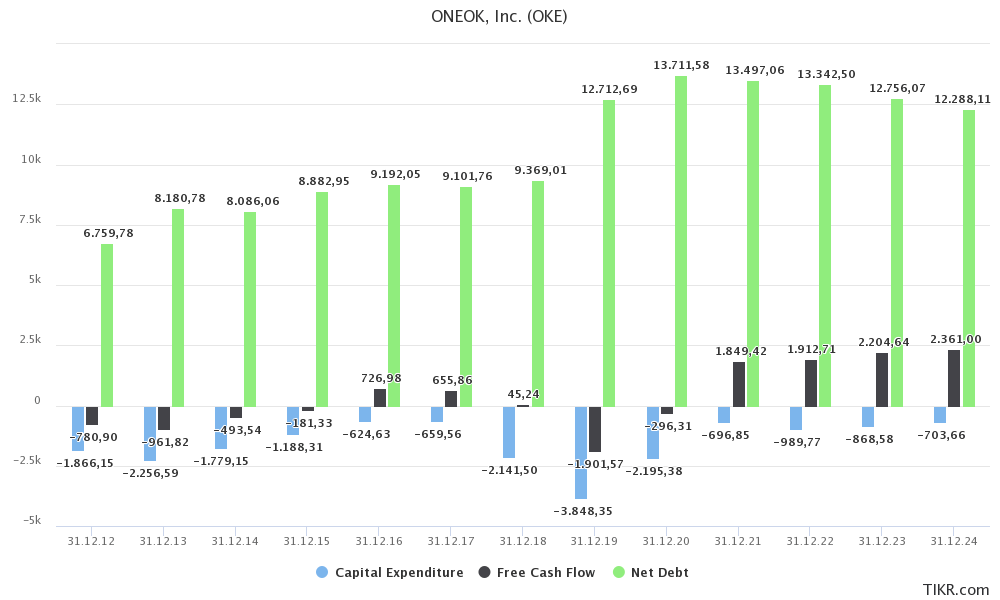
To give you another number, $2.2 billion in expected 2023 free cash flow is 7.6% of the company’s market cap.
What does that mean?
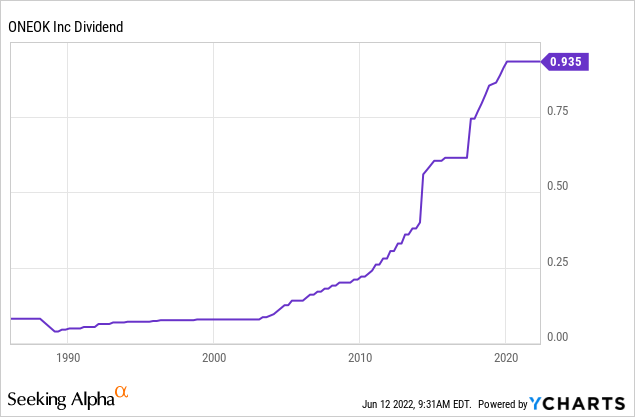
First of all, the company pays a $0.935 quarterly dividend. The dividend has been unchanged since early 2020. This quarterly dividend translates to an annual dividend of $3.74, which implies a 5.8% dividend yield.
Given the implied free cash flow yield of 7.6%, the company’s dividend is safe. Moreover, there is room to grow the dividend in the future as net debt is declining. If the company can lower net debt to $12.8 billion next year, it would imply a net leverage ratio of 3.3x (EBITDA). That’s one of the best numbers in recent history.
What’s remarkable is that OKE’s dividend growth is everything except slow. Including a flat dividend since early 2020, the 10-year average annual dividend growth is 13.8%. This beats a lot of low-yield dividend growth companies.
Note the following comment from management regarding its debt:
Our net debt-to-EBITDA on an annualized run-rate basis remains below 4 times, and we continue to view 3.5 times or lower as our long-term aspirational leverage goal.
While I cannot promise anything, I am fairly sure that dividend growth will soon resume as the company’s leverage ratio is getting not only close to its target, but it’s also likely that it will drop well below this target in the years ahead.
With that said, and with regard to the first half of this article, OKE is outperforming the market, even if it comes with significant volatility.
Since 1985, OKE has returned 13.9% including dividends (total return). This beats the S&P 500 by 300 basis points, resulting in a much higher final balance. Note that this happened despite a number of very steep drawdowns. The worst drawdown was -73%. The two most recent drawdowns happened during the 2014/2015 commodity crash and the 2020 pandemic when investors feared that exploration of natural gas and consumption would plummet.
Portfolio Visualizer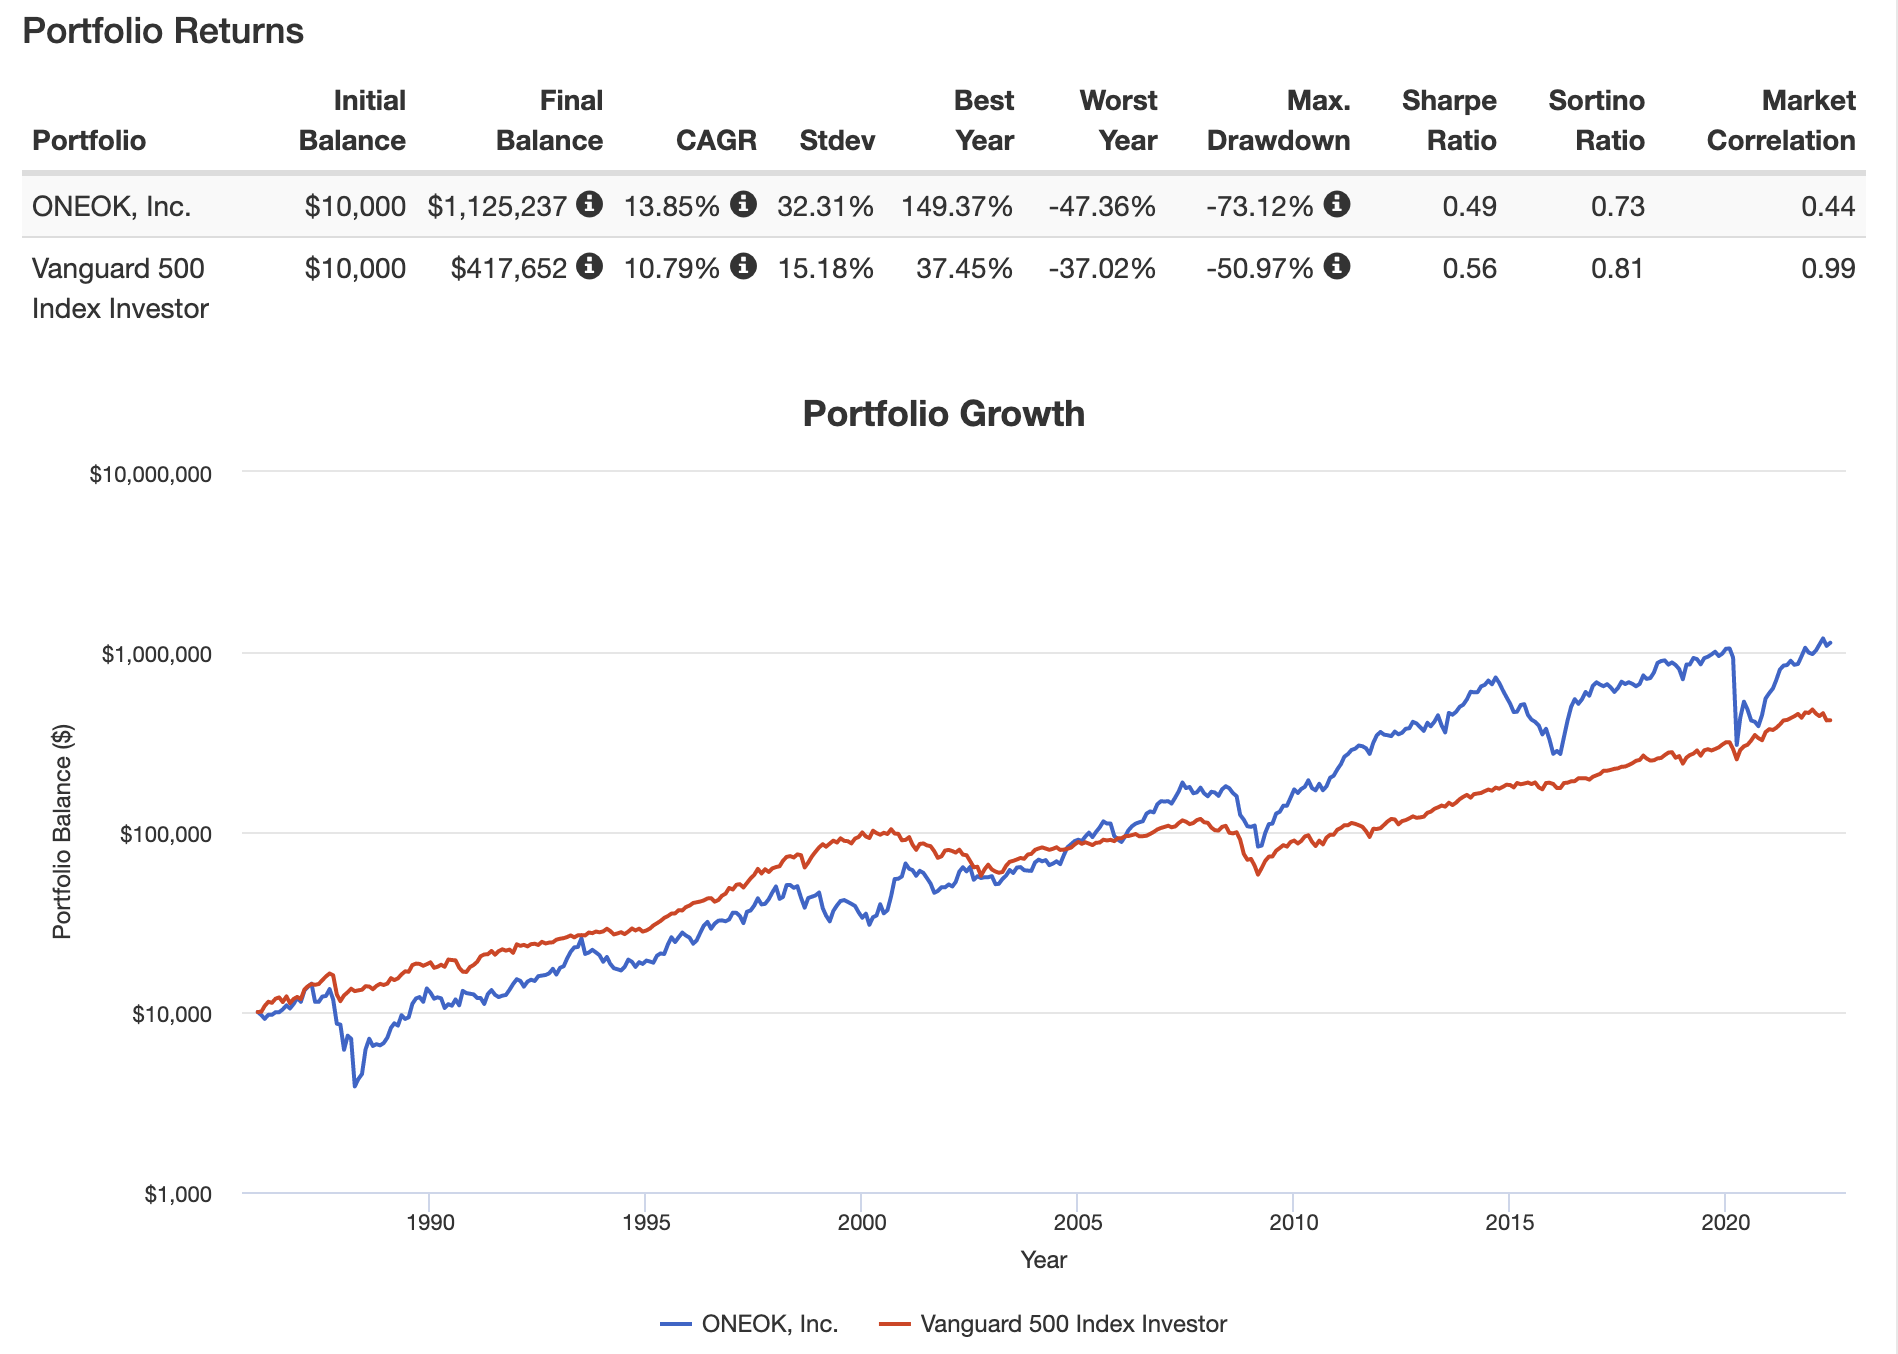
In other words, despite this outperformance, the company scores a lower Sharpe Ratio (volatility-adjusted return) than the S&P 500.
Note that I do expect volatility to drop because the company is now generating strong free cash flow. Moreover, I believe that natural gas demand will remain very high as Europe is diversifying away from Russia with Asian countries pushing hard to get rid of coal. I explained that in greater detail in my previous article, which I referred to in the introduction of this article.
Yet, bear in mind that OKE will remain volatile when you make an investment decision.
So, what about the valuation?
OKE Stock Valuation
When adding the company’s $28.9 billion market cap to $12.8 billion in 2023 expected net debt, we end up with an enterprise value of $41.7 billion. This is 10.7x expected 2023 EBITDA of $3.9 billion.
Overall, OKE is trading higher than companies like Exxon Mobil (XOM) which produce oil. OKE’s income is less cyclical and free cash flow is more predictable. Hence, the stock has traded close to 13-14x EBITDA ignoring outliers.
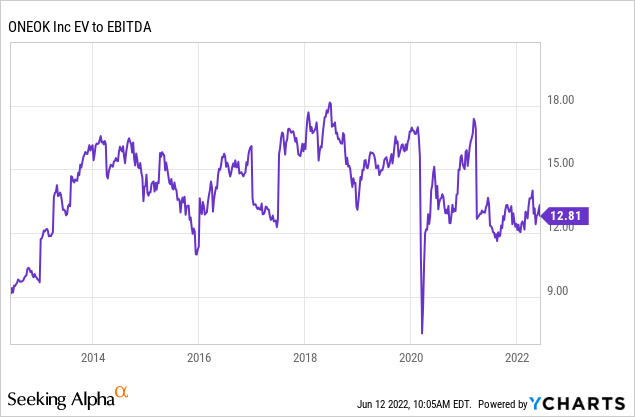
To give this stock a “fair” value, I would make the case that a 13x EBITDA valuation is appropriate, which would indicate 31% (let’s call it 30%) stock upside to a market cap of $37.9 billion. That would imply an $84.9 stock price.
However, please be aware that it may take a while until OKE reaches that target. The market is volatile and while I expect OKE to outperform the market, it’s a very tricky environment for both traders and investors. So again, please keep that in mind.
Takeaway
The main goal of this article was to come up with what I consider to be a solid high dividend yield pick. Not just because I mainly focused on dividend growth in the past few months, but also to explain how high-yield stocks can lead to outperformance.
Right now, we’re in a market environment of rising rates and fundamental support for energy companies. That’s a huge win for ONEOK, which is one of America’s largest midstream companies.
The company is in a good spot as natural gas demand is high while its investment requirements are down. This (finally) allows the company to boost free cash flow used to reduce net debt towards (and below) its net leverage goal. This will almost certainly make its current dividend yield of 5.8% even juicier in the years ahead.
Moreover, I believe that OKE is at least 30% undervalued, which makes longer-term outperformance even more likely.
The only reason why I don’t own OKE is my 20% energy exposure, which I would like to keep close to 20%.
(Dis)agree? Let me know in the comments!
Be the first to comment