

jittawit.21
Investment Summary
Continuing on from previous examination of Omnicell, Inc.’s (NASDAQ:OMCL) investment case, I’ve opened up the numbers a bit more for investors to see deeper into the company’s growth engine. Using a hard-data approach, I focused on illustrating the downtrends in profitability and weakening bottom-line fundamentals that put future earnings upside at risk. Looking ahead, the valuation isn’t supported by earnings growth [even using non-GAAP earnings] and from its return on capital invested, maximum growth rates look capped for now. This is without applying another risk-adjustment for the macro-landscape. Investors should therefore tread with caution in this name and consider remaining on the sidelines if seeking to be long OMCL shares. Net-net, we reiterate the hold rating on OMCL and have re-rated the stock to ~$51.
Weakening bottom-line fundamentals, leading share price lower
As seen in Exhibit 1 quarterly operating performance has been lumpy over the past 7-years to date for OMCL. After a period of top-bottom line growth throughout the pandemic era, the company’s bottom-line fundamentals have softened markedly from Q3 FY21 to date. In particular, operating income tightened from a high of $28.9 million (“mm”) in Q2 FY21 to just c.$6mm in Q1 FY22, a decline of more than 79%. Free cash flow (“FCF”) also fell into the red with a $31mm loss in Q1 FY22, down from $43mm profit the quarter prior, whereas EPS also pulled back substantially in these times to just $0.20, back to FY18 levels for OMCL.
Exhibit 1. Quarterly operating performance has weakened substantially in recent quarters [Q3 FY21-date].
Image: HB Insights. Data: OMCL SEC Filings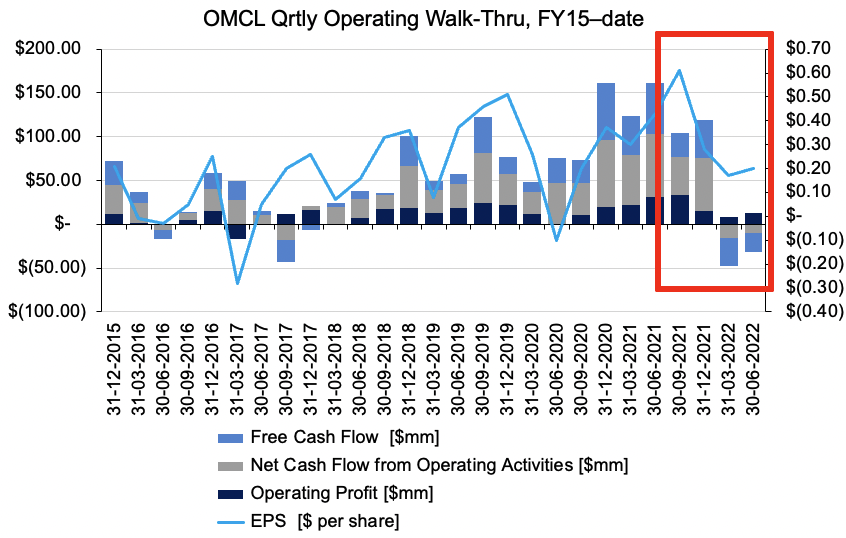
OMCL’s weakening bottom-line fundamentals, measured here by forward-FCF estimates, looks to have led its share price lower over the past 4-5 quarters, as seen in the chart below. We’ve included our internal FCF estimates for the company on the chart to show the deviances from consensus. In both cases, the estimate FCF for OMCL has exhibited a tight causal relationship and therefore gives us good insight into the market’s pricing of the stock looking ahead. As observed below, the OMCL share price has given up all its post-pandemic gains, now trading back in-line with FY19 levels. With FCF growth plateauing in FY21, the stock also looked toppish’ on the charts, before FCF estimates began to drift lower into the FY22 period.
These trends in bottom-line estimates have continued this year and led OMCL lower, and with no change in the trajectory suggests there is further downside to be expected for the company into the coming periods. We’ve forecasted OMCL to print $29mm in FCF this year, down from $173mm in FY21, before recovering to $190mm in FCF for FY23. This is subject to change with the evolution of macro-indicators over the coming 6-12 months. This puts a large dampener on the risk/reward calculus OMCL.
Exhibit 2. OMCL bottom-line fundamentals [FCF estimates] leading share price lower, with FY22 forecasts pointing to further downside
Note: Consensus estimates drawn from Bloomberg Finance and Refinitiv Eikon Consensus data. HB Insights internal estimates not publicly available. All estimates for subsequent quarter. Share price recorded as daily close. (Data: HB Insights Estimates, Bloomberg Finance, Refinitiv Eikon)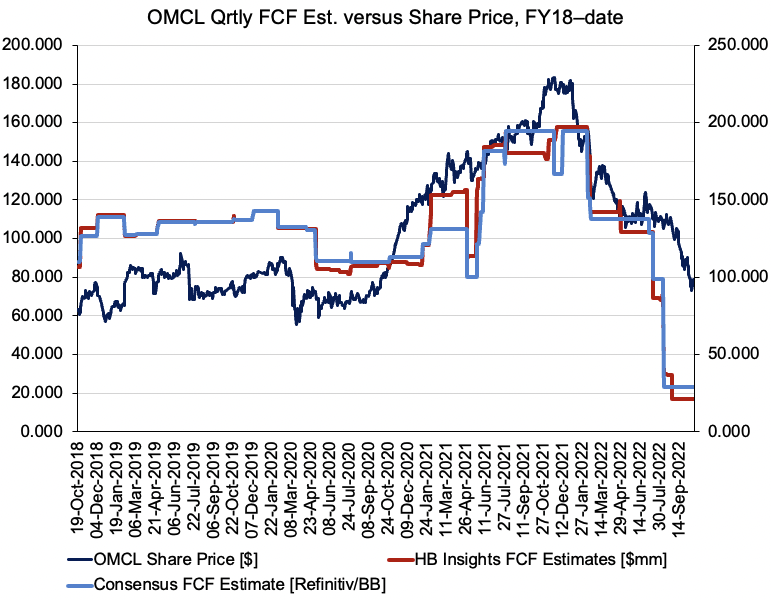
OMCL profitability, value-add dwindling
In light of the current macro-landscape I also wanted to review OMCL’s propensity to generate cash and grow into the weakening business cycle. Unfortunately, the data reveals it’s equally as difficult to build out the investment case on this level. The table below measures the quarterly economic profit, or value-added (“EVA”), OMCL generated over the last 3 periods to date. EVA is the surplus profit a company generates above its cost of capital [debt, equity, preferreds] and as noted, OMCL has generated a lack/loss of EVA over this period, with trends worsening over time. Ideally, the company generates a surplus in cashflow/profit above its capital costs, suggesting it can continue/is continuing to grow its corporate value.
Exhibit 3. OMCL EVA has been insufficient, failing to overcome the cost of capital
Note: EVA measures profitability above a certain cost of capital, including opportunity cost. All figures measured in $mm of %. (Data: HB Insights, OMCL SEC Filings)
It is therefore unsurprising to see the return on OMCL’s investments turn off previous highs in late FY21 as well, as seen in Exhibit 4. Looking back at the company’s return on invested capital (“ROIC”) cycle, we see there has been two cyclical periods over the past 5-years to date. Both cycles lasted on average 4 quarter before returning to range.
After two large downswings in ROIC [FY17; FY20], and therefore forward-looking growth, the long-term trend has been one of overall incline. If the company’s capital budgeting cycle is to replicate the previous two cycles, this current downswing may begin to turn back up within the next 2-3 quarters. Noteworthy however is the state of the global economy relative to the previous two cycles, and what this means for the company’s forward looking growth. In addition, the company printed ROIC if 0.77% [3.11% annualized] last quarter, below the 1.68% [6.89% annualized] quarterly average sustained since FY17. Growth is explicitly tied to organic growth potential [i.e., ex-leverage] and therefore the wind-back suggests OMCL can support a maximum annual growth rate of ~3.10% versus ~6.9% [without external capital], again putting a clamp on forward estimates. Added the fact EVA is negative, that ROIC doesn’t cover the WACC hurdle, plus weaker free-cash estimates looking ahead, the risk/reward asymmetry begins to converge.
Exhibit 4. Return on investments have dwindled but remain within cyclical up-trend. Question becomes where these numbers head with respect to the economic climate.
Note: ROIC calculated as NOPAT divided by last period’s invested capital. No reconciliations from GAAP earnings made. (Data: HB Insights, OMCL SEC Filings, Refinitiv Eikon)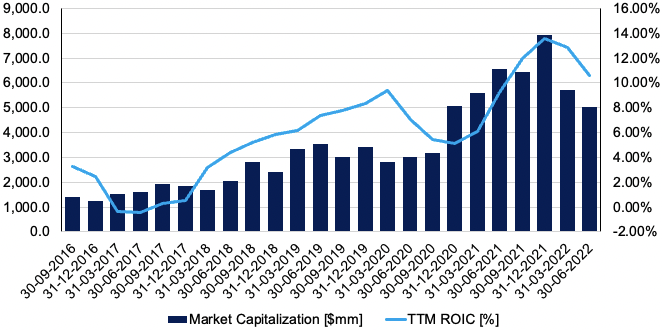
Valuation and conclusion
Shares are priced at a premium to peers across multiples used in this analysis, as seen in the chart below. It is, however, trading at a relative discount at 2.9x book value – although this still seems marginally expensive considering the company’s TTM return on equity (“ROE”) is 7.36%, and thus the investor ROE is just 2.54%, and doesn’t cover our equity risk premium. I suggest that paying more than 46x earnings for a weakening growth outlook [as described in sections above] doesn’t represent compelling value at all. In addition, I also argue there are more selective opportunities that offer a more compelling investment outlook versus OMCL this stage.
Exhibit 5. Multiples and comps
Data: HB Insights, Refinitiv Datastream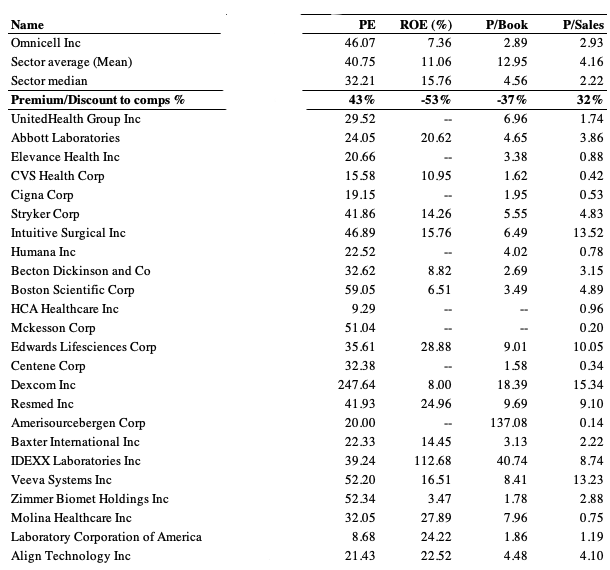
Shares also look to be overvalued when utilizing the below model to assign a fair value to the OMCL share price. Here I looked at the company’s projected EPS and compared this to its historical [normalized] 3-year TTM EPS, both using non-GAAP earnings. We project $3.45 in EPS for OMCL this financial year, a step behind previous growth rates. As can be seen, the company trades on a TTM earnings yield of 6.7% [non-GAAP], and this suggests it should trade at ~15x forward P/E using this model. Assigning this multiple to our FY22 EPS estimates implies a valuation of $51.52, or 31% downside potential.
Exhibit 6.
Note: OMCL TTM Earnings yield = [OMCL TTM EPS / Market Value]. All EPS figures are non-GAAP as provided by Refinitiv Eikon historical data. Fair valuation model adopted from BofA Fundamental/Valuation Fair Value Model. Inflation Swaps data retrieved from FRED. (Data: HB Insights Estimates, Refinitiv Eikon, FRED, )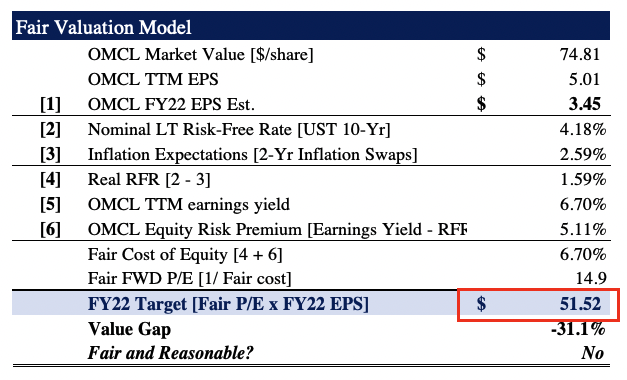
Net-net, OMCL continues to justify its exclusion from equity portfolios at this time. On examination of the data, there appears to be a lack of earnings upside in the coming periods, and this could impact materially on to the share price, especially given shifting macro-fundamentals. This is also backed by the company’s trend of weakening fundamental momentum at the bottom line. With these pointers in mind, I rate OMCL a hold on a $51.52 per share valuation.
Be the first to comment