

benkrut
Earnings of Old Second Bancorp, Inc. (NASDAQ:OSBC) will most probably continue to grow this year on the back of substantial margin expansion. Further, the bottom line will receive some support from subdued loan growth. Overall, I’m expecting the company to report earnings of $1.90 per share for 2023, up 31% from my estimated earnings of $1.45 per share for 2022. The December 2023 target price suggests a moderately-high upside from the current market price. Therefore, I’m adopting a buy rating on Old Second Bancorp.
Rate Hikes and High Rate-Sensitivity to Boost the Margin
Old Second Bancorp’s net interest margin surged by 77 basis points in the third quarter following a growth of 31 basis points in the second quarter of 2022. The significant margin expansion was partly attributable to loan mix improvement, as the management shifted funds from lower-yielding securities to higher-yielding loans. Securities carried an average yield of only 2.52%, while loans carried a much higher yield of 4.93% during the third quarter, as mentioned in the 10-Q filing.
The margin expansion was also attributable to the fed funds rate hikes and a commercial-heavy loan portfolio that’s quick to reprice. I’m expecting a further 75 basis points fed funds rate hike in the first half of 2023 before rates plateau in the second half of the year. Therefore, the yields will likely continue to move up this year, which will, in turn, lift the margin.
The margin will also benefit from the moderate balance of non-interest-bearing deposits, which makes the deposit cost somewhat sticky. As of the end of September 2022, non-interest-bearing deposits made up 39.7% of total deposits.
The results of the management’s interest-rate simulation model show that a 200-basis points hike in interest rates could boost the net interest income by a whopping 17.3%, as mentioned in the 10-Q filing. Considering these factors, I’m expecting the margin to have grown by 20 basis points in the last quarter of 2022. I’m expecting the margin to grow by another 20 basis points in 2023.
Subdued Loan Growth to Lend Support to the Bottom Line
Old Second Bancorp’s loans continued to grow strongly in the third quarter of 2022. The portfolio grew by 6.7% during the quarter, which is quite remarkable given the company’s history. In the past, the company’s organic loan growth has ranged from low-to-mid-single digits. I’m expecting the rising interest rates to force loan growth to revert to this historical trend. The management also mentioned in the conference call that it expects loan growth to slow down in the fourth quarter relative to the third and second quarters. Nevertheless, the management is positive about the fourth quarter’s loan growth because the pipelines at the start of the quarter were better than they’ve been in the same period in previous years.
Old Second Bancorp mainly operates in Illinois, whose economy isn’t doing as well as the rest of the country. The state currently has the second-worst unemployment rate among all states, according to official sources. Further, the state’s economic activity is in worse condition than the rest of the country. As shown below, Illinois’ trendline for economic activity is flatter than the national average.
The Federal Reserve Bank of Philadelphia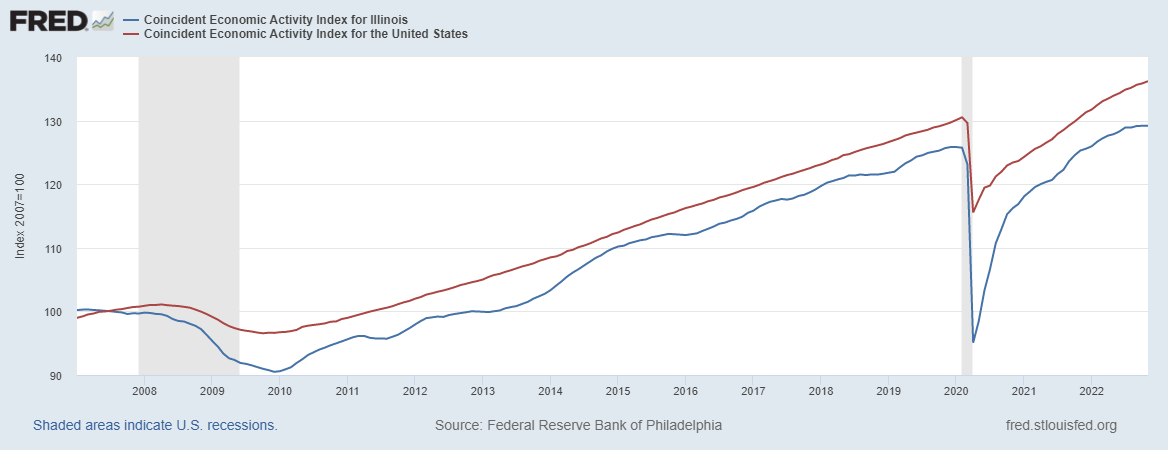
Considering these factors, I’m expecting the loan portfolio to have grown by 3% in the last quarter of 2022, taking full-year loan growth to 17%. For 2023, I’m expecting the loan portfolio to grow by 3.5%. Further, I’m expecting deposits to grow in line with loans. The following table shows my balance sheet estimates.
| Financial Position | FY18 | FY19 | FY20 | FY21 | FY22E | FY23E |
| Net Loans | 1,878 | 1,911 | 2,001 | 3,377 | 3,935 | 4,075 |
| Growth of Net Loans | 17.4% | 1.8% | 4.7% | 68.7% | 16.5% | 3.5% |
| Other Earning Assets | 574 | 514 | 824 | 2,425 | 1,631 | 1,681 |
| Deposits | 2,117 | 2,127 | 2,537 | 5,466 | 5,361 | 5,578 |
| Borrowings and Sub-Debt | 313 | 206 | 161 | 199 | 202 | 208 |
| Common equity | 229 | 278 | 307 | 502 | 453 | 530 |
| Book Value Per Share ($) | 7.6 | 9.1 | 10.2 | 16.3 | 10.0 | 11.7 |
| Tangible BVPS ($) | 6.8 | 8.4 | 9.5 | 13.0 | 7.8 | 9.5 |
| Source: SEC Filings, Author’s Estimates(In USD million unless otherwise specified) | ||||||
Expecting Earnings to Surge by 31% this Year
The anticipated margin expansion will likely be the biggest earnings driver for 2023. Further, the bottom line will receive some support from subdued loan growth. On the other hand, inflation-driven growth in operating expenses will restrict the increase in earnings. The management mentioned in the conference call that it was experiencing wage pressures and had already significantly increased wages across the retail network.
Meanwhile, I’m expecting the provision expense to remain near a normal level. I’m expecting the net provision expense to make up around 0.1% of total loans in 2023, which is close to the average from 2017 to 2019.
Overall, I’m expecting Old Second Bancorp to report earnings of $1.45 per share for 2022, up 122% year-over-year. For 2023, I’m expecting earnings to grow by 31% to $1.90 per share. The following table shows my income statement estimates.
| Income Statement | FY18 | FY19 | FY20 | FY21 | FY22E | FY23E |
| Net interest income | 91 | 97 | 92 | 97 | 200 | 249 |
| Provision for loan losses | 1 | 2 | 10 | 4 | 7 | 4 |
| Non-interest income | 31 | 36 | 37 | 39 | 43 | 37 |
| Non-interest expense | 77 | 79 | 81 | 104 | 148 | 166 |
| Net income – Common Sh. | 34 | 39 | 28 | 20 | 65 | 86 |
| EPS – Diluted ($) | 1.12 | 1.30 | 0.92 | 0.65 | 1.45 | 1.90 |
| Source: SEC Filings, Earnings Releases, Author’s Estimates(In USD million unless otherwise specified) | ||||||
My estimates are based on certain macroeconomic assumptions that may not come to fruition. Therefore, actual earnings can differ materially from my estimates.
Adopting a Buy Rating
Old Second Bancorp is offering a dividend yield of 1.2% at the current quarterly dividend rate of $0.05 per share. The earnings and dividend estimates suggest a payout ratio of 10.5% for 2022, which is in line with the five-year average of 8.7%. Therefore, I’m not expecting an increase in the dividend level.
I’m using the historical price-to-tangible book (“P/TB”) and price-to-earnings (“P/E”) multiples to value Old Second Bancorp. The stock has traded at an average P/TB ratio of 1.39 in the past, as shown below.
| FY18 | FY19 | FY20 | FY21 | Average | ||
| T. Book Value per Share ($) | 6.8 | 8.4 | 9.5 | 13.0 | ||
| Average Market Price ($) | 14.6 | 12.9 | 9.0 | 12.6 | ||
| Historical P/TB | 2.13x | 1.53x | 0.94x | 0.97x | 1.39x | |
| Source: Company Financials, Yahoo Finance, Author’s Estimates | ||||||
Multiplying the average P/TB multiple with the forecast tangible book value per share of $9.5 gives a target price of $13.2 for the end of 2023. This price target implies a 22.4% downside from the January 6 closing price. The following table shows the sensitivity of the target price to the P/TB ratio.
| P/TB Multiple | 1.19x | 1.29x | 1.39x | 1.49x | 1.59x |
| TBVPS – Dec 2023 ($) | 9.5 | 9.5 | 9.5 | 9.5 | 9.5 |
| Target Price ($) | 11.3 | 12.3 | 13.2 | 14.2 | 15.1 |
| Market Price ($) | 17.0 | 17.0 | 17.0 | 17.0 | 17.0 |
| Upside/(Downside) | (33.5)% | (27.9)% | (22.4)% | (16.8)% | (11.2)% |
| Source: Author’s Estimates |
The stock has traded at an average P/E ratio of around 13.0x in the past, as shown below.
| FY18 | FY19 | FY20 | FY21 | Average | ||
| Earnings per Share ($) | 1.12 | 1.30 | 0.92 | 0.65 | ||
| Average Market Price ($) | 14.6 | 12.9 | 9.0 | 12.6 | ||
| Historical P/E | 13.0x | 9.9x | 9.7x | 19.3x | 13.0x | |
| Source: Company Financials, Yahoo Finance, Author’s Estimates | ||||||
Multiplying the average P/E multiple with the forecast earnings per share of $1.90 gives a target price of $24.6 for the end of 2023. This price target implies a 44.8% upside from the January 6 closing price. The following table shows the sensitivity of the target price to the P/E ratio.
| P/E Multiple | 11.0x | 12.0x | 13.0x | 14.0x | 15.0x |
| EPS 2023 ($) | 1.90 | 1.90 | 1.90 | 1.90 | 1.90 |
| Target Price ($) | 20.8 | 22.7 | 24.6 | 26.5 | 28.4 |
| Market Price ($) | 17.0 | 17.0 | 17.0 | 17.0 | 17.0 |
| Upside/(Downside) | 22.5% | 33.6% | 44.8% | 56.0% | 67.1% |
| Source: Author’s Estimates |
Equally weighting the target prices from the two valuation methods gives a combined target price of $18.9, which implies an 11.2% upside from the current market price. Adding the forward dividend yield gives a total expected return of 12.4%. Hence, I’m adopting a buy rating on Old Second Bancorp.
Be the first to comment