

Leonid Sorokin
Intro & Thesis
According to Statista, the global identity market is projected to grow from $28 billion (2022) to almost $71 billion by 2027, representing a 5-year CAGR of 20.45%. Different research agencies come to different conclusions, but the whole picture for this particular market’s TAM is more than colorful.
Source: Author’s selection and calculations
Such rapid growth always attracts investors with low-risk aversion. Buying a promising stock here and now with the prospect of selling it many times more expensive in 10-15 years – what could be better?
In my opinion, however, we should always be careful about what exactly we buy and at what price – if we overpay today for the growth we are promised far, far into the future, we can, in the best case, earn many times less than we originally expected; or even lose everything down to the last penny.
Today I will review the prospects of Okta, Inc. (NASDAQ:OKTA) and try to answer some questions:
- What about the company’s financials?
- What is management promising and what is priced in by the market?
- How fairly is the company valued?
This framework is called “FEV” (fundamentals + expectations + valuation) – I discovered it from Brett Caughran, who has worked at the largest and most respected hedge funds (Maverick, D.E. Shaw, Citadel, Schonfeld). Here is a link to a detailed explanation of this concept if you are interested. Let’s dive in.
Business description and financials (1)
According to the latest 10-Q filing, founded in 2009, Okta is now the leading independent identity provider that enables its customers “to securely connect the right people to the right technologies and services at the right time.”
In other words, Okta helps you log in to various devices and websites with the highest possible security and protection of your data. Okta is best known for its “single sign-on” product, which allows users to access all applications with just one login, adds Julian Lin, a fellow SA contributor, in his recent article.
The company operates through 2 business segments:
- Subscription (96.4% of total sales) – fees for access to and usage of the OKTA’s cloud-based platform and related support;
- Professional services and other (3.6%) – fees from assisting customers in implementing and optimizing the use of OKTA’s products.
Judging by the weights between the segments, sales do not seem to be not differentiated – going forward, I will only look at total consolidated sales in my analysis.
In the last reporting quarter, the company recorded a 43.2% year-on-year growth in sales, which was one of the worst post-pandemic indicators. However, the number of customers with >$100K ACV (annual contract value) increased by 24.8% YoY and 6.7% QoQ, which is quite a lot. A noteworthy fact: the company is steadily increasing the percentage of large customers in revenue and RPO (remaining performance obligations = deferred revenue + backlog), which in theory should increase or at least maintain net dollar retention rates. This is exactly what happens in reality – large customers are reluctant to turn away services from companies that account for only a small portion of their operating costs (assuming the performing companies do their jobs diligently).
OKTA’s IR materials, author’s calculations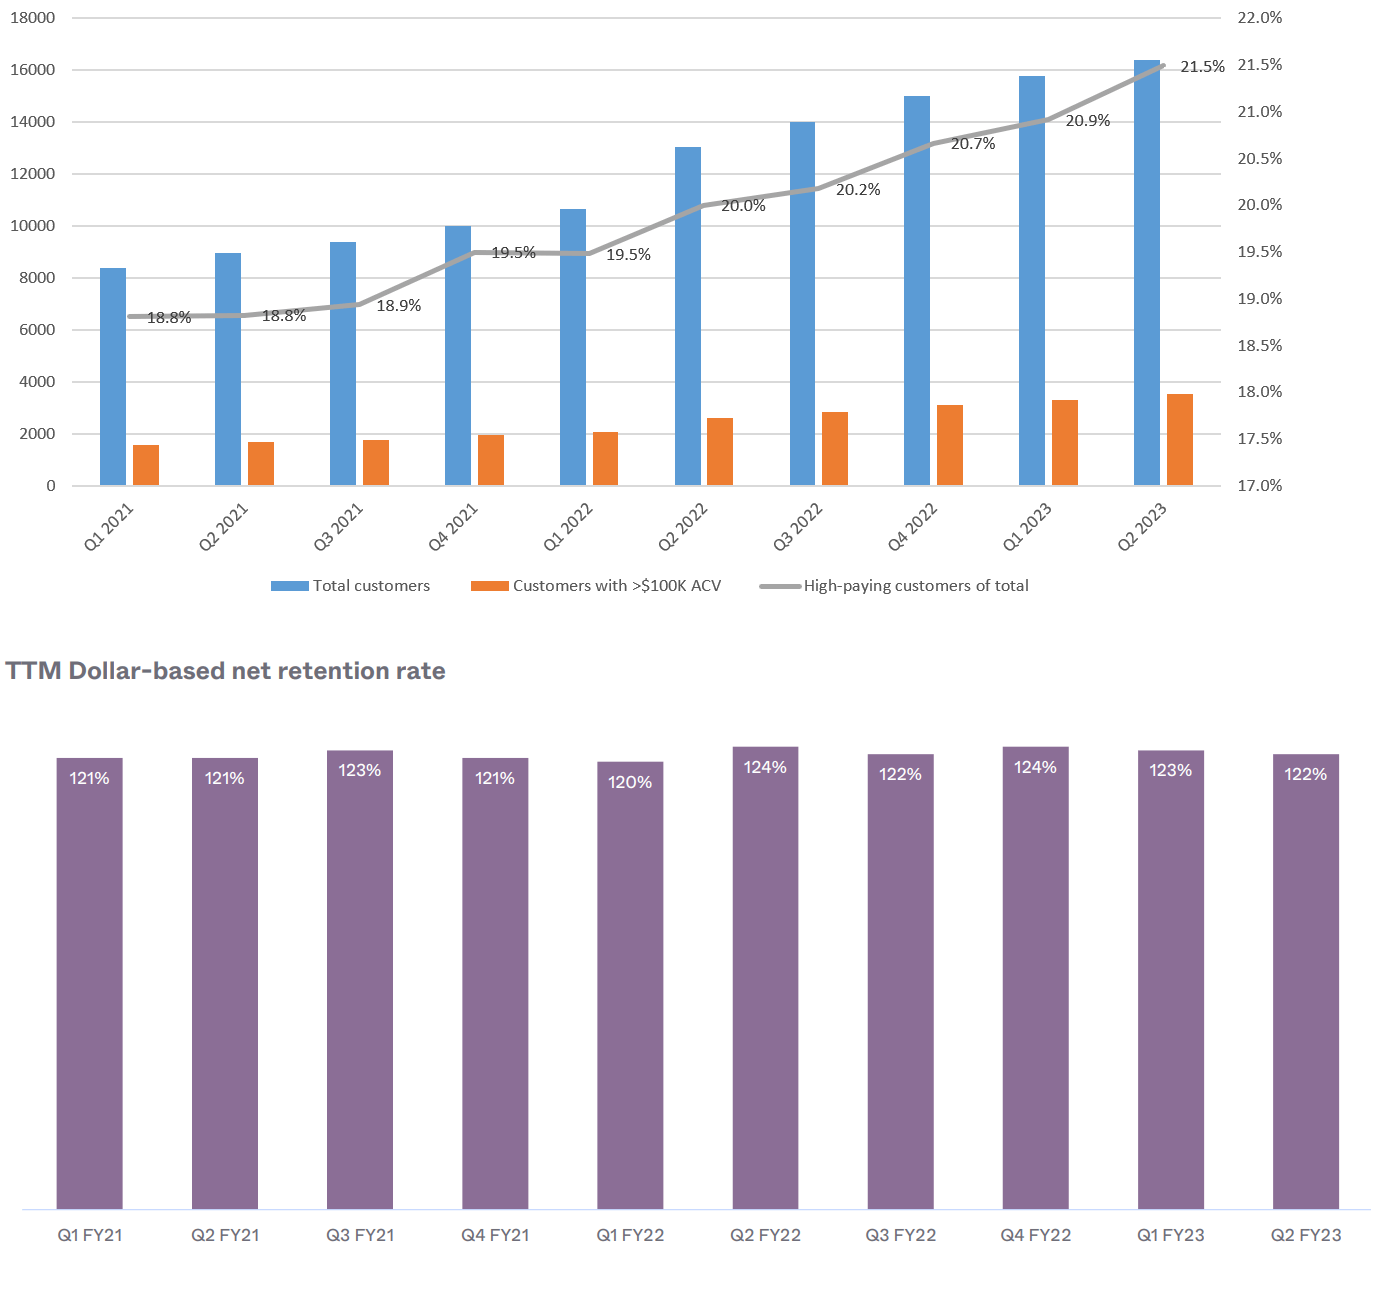
OKTA seems to do its job well, given the conclusions that follow from my discussion above.
Despite this success, however, the company’s GAAP operating loss continues to rise while revenue grows. At the same time, non-GAAP EBIT behaves quite volatile, and it is this metric that management undertakes to predict in its presentations.
Author’s calculations, based on OKTA’s IR materials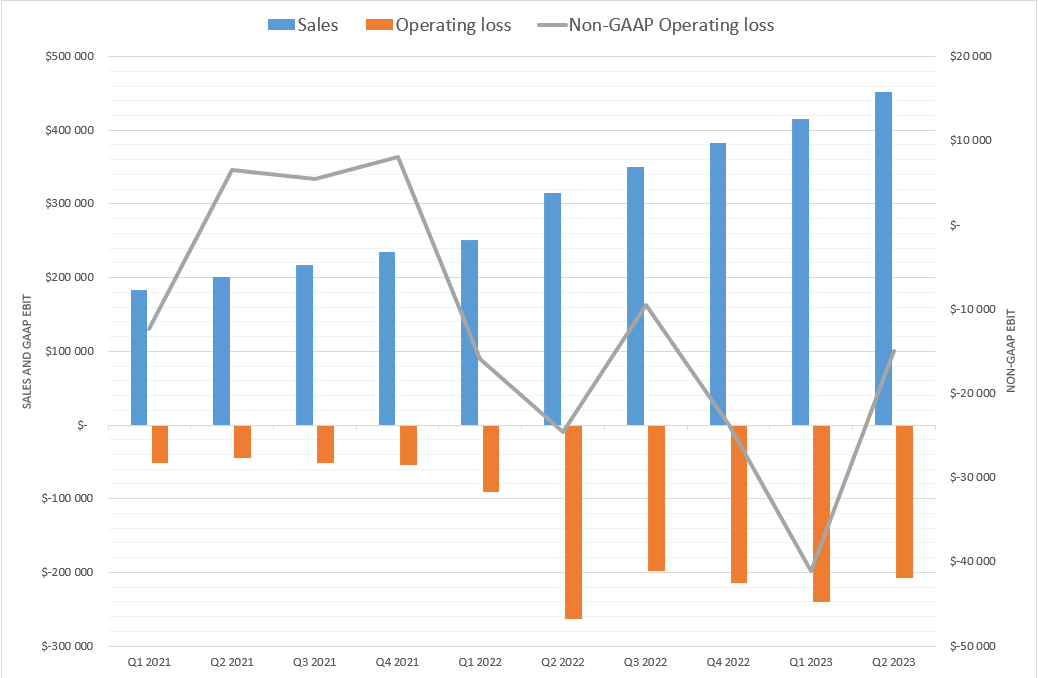
Where does the big difference between GAAP EBIT and Non-GAAP EBIT come from? Blame stock-based compensation expense (inside OPEX), which accounts for 37.9% of total sales:
OKTA’s 10-Q (2Q FY2023)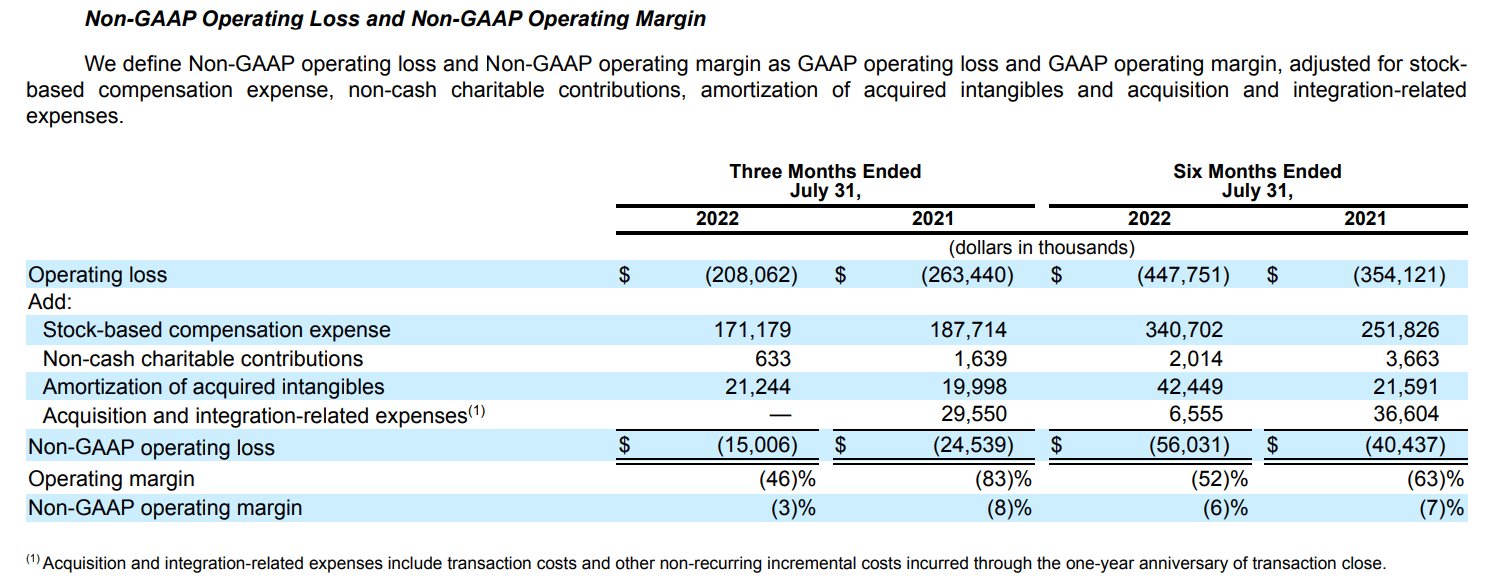
The company is definitely making significant progress towards “true” profitability (excluding SBC) – the operating loss was reduced by more than 20% or $55.4 million, resulting in a reduction of negative EBIT margin by almost two times in just one year.
But even with SBC’s adjustments, OKTA continues to burn a lot of cash quarter after quarter. What confuses me the most is the dynamics in the working capital structure – for the six months ended on July 31, 2022 (1H FY2023) accounts receivable are down $74 million and deferred revenue is up $15 million (last year this increase was 10.5 times more).
OKTA’s 10-Q (Q2 FY2023), author’s notes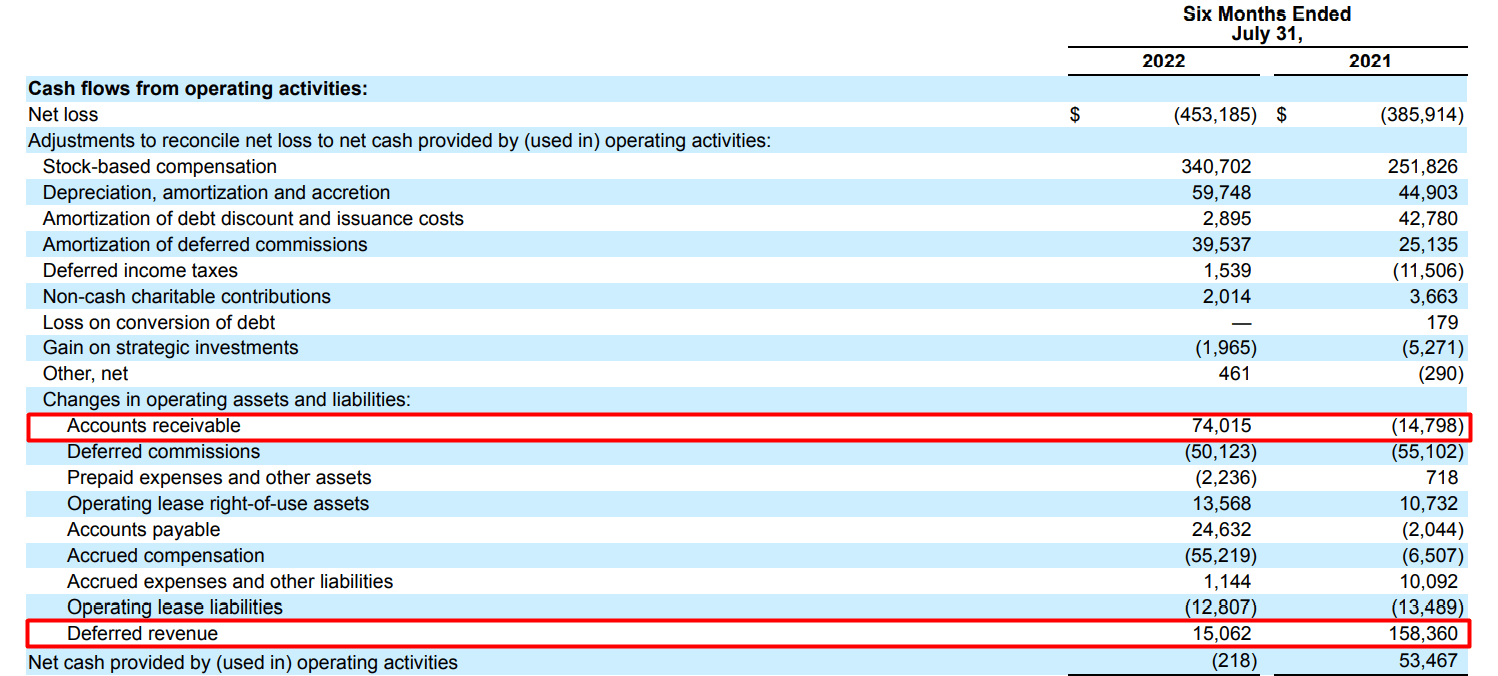
The increase in deferred revenue speaks to the growth of future factual revenue, and apparently, the growth of new OKTA’s customers has slowed last reporting quarter.
Since the IPO in mid-2017, the company has systematically turned to debt – the long-term debt on the balance sheet stands at $2,195 million (28% of market capitalization) in Q2 FY2023. At the same time, the share capital is also growing – since the beginning of the fiscal year, the weighted average number of shares outstanding has increased by 1.73%.
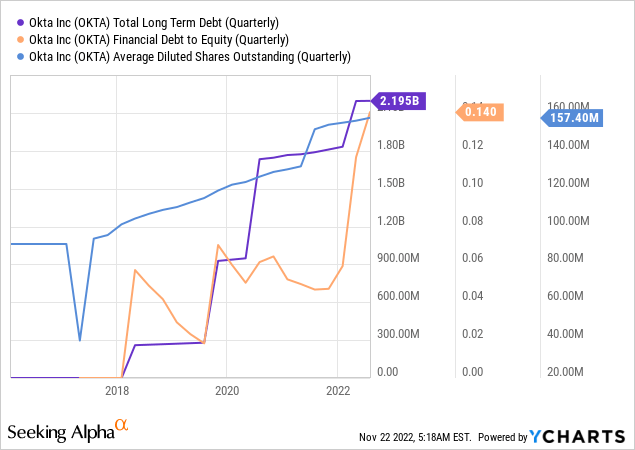
Debt does not contribute much to overall risks, but combined with continued equity capital dilution, the risks to the company might increase significantly in the medium term if new financing is required.
From the foregoing, I conclude for myself that OKTA is not a standout among other SaaS peers.
Expectations (2)
At the Goldman Sachs Communacopia Conference [September 12, 2022], Todd McKinnon, CEO of Okta, presented the following key figures for Q3 FY2023 and full-year 2023:
OKTA’s outlook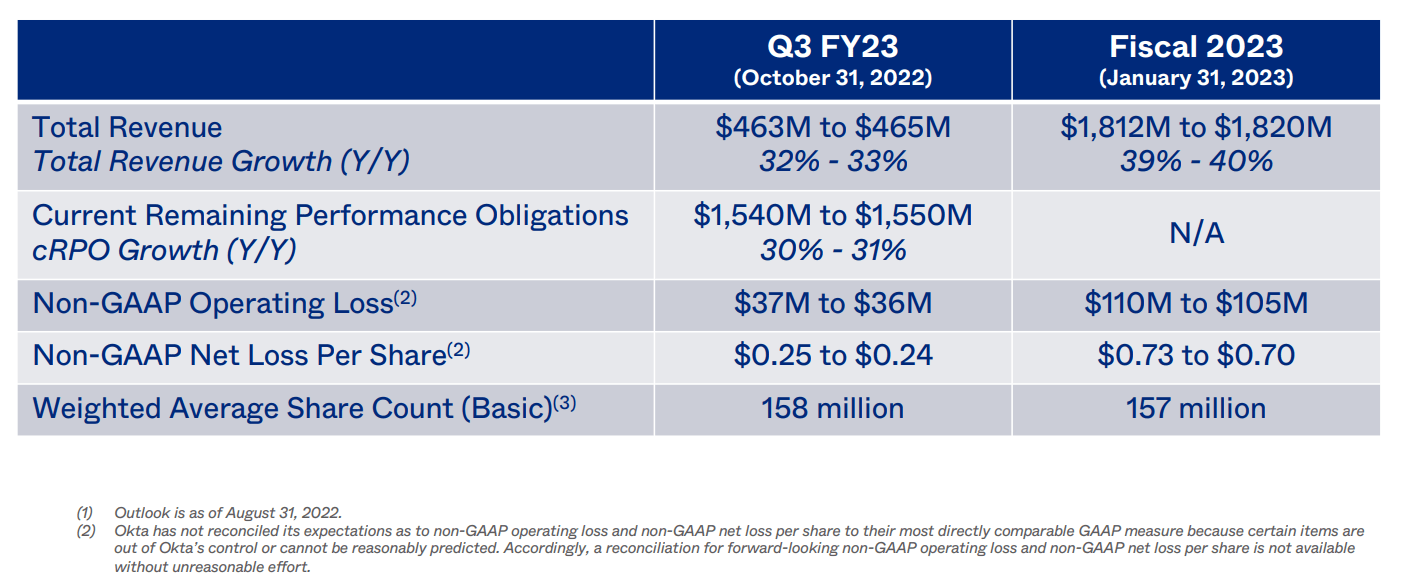
I put these numbers into an Excel file to see how they compare to historical trends. According to management’s forecasts, sales growth is expected to slow further by the end of this fiscal year (both YoY and QoQ):
Author’s calculations, based on OKTA’s IR materials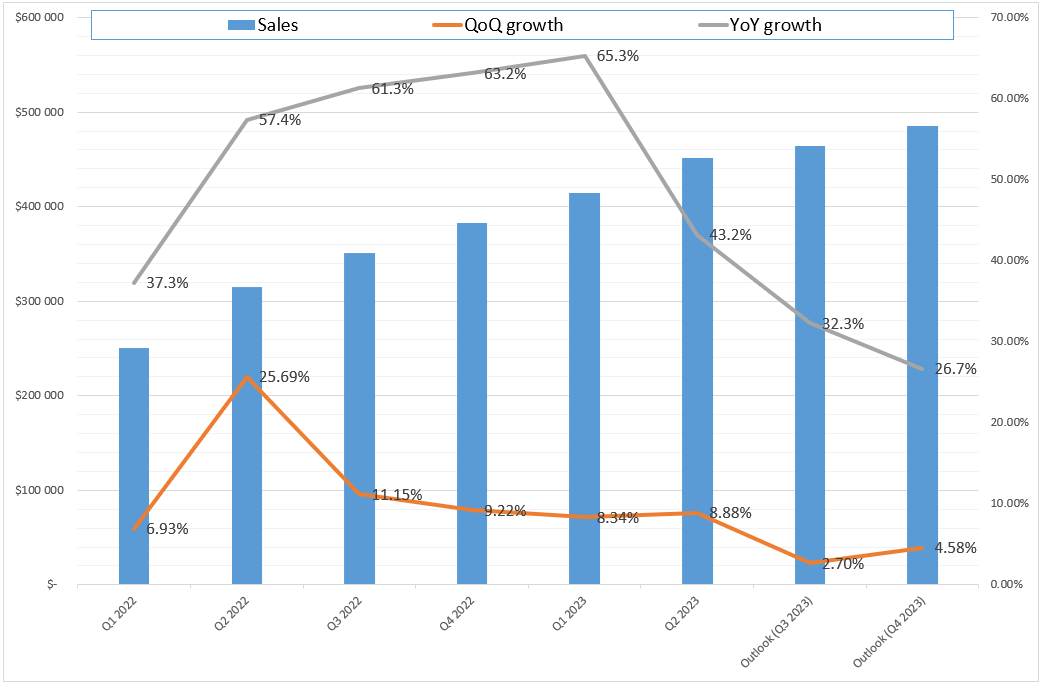
At the same time, the Company will continue to be unprofitable even after taking into account all non-GAAP adjustments:
Author’s calculations, based on OKTA’s IR materials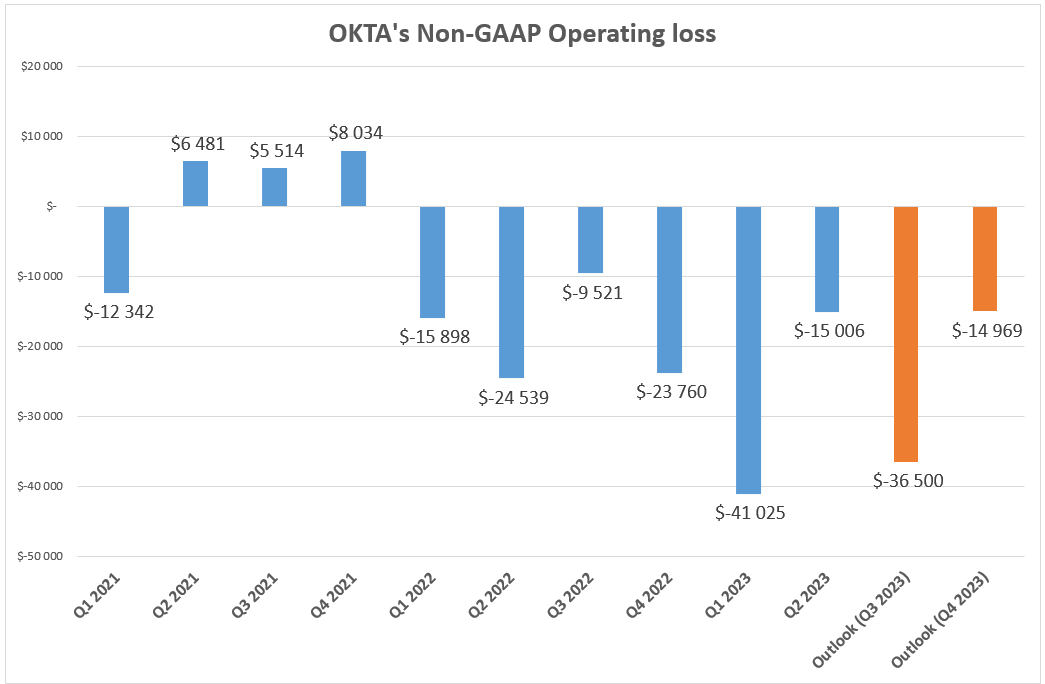
32 analysts forecast a non-GAAP accounting loss per share of $0.24 for Q3 FY2023, which is EBIT excluding interest and taxes. However, if you divide the projected -$36.5 million (mid-range) of non-GAAP EBIT by the projected weighted number of shares outstanding, you’ll get -$0.231 per share – there is minimal room for OKTA to beat its EPS expectations in Q3 FY2023 as far as I see it.
Now we are talking about the short term – the company will report quarterly earnings in 8 days according to Seeking Alpha. However, as we saw in the financial analysis from the first part of our “FEV-equation” (the above part), there is a risk that OKTA is already losing customer growth based on its deferred revenue dynamics – if that is true, then we will most likely see no breakeven point in calendar 2023-24. However, that is exactly what the analysts are now assuming in their models:
Seeking Alpha, author’s notes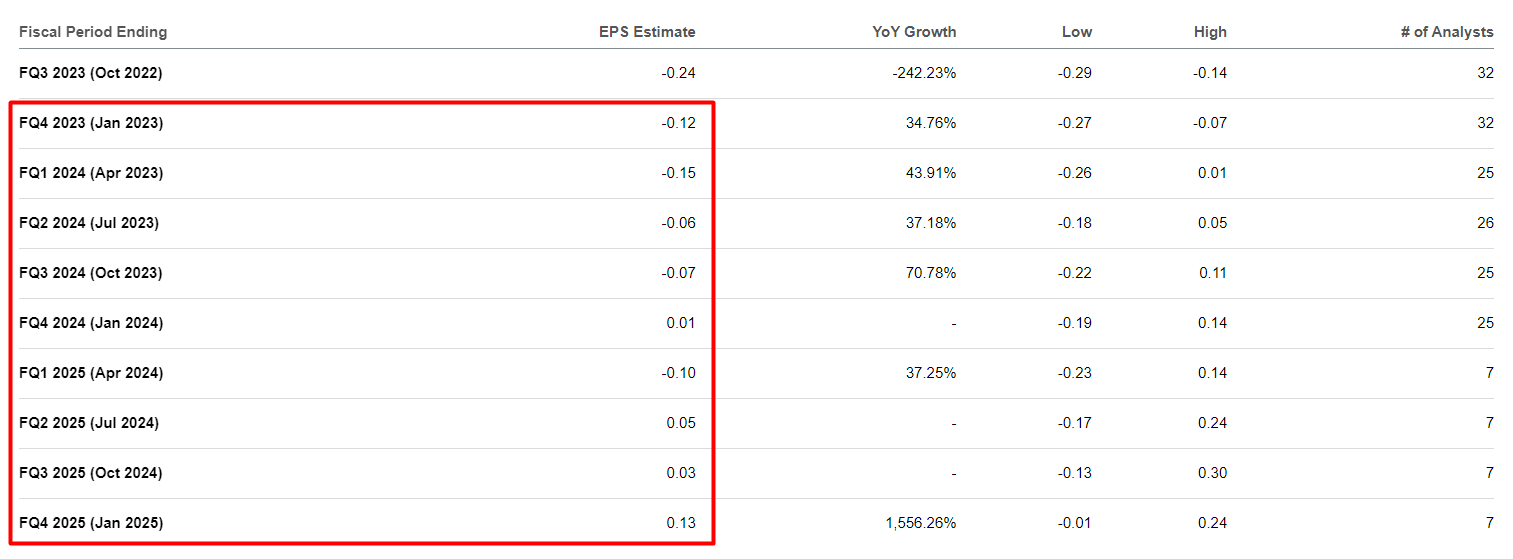
I think that because the CEO announced the outlook a long time ago (mid-September), the risks of downward earnings revisions have increased since then – here is an interesting infographic that Mr. Blonde published in late October 2022:
Mr. Blonde’s newsletter, October 30, 2022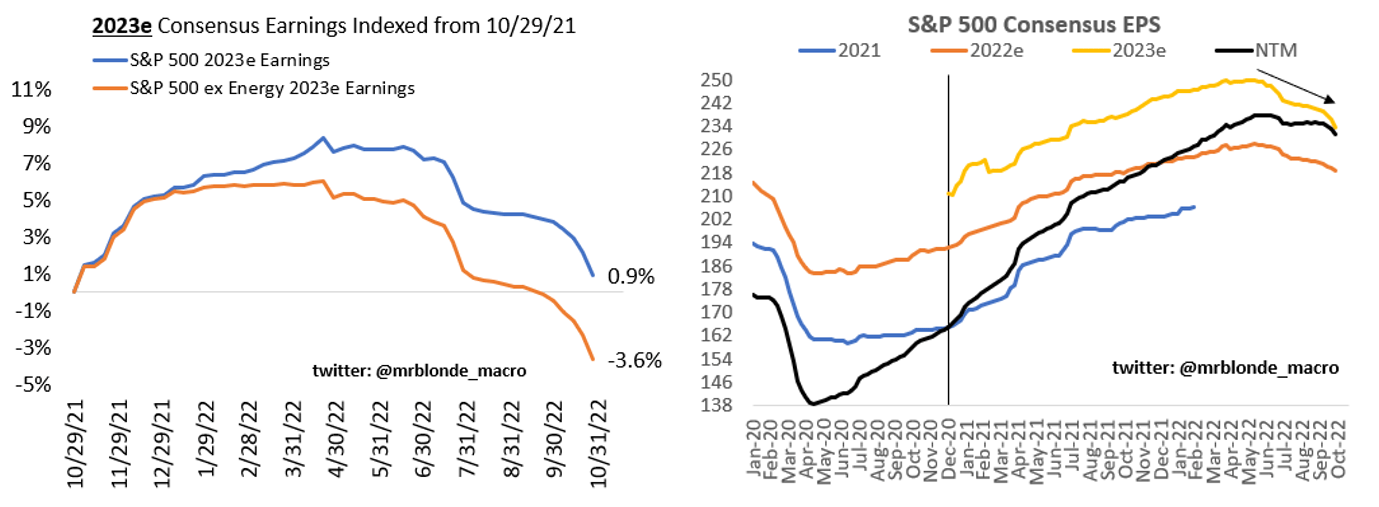
As a result, management will most likely revise its Q4 FY2023 outlook and possibly provide more pessimistic guidance for FY2024 – this will serve as a headwind for the stock as analysts managed to revise some of their estimates upward over the past 3 months:
Seeking Alpha, author’s notes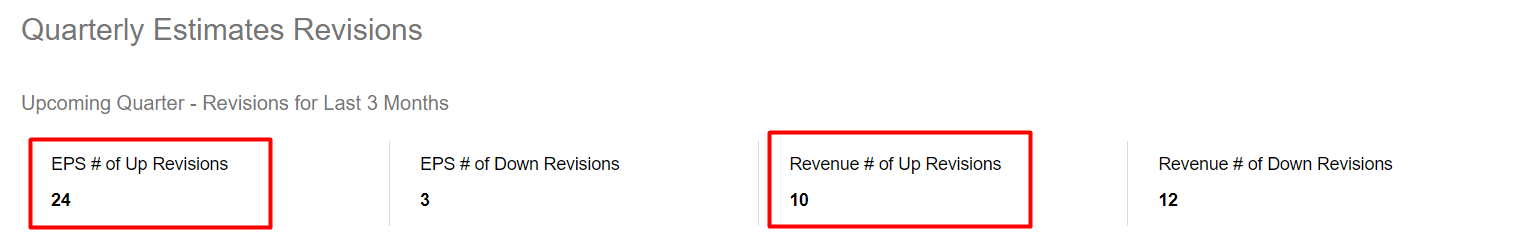
So as far as “expectations” are concerned, OKTA is also rather unreliable in my opinion.
Valuation (3)
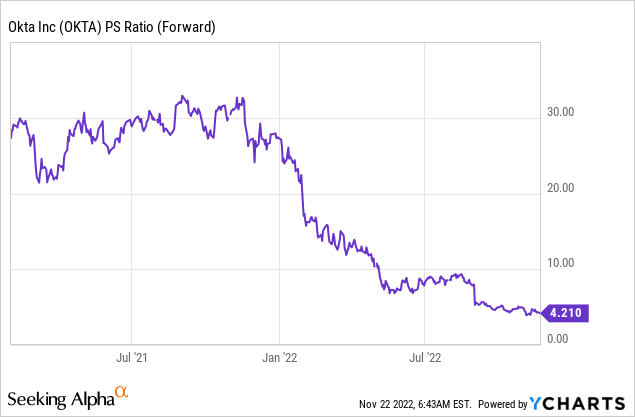
Many bulls believe OKTA is trading cheap at its forwarding price-to-sales ratio of 4.2x – down from 25-30x earlier this year:
However, at the level of EV/EBITDA multiples OKTA it is still impossible to estimate due to deep unprofitability:
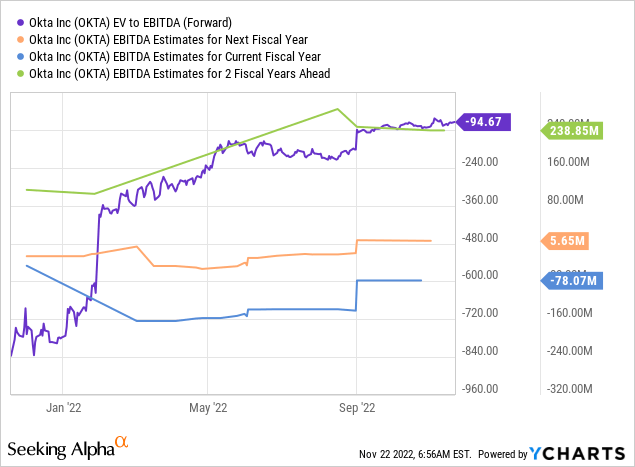
As the company faces slowing growth, it is becoming increasingly difficult to justify valuation multiples – past hopes continue to be just hopes. OKTA cannot be called cheap when analysts do not see the first positive EBITDA until calendar 2023 – and as we found out in the second part of the FEV-equation, the information priced in today has every chance of being revised not in the company’s favor soon.
Bottom Line = (1) + (2) + (3)
If we put all the pieces of the puzzle together, the outlook for OKTA looks pretty bleak today. Financials look weak if we disregard the unit economic metrics, expectations are still too high, as are the valuation multiples.
All in all, we get a rather risky company with slowing growth rates and growing risks of continued shareholders’ capital dilution.
In my opinion, the fair price of the stock will be significantly below today’s levels. I can’t say today where exactly – we will wait for the first actual positive EBITDA figures (if any) to try to answer this question. Therefore, I do not recommend buying the shares of OKTA at the current level.
Be the first to comment