

Ranimiro Lotufo Neto/iStock via Getty Images
Investment thesis
Oil States International, Inc. (NYSE:OIS) is a small-cap oilfield services (or OFS) company which has been underperforming its peer sector:
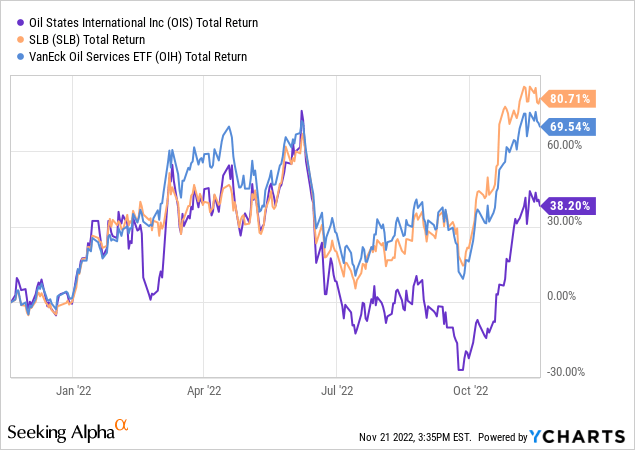
The current price still offers a good opportunity to get OFS exposure, in particular to the offshore segment, which accounts for a majority of Oil States’ EBITDA. Oil States should have more runway than mega companies such as Schlumberger (SLB), which already have appreciated a lot. In past bull cycles, OIS also trailed behind Schlumberger and the bigger names. This isn’t surprising, because Oil States also supplies other OFS providers and, therefore, stands further away in the supply chain from the E&P capex. OFS companies that sell directly to E&P need to ramp up first, before the increased activity pulls demand for OIS’ products.
Nonetheless, in the prior bull cycle until 2014, OIS ended up ultimately outperforming Schlumberger, despite peaking later:
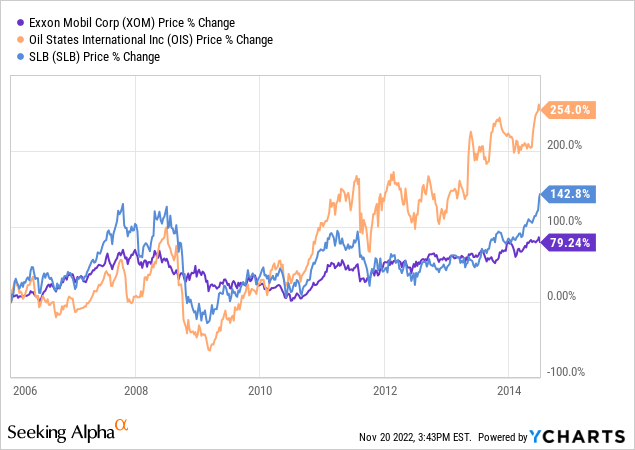
As the capex cycle develops over the next few years, we may see a repeat of this scenario. Frequently, the marginal supplier whose capacity is activated last would benefit from the best pricing. Although I am still bullish on SLB, if you missed its 80% return so far this year, you may also want to take a look at the next wave of smaller OFS plays, to which OIS belongs.
On the risk side, Oil States has modest financial leverage and adequate coverage of its interest expense. This means there is little urgency for the company if revenue improvements are delayed by one or more quarters. Bankruptcy is not on the table even if 2022 results remain flat. This makes OIS fit the optionality profile, with little downside and the opportunity for sizable gains, all against the backdrop of a favorable industry trend.
The bull thesis for OFS
I have outlined my oilfield services thesis before, so this section can also be seen as update to my prior writings:
Schlumberger: Even If OPEC+ Fills The Supply Gap, SLB Still Wins.
Oilfield Services: Still Discounted The Energy Despite Rally.
The key points are that OFS is highly cyclical, like the entire oil industry, but services also peak later in the cycle. This has to do with the long lags from E&P capex budgeting decisions to project execution. Moreover, coming off the 2020 lows, we had not quite yet seen the improved oil prices translate into the same drilling activity as before, as shown in the chart from the American Petroleum Institute:
API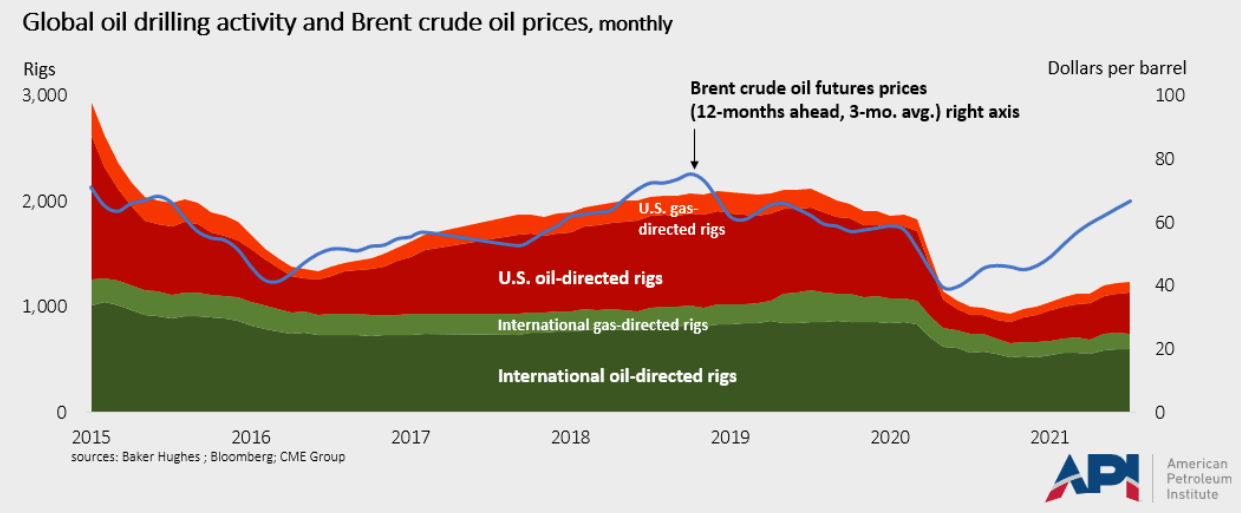
This disconnect has been explained by the new “capital discipline” philosophy, as E&P companies have prioritized returning cash to investors instead of investing in resources that may end up stranded due to the energy transition. ESG pressures have also prevented companies from expanding production.
However, much has changed in 2022 with the Russia-Ukraine war, and energy security has started displacing the ESG narrative, particularly so in Europe:
Offshore Engineer
Probably not all companies in the industry will ramp up production. In particular, U.S. shale, which has been closely watched as the pivotal global producer since 2014, may be starting to find it unprofitable to increase its activity. The EIA, for example, has been revising downward its U.S. shale production forecast for 2023. According to the linked article:
[Inflation] and supply-chain delays from the second quarter onwards have materially worsened the outlook on U.S. crude oil production growth. Enverus Intelligence Research cut this month its forecast for U.S. production growth, due to “the headwinds created by oilfield services limitations, the risk of recession and reduced performance from wells drilled recently in the Permian Basin.”
To paraphrase Alice in Wonderland, U.S. shale may soon have to run as fast as it can, just to stay in place. Of course, there will be much differentiation among different basins or the acreage quality of particular E&P companies, but, as an aggregate, it looks as though that is where things are heading. If the Enverus assessment is correct, this may not necessarily be bearish for shale-focused OFS providers, though, as maintaining production “flat” would require more of their services.
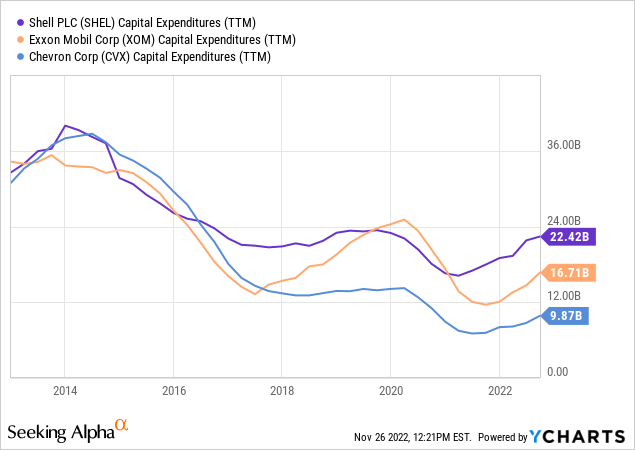
Beyond U.S. shale, though, there are already signs that upstream activity is picking up. Looking at some of the Majors such as Shell (SHEL), Exxon (XOM) and Chevron (CVX), capex may have already bottomed in 2021:
National Oil Companies (or NOCs), have also announced capex increases. For example, Saudi Aramco (ARMCO):
CEO Amin Nasser said while crude prices were weighed down by economic uncertainties in the period, the company believes demand will continue to grow for the rest of the decade. Nasser also said Aramco would be an exception to the “global underinvestment in our sector” as it continues to raise production of oil and natural gas.
Abu Dhabi’s national oil company, ADNOC, has also announced significant capex for the next few years.
While Aramco and ADNOC aren’t indicative of deepwater investment, significant growth capex is also expected from Petrobras (PBR). During its Q3 presentation, PBR highlighted its production development plans and the pipeline of incoming FPSOs (floating production storage and offloading units):
Petrobras Q3 Presentation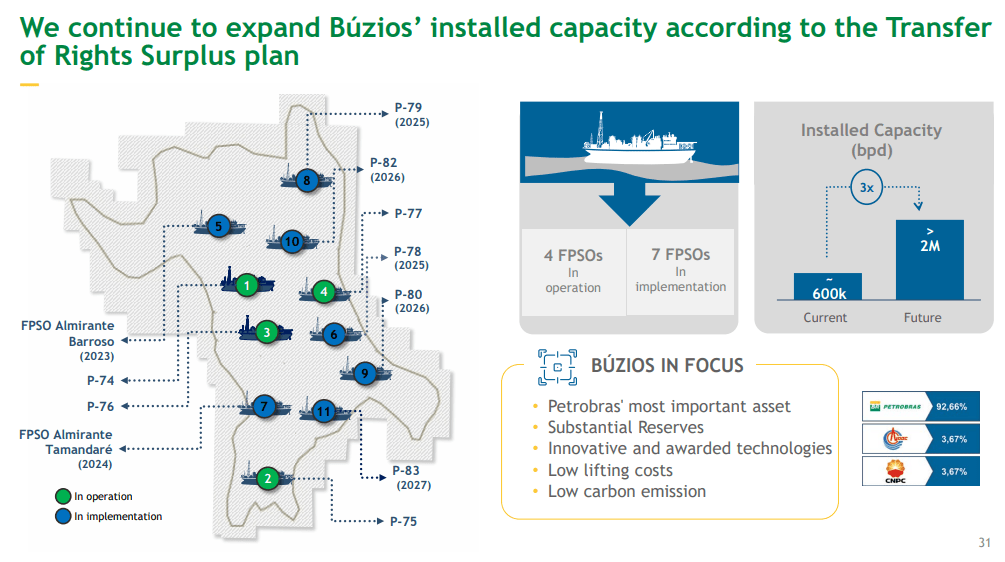
Even if U.S. shale continues to show “restraint,” NOCs and Majors aren’t necessarily on the same page and are starting to focus again on their long-term production plans. Heading into the end of 2022, we are already hearing from multiple sources that this E&P capex “pull” is exerting a tangible effect on OFS revenues. Take, for example, some recent remarks from oilfield services bellwether Schlumberger, the largest company in the sector. CEO Olivier Le Peuch during the Q3 earnings call:
[Year-on-year] revenue growth accelerated to 28%, the highest growth rate since 2011, more than a decade ago. Internationally, all areas grew and the pace of growth increased to 13% sequentially and 26% year-over-year. Activity and revenue trends confirm the onset of another phase in the global growth cycle, one that will be increasingly driven by the international and the offshore markets…
We expect investment growth will be durable, reinforced by the long-term demand trajectory, multi-year capacity expansion plans, lower operating breakeven prices and supportive commodity prices. Growth will be simultaneous in North America and in the international markets. This started first in the North America market and we are already witnessing the next phase of growth with an acceleration in pace, in the offshore and international markets that was very visible in the third quarter…
The international markets will be driven by a sequential uptick in the Middle East activity as capacity expansion projects begin to mobilize. Global Offshore activity will continue to strengthen, offset by the approaching seasonality in the Northern Hemisphere, while North American land activity is expected to moderate its growth trend…
[We] are very constructive into the deepwater market going forward. The recent pipeline of FID (final investment decision) that has been blessed in recent months, the pipeline that is set in 2023 according to WoodMac is at $170 billion of FID that will be the highest in the last 10 years since 2011. And the mobilization of projects across the different deepwater basins continues.
In summary, Schlumberger sees a multi-year growth cycle, led by international markets and offshore. Schumberger’s expectation for some moderation in North America land activity agrees with the U.S. shale considerations already discussed.
Let’s take a look too at Halliburton (HAL), the other big player in the industry. CEO Jeff Miller during the Q3 earnings call:
Looking forward, I see activity increasing around the world, from the smallest to the largest countries and producers. I expect the areas of strongest growth will be the Middle East, led by Saudi Arabia, but with meaningful activity increases in the UAE, Qatar, Iraq and Kuwait. Elsewhere, Brazil, Guyana and many others have also signaled a commitment to increased activity.
Halliburton’s portfolio is more tilted to North America land compared to Schlumberger, so the perspective on U.S. shale may differ, but both industry leaders seem to agree on the strong prospects for offshore.
Beyond the services companies, we can also seek confirmation from the engineering companies that will actually deliver these incremental FPSOs. One major player in this space is SBM Offshore N.V. (OTCPK:SBFFF), which commented during its Q2 earnings:
We saw steady growth with the award of FPSO ONE GUYANA, which brings our backlog to another record level, now above $31 billion…
The market outlook in our traditional FPSO business is very positive with 33 potential awards until 2025. This outlook improved compared to the previous years. As the world’s oil demand has significantly recovered, while the supply side is witnessing the effect from underinvestment during the past decade.
SBM Offshore sees a steady pipeline of FPSO orders at 9 per year, compared to only 3 back in 2020:
SBM Offshore Presentation
Paradoxically, offshore wind, while competing against fossil fuels, is still positive for companies like SBM Offshore because the offshore installation expertise overlaps. This is also of relevance to Oil States too, as it also has exposure to offshore wind.
The macro takeaway
So to recap so far, despite the flat outlook for U.S. shale, international and offshore capex is making a comeback. The renewed emphasis on energy security seems to have removed some regulatory roadblocks for new fossil fuel investments, but governments aren’t yet giving up on alternative energy either. The offshore services industry may greatly benefit from the dual demand pull from both deepwater oil as well as offshore wind.
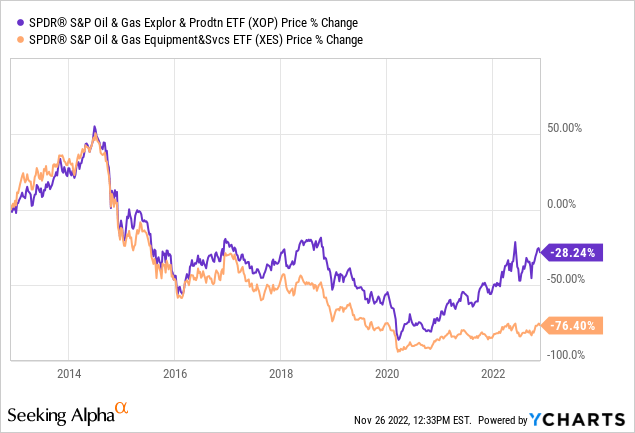
OFS stock prices are still way behind E&P when it comes to the recovery from the 2020 COVID lows, so the valuation proposition is still here:
In prior bull cycles, services also peaked after E&P, but this time around the snapback may be even more pronounced because much of the OFS supply capacity was effectively destroyed during 2014-2020, either due to shutdowns or skilled workforce permanently leaving the industry. Take for example, Weatherford’s (WFRD) bankruptcy woes; the once-No. 4 services company went from 67,000 employees in 2014 down to 26,500 by 2019. The companies that survived the downturn, however, will benefit greatly from the supply-demand imbalance.
Why Oil States?
While a small-cap company, Oil States is a truly global provider of manufactured products and services for the drilling, completion, subsea, production and infrastructure sectors of the oil and gas industry, with additional sales to industrial and military clients. Oil States is headquartered in Houston, but, outside of the U.S., it also has facilities in the UK, Brazil, Singapore and other countries.
The company operates in three segments:
Oil States Investor Presentation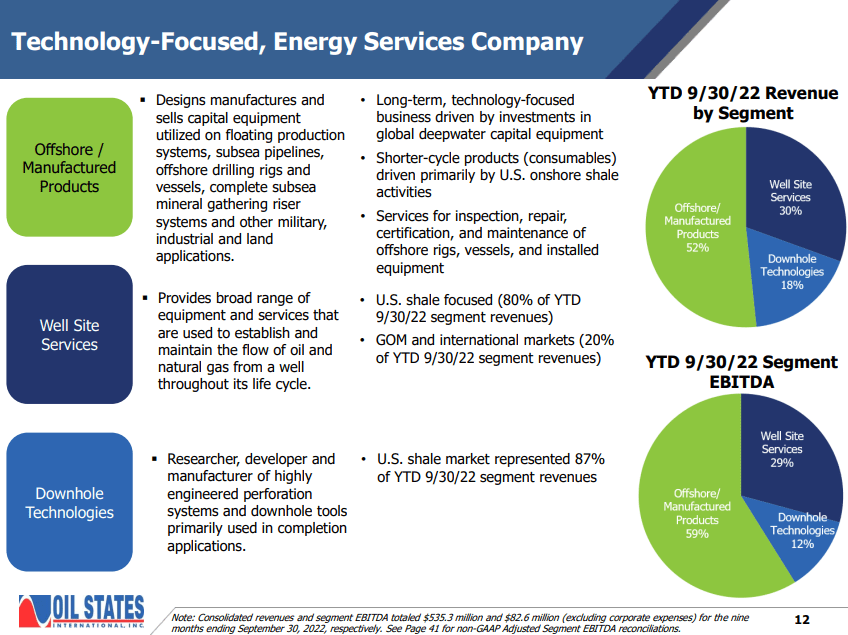
The offshore / manufactured products segment is the largest and accounts for 52% of revenue and 59% of EBITDA. While the segment provides some short-cycle products to onshore plays, the primary drivers are investments in deepwater capital equipment, such as FPSOs, offshore rigs or various subsea installations. Hence, OIS offers good exposure to deepwater OFS.
The well-site services is smaller segment that serves U.S. shale (80% of the segment revenue) and the Gulf of Mexico and international markets (20% of revenue). The downhole technologies segment derives 87% of its revenue from the U.S. shale market. While these two smaller segments aren’t as linked to offshore, they should generate steady returns, assuming shale activity remains flat.
Oil States has a broad customer base and doesn’t only market to end-users such as E&P companies. Its customers also include engineering and design companies (for example, companies that execute FPSO projects), prime contractors, and sometimes Oil States’ direct competitors through outsourcing arrangements. This is why, Oil States is perhaps one step further back in the supply chain and offshore capex may take longer to trickle down to its topline. An E&P company has to budget for capex and award a FPSO to an engineering company; only after the engineering company starts to plan and execute on the FPSO will demand pull be created for the components supplied by Oil States.
Historically, FPSOs have correlated well to Oil States’ EBITDA margin with some lag:
Rystad; Offshore Magazine; Seeking Alpha; Author’s calculations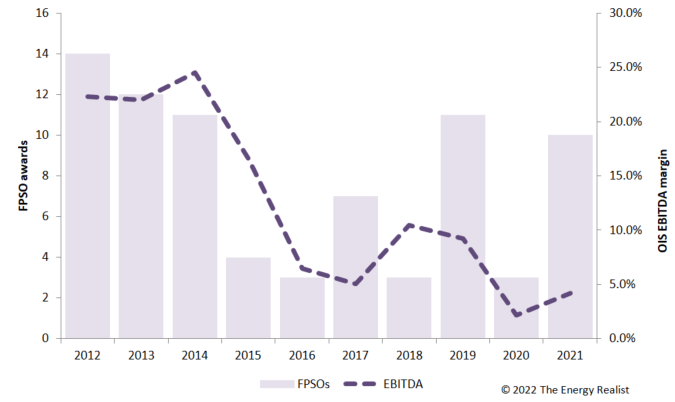
The EBITDA is adjusted for the 2014 spin of the legacy accommodation business, now known as Civeo Corporation (CVEO). Oil States’ EBITDA is also related to the global offshore rig count:
Baker Hughes; Seeking Alpha; Author’s calculations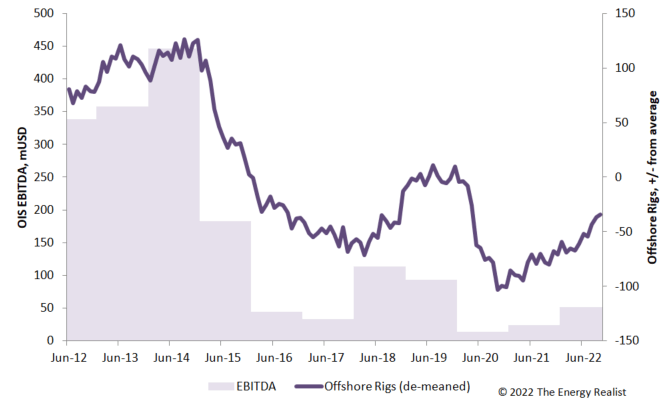
That is why, it is encouraging that FPSO orders are on the rise again, with increases expected at least through 2026:
Oil States Investor Presentation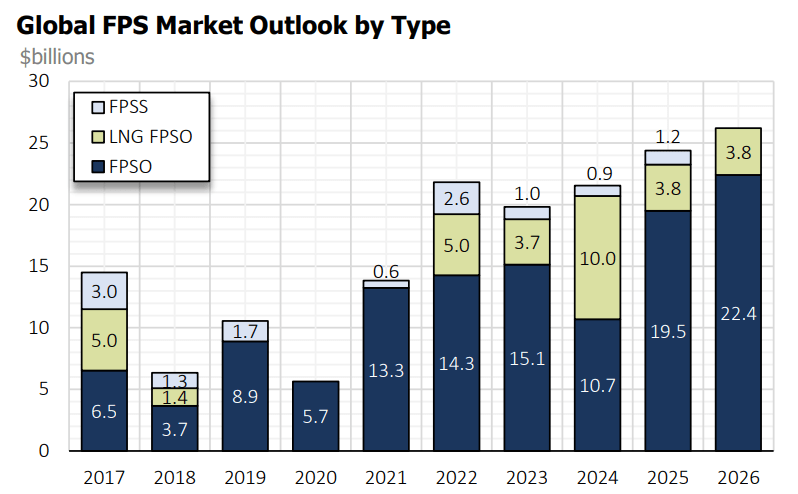
According to OIS’ presentation, Q3 saw $5.7 billion in orders for three FPS (floating production system) units, including two newbuilds from Petrobras. Oil States expects six FPS awards to come in Q4 2022, with total estimated value of $8.7 billion, from Brazil, Angola, Norway and offshore Canada.
The FPS award value over the 2023-26 period is forecast to average $23 billion per year. Of this amount, 46% is driven by projects in Latin America, 14% from North America and 11% from projects in Australasia.
Looking next at offshore rigs, there has also been a rebound since 2020:
Baker Hughes; Author’s calculations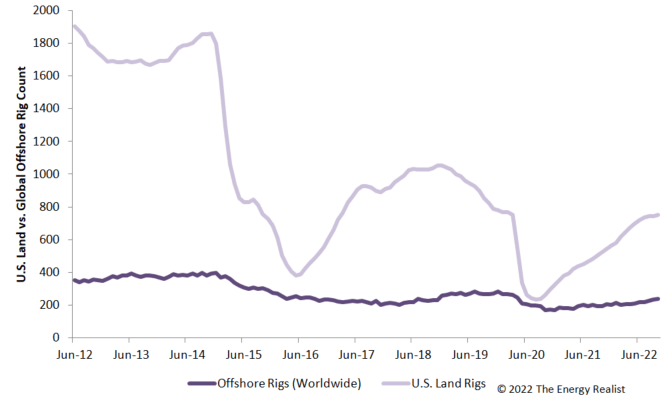
However, offshore rigs globally have been much more stable than U.S. land rigs, which makes sense as short-cycle shale investment has been more volatile all along.
Pivoting to Oil State’s onshore service offerings, the plateauing of U.S. land rigs in the last few months isn’t necessarily bad news. Speaking of its smaller Downhole Technologies segment, which caters 87% to shale, Oil States points out that shale well lateral lengths are getting longer:
Oil States Investor Presentation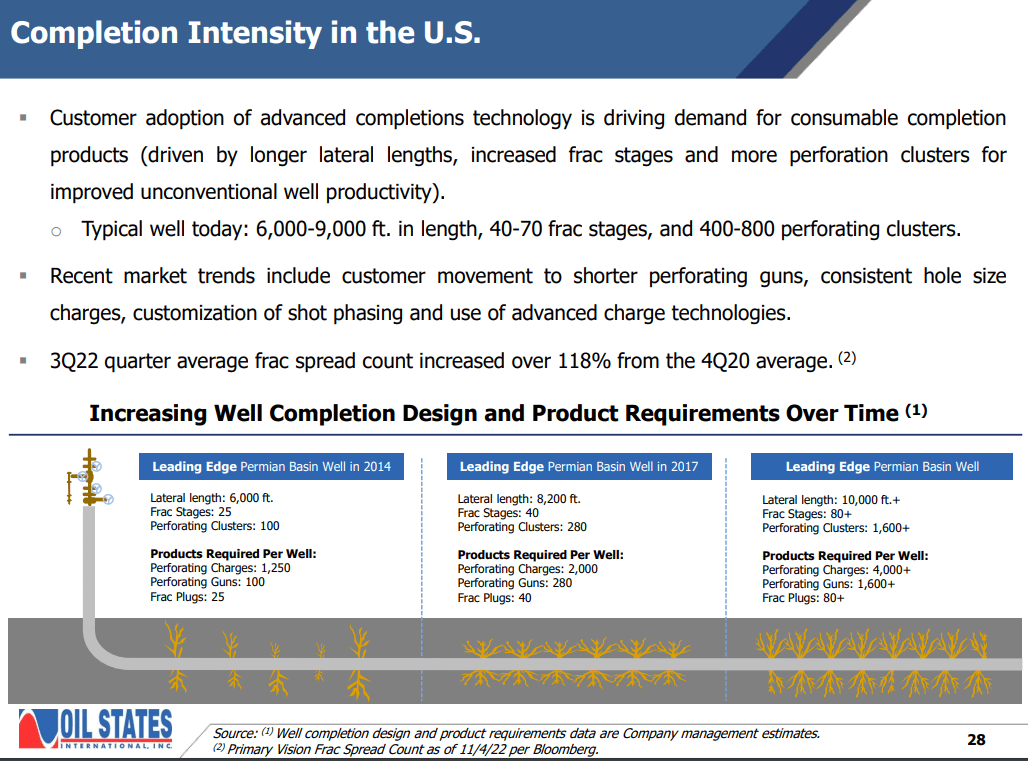
Many upstream shale presentations also emphasize longer lateral lengths as a positive factor as it implies more production with the same rig count. However, at the same time this means greater completion intensity and costs, which isn’t a positive for the operators. For Oil States, however, this is good news because the longer lateral lengths mean more demand for the completion consumable products that OIS sells.
Lastly, when evaluating the OIS business case, it is important to point out that the company also has an offshore wind offering:
Oil States Investor Presentation
My personal view is that globally offshore wind has been a disappointment (too much ESG hype but little tangible contribution to energy demand), and I have argued that wind operators will also suffer from rising installation costs:
Ørsted A/S: The Headwinds May Persist (OTCMKTS:DNNGY).
However, a number of offshore wind projects are in the pipeline, and that won’t change any time soon. Operators may struggle with their capex budgets, but Oil States is on the good side of this problem as it will receive better pricing for the components it supplies. With many asset managers still holding onto their ESG investment mandates, the offshore wind offering of Oil States may also render it more suitable for some of these generalist investors in the future.
The micro takeaway
So to recap here, Oil States is well positioned to benefit from the resurgence in offshore capex. Most of the company’s profit is tied to deepwater projects and the pipeline is very strong. Further, as U.S. shale costs rise, the smaller shale-focused offerings of OIS should also do well. Finally, the company also has some exposure to offshore wind, which justified or not, is still on the rise.
Valuation considerations
Valuing OIS isn’t easy because most of the positive market developments I have discussed are a few quarters away, so they aren’t really captured in analysts’ estimates. However, as a start, let’s look at OIS’s revenue and EBITDA. Revenue has bottomed already:
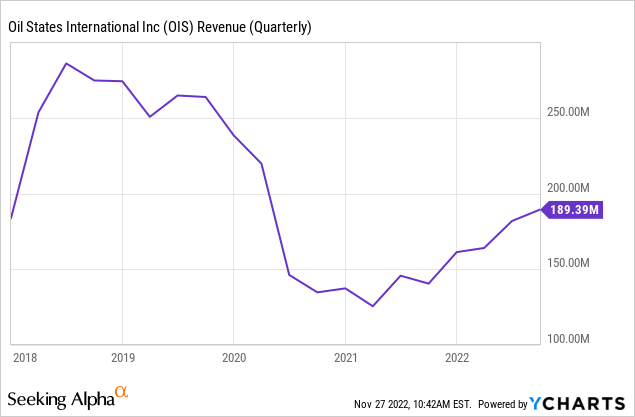
I expect quarterly revenue to return soon to the 2018-2019 run rate of $250 million, or about $1 billion per year. By the way, this would still be peanuts compared to Oil States’ sales back in 2014.
EBITDA has also climbed out of a big hole:
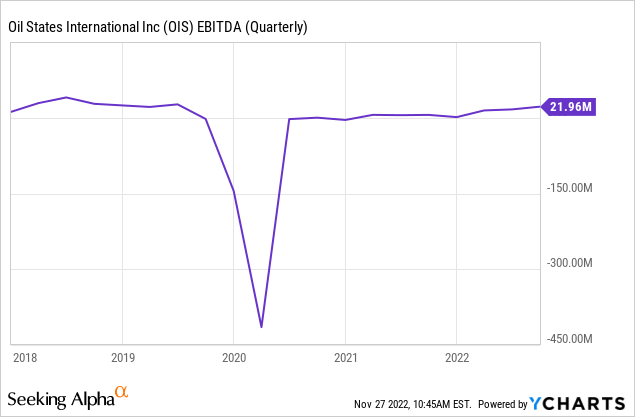
Currently, EBITDA margins are about 10%-11%, which would imply $100 million per year EBITDA run rate. However, Oil States, just like OFS in general, has high operating leverage. Based on my calculation for the 2012-2022 period, a percentage point of revenue increase translates into 2% of EBITDA increase.
If we get 30%-40% increase in the revenue run rate, the EBITDA margin should rise to 15%, which would still be short of the 20% margins seen before 2014. So, as a nearer-term objective, I see $1 billion annual revenue / $150 million EBITDA as attainable.
Based on a peer group including Technip (FTI), NOV Inc. (NOV), Oceaneering (OII), Baker Hughes (BKR) and SLB, I would argue a 10x enterprise value (or EV) / EBITDA valuation is not unreasonable:
Seeking Alpha; Author’s calculations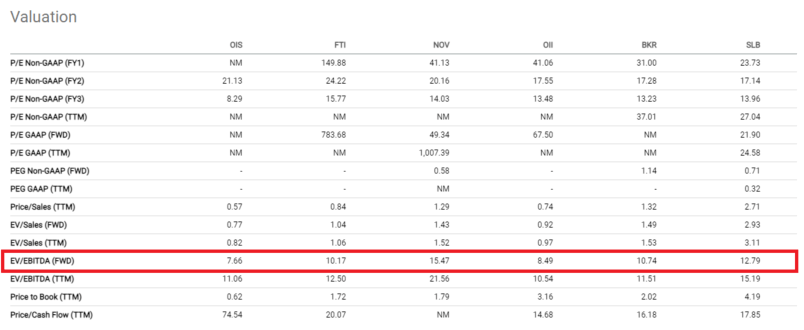
My eventual target for OIS is, therefore, $1.5 billion of EV. This would translate into about $14 per share, a significant upside from where the stock trades now.
To put these numbers into perspective, OIS traded around $14 – $18 per share in 2019, and back in 2018 it was in the $30s. The share count has been quite steady since 2018 too, so this isn’t just an effect from dilution. Back in 2014, OIS was of course above $60.
The average Wall Street price target for Oil States International, Inc. is $9, consistent with the highs in June 2022, and the high target is $11.
Risks
The risk to consider here is obviously a downturn in oil prices. With rising expectations for a 2023 recession in the U.S. (arguably Europe is already in one), it is not an insignificant risk to brush aside.
However, the fortunes of Oil States will ultimately depend on long-cycle offshore investments. These are multi-billion, multi-year projects which won’t be reversed just because of a cyclical downturn in oil prices in 2023. Petrobras, ADNOC and others are executing on a long-term strategy, not playing the short cycles. With exposure to Brazil and other hotspots, Oil States should feel confident about its pipeline over the next years. Passive selling across the energy sector when oil prices drop may indeed pressure down OIS’ stock, but then one could also view these occurrences as buying opportunities.
The second risk that needs to be addressed is debt and liquidity. A levered deepwater driller such as Transocean (RIG) will also benefit from the macro trends I have discussed, but Transocean has a lot of debt which legitimately increases downside risks. However, this is not the case for OIS. Oil States’ debt is not high and significant maturities are not due until 2026:
Oil States Investor Presentation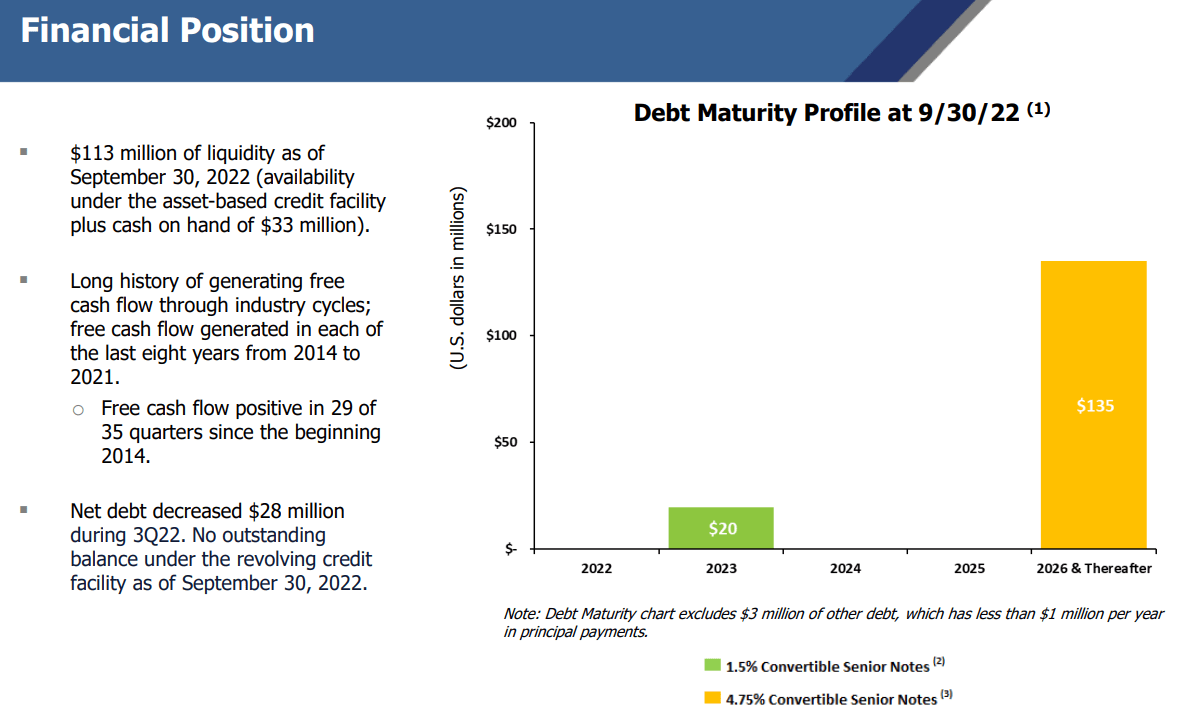
The best part is that the 2026 notes which form the bulk of the debt carry a fixed interest rate that won’t be affected by the rising interest rate environment. The notes imply annual interest expense of $5.5 million (total interest expense recognized for accounting for the first 9 months of 2022 was about $8 million), and that is more than adequately covered by the EBITDA. On a free cash flow basis (i.e., after capex), Oil States is also positive.
Conclusion
Oil States International, Inc. is a small-cap oilfield services company which is strongly positioned to benefit from the energy macro trends and the resurgence of deepwater activity. The valuation is not expensive, and the risks are fairly limited.
As a small cap in an already quite volatile sector, the Oil States International stock price may see significant short-term volatility, but in the longer term it should come to reflect the fundamental value.
Be the first to comment