

Oil Price Talking Points
The price of oil bounces back from a fresh weekly low ($67.61) in an attempt to retrace the decline following an unexpected rise in US inventories, but recent price action casts a bearish outlook for crude as it extends the series of lower highs and lows from the start of the week.
Oil Price Eyes July Low as Bearish Price Series Remains Intact
The price of oil has slipped back below the 50-Day SMA ($71.34) after posting three consecutive days of losses for the first time since May, and crude appears to be on track to test the July low ($65.01) as US inventories climb 3.626M in the week ending July 30 versus forecasts for a 3.102M decline.
Indications of slowing demand may lead to a larger correction in the price of oil as the Organization of Petroleum Exporting Countries (OPEC) agree to boost production “by 0.4 mb/d on a monthly basis starting August 2021,” but the ongoing weakness in US output may act as a backstop for crude as it remains below pre-pandemic levels.

A deeper look at the figures from the Energy Information (EIA) showed weekly field production holding at 11,200K for the second week, and signs of limited supply may keep the price of oil afloat as OPEC’s most recent Monthly Oil Market Report (MOMR) emphasizes that “the positive developments in the containment of the pandemic as well as the solid expectations for globaleconomic growth are assumed to spur consumption for oil in 2022.”
In turn, the price of oil may track last month’s range ahead of the next OPEC and non-OPEC Ministerial Meeting on September 1 amid the mixed data prints coming out of the US, but recent price action casts a bearish outlook for crude as it extends the series of lower highs and lows from the start of the week.
With that said, the price of oil may face a larger correction as it slips back below the 50-Day SMA ($71.34), and crude may attempt to test the July low ($65.01) amid signs of slowing demand.
Oil Price Daily Chart
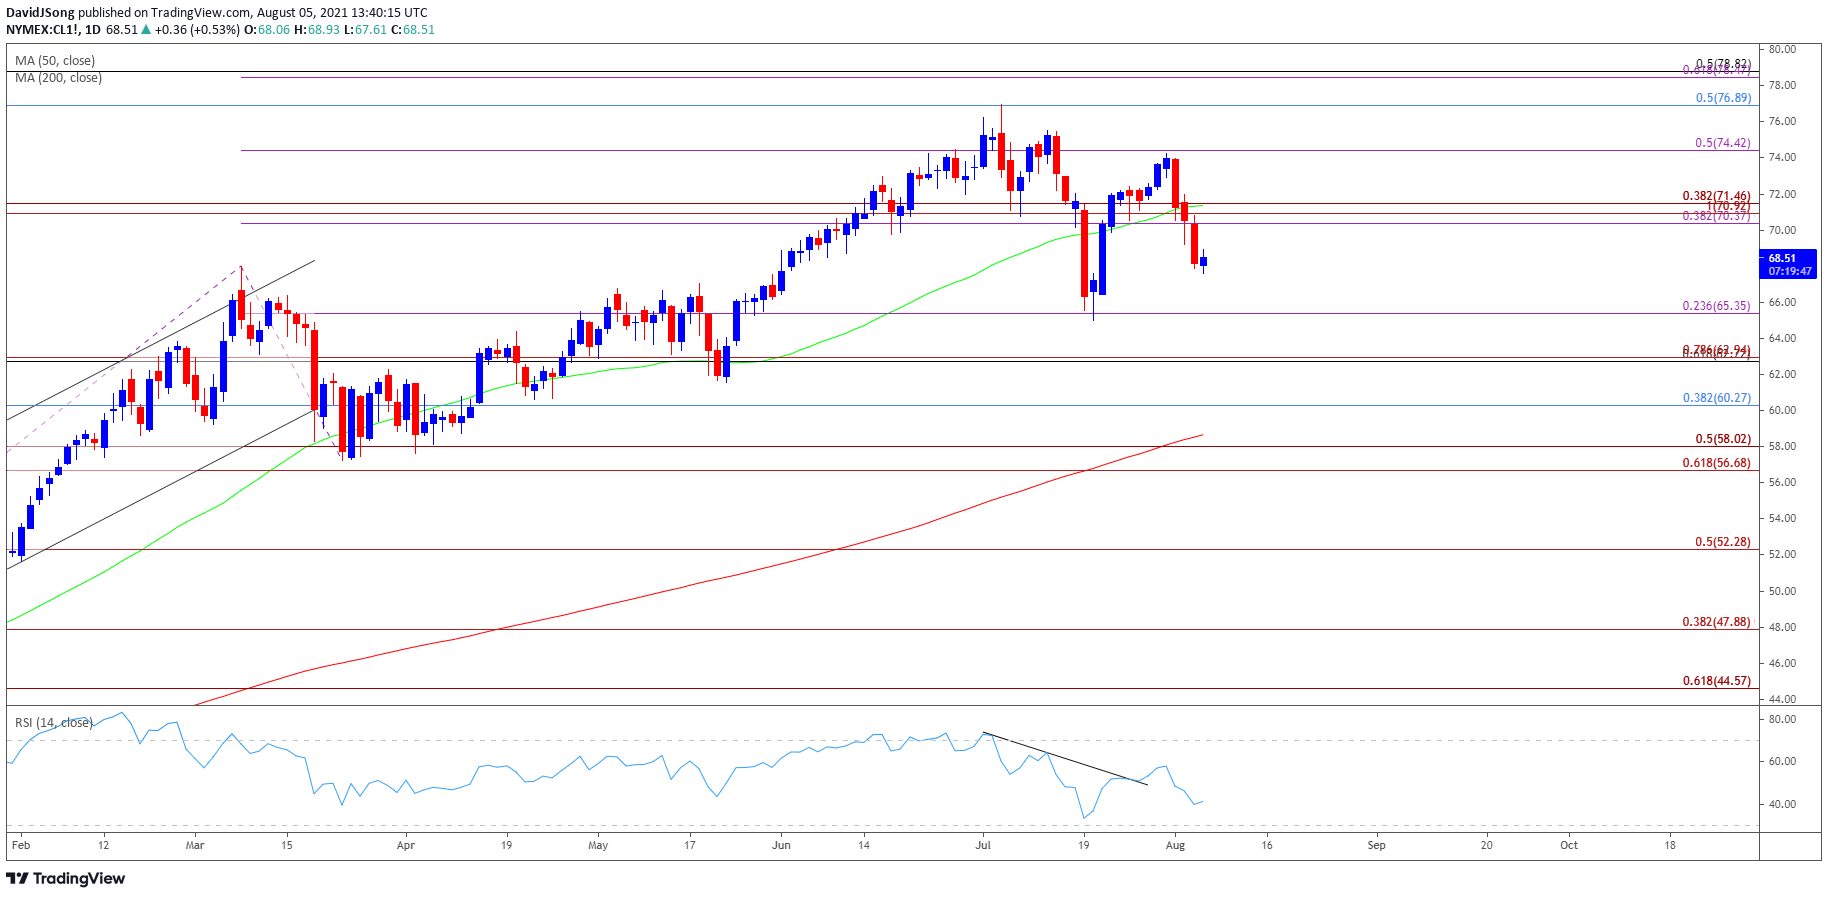
Source: Trading View
- Keep in mind, crude broke out of the range bound price action from the third quarter of 2020 as it established an upward trending channel, with the price of oil taking out the 2019 high ($66.60) as both the 50-Day SMA ($70.55) and 200-Day SMA ($57.72)established a positive slope.
- The broader outlook for crude remains constructive as the rally from earlier this year removed the threat of a double-top formation, but lack of momentum to test the 2018 high ($76.90) pushed crude below the 50-Day SMA ($71.34), with the Relative Strength Index (RSI) establishing a downward trend after flashing a textbook sell signal in July.
- The price of oil extends the bearish price series from earlier this week as it pushes below the Fibonacci overlap around $70.40 (38.2% expansion) to $71.50 (38.2% expansion), but another failed attempt to close below the $65.40 (23.6% expansion) region may keep crude within a defined range.
- At the same time, a break below the July low ($65.01) opens up the $62.70 (61.8% retracement) to $62.90 (78.6% expansion) region, with the next area of interest coming in around $60.30 (38.2% retracement).
— Written by David Song, Currency Strategist
Follow me on Twitter at @DavidJSong
Be the first to comment