

imaginima
Introduction
Amid the recent market pullback, we remain bullish on crude oil (CL1:COM), as we see markets pitted against the strongest fundamental oil backdrop in decades. As deconstructed below, oil markets are underpinned by steeply deteriorating inventory levels (in both OPEC and OECD nations), accelerating refinery yields, and unwavering supply levels. Operators are generating meaningful free cash flow (“FCF”) and are poised to be debt-free by year-end or 1H23. As inflation remains top of mind, key differentiators amongst E&Ps are low decline inventories, secured tubing/casing stockpiles, and tax pools heading into 2023. In addition to our views on the macro backdrop, we will share our views on some of the most appealing E&P players in the Canadian landscape.
Inventories
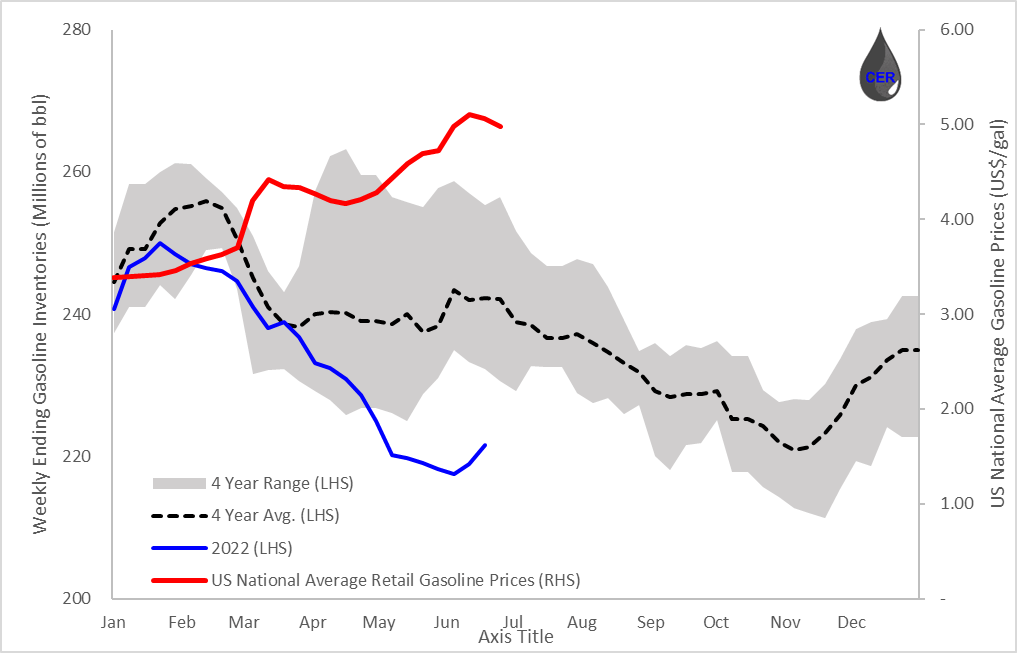
The U.S. Energy Information Administration (EIA) provides a weekly update on domestic inventories across various crude and product types. Inventory levels are one of the easiest ways to get a sense of the supply-demand tilts in the North American energy markets. As demand outpaces supply, inventory levels will draw down and prices will rise. In contrast, a demand shock such as the pandemic will cause an oversupply in the markets, lowering prices and rising inventory levels. In a sense, inventory levels act as the shock absorbers of the energy sector with lower inventory levels resulting in a higher propensity for volatile prices due to visceral demand shocks. Inventory levels across a range of products are well below their 4-year lows, as illustrated below, indicating that product demand is outpacing incoming crude oil supply.
Figure 1: Crude Oil Inventories and Brent Spot Prices (Source: EIA, generated and formatted by CER) Figure 2: Gasoline Inventories and US National Average Retail Gasoline Prices (Source: EIA, generated and formatted by CER)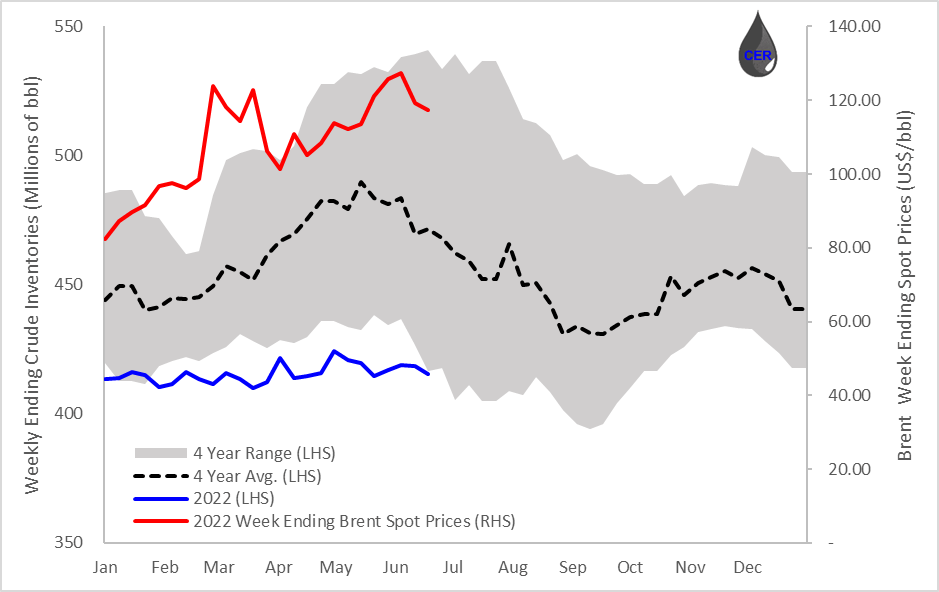
In light of the Biden administration’s announcement of a release from the Strategic Petroleum Reserve (SPR) of 1 mb/d over the course of six months, prices have remained strong as absorption rates are simply too strong; further supporting the case for a constructive market outlook. Furthermore, EIA members are required to hold 90 days of net imports to cover strategic reserves.
The U.S. imports ~6.5mb/d and exports ~3mb/d, yielding a difference of ~3.5mb/d. This implies a theoretical SPR minimum storage of 315mb. As illustrated below, SPR levels are severely below their 4-year lows and steadily trending toward their minimum theoretical levels all while WTI prices have continued to trend upwards. Meaning that SPR releases have had little to no effect alleviating both product (ex. retail gasoline) or supply (ex. crude oil) prices. This has proven that using SPR releases as a market stabilizer is an ineffective tactic and should be reserved for times of crisis such as environmental disasters.
Figure 3: SPR Inventories and WTI Week Ending Spot Prices (Source: EIA, generated and formatted by CER)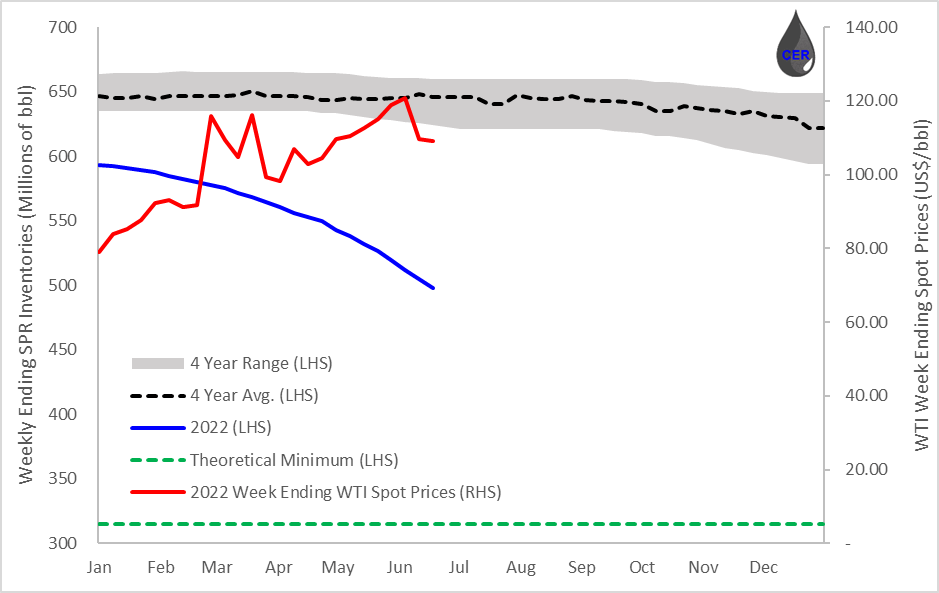
Given the ongoing Russian-Ukraine conflict, Europe is experiencing the most severe flow disruption in decades given its historical reliance on Russia. Europe has therefore relied on its western OECD counterpart to supply many of the refined products in light of escalating tensions and rising energy prices. As illustrated to by the plots below, the U.S. has accelerated its refined product export and has transitioned to being a net exporter in recent months, all while prices domestically continue to trend upwards. This has continued to push both U.S. and OECD inventories further into deficit territory, and supported higher pricing (albeit the latest pricing pullback) relative to historical levels.
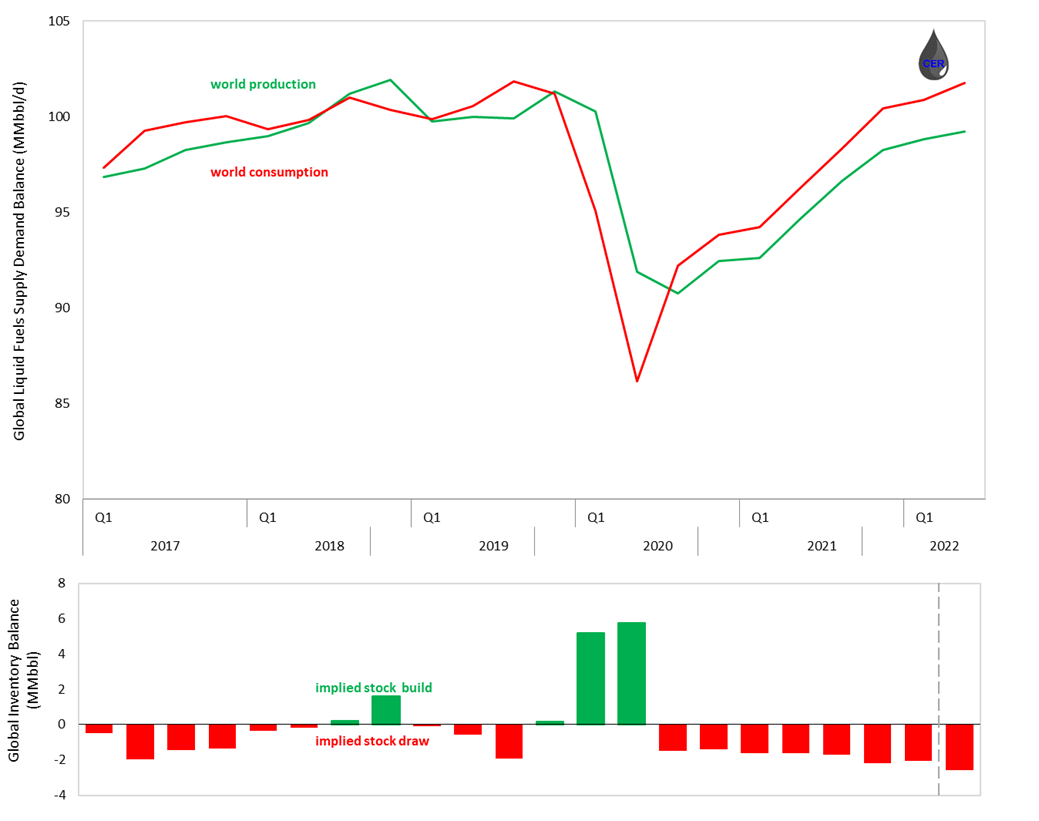
Furthermore, OPEC inventories have also been trending downwards, as noted by Secretary General Barkindo at the Global Energy Conference earlier last month. This indicates that demand is outpacing supply across the globe and not only in North America. All current supply-demand dynamics continue to point to increasing product deficits, and even with demand destruction, OECD nations would have built inventory levels meaningfully in order to reach seasonally adjusted normal levels. In light of such a tight product market, a high floor for crude prices continues to develop, further supporting a bullish outlook.
Figure 4: US Crude and Petroleum Products Exports (Source: EIA, generated and formatted by CER) Figure 5: Global Liquid Fuel Supply Demand Balance (Source: EIA, generated and formatted by CER)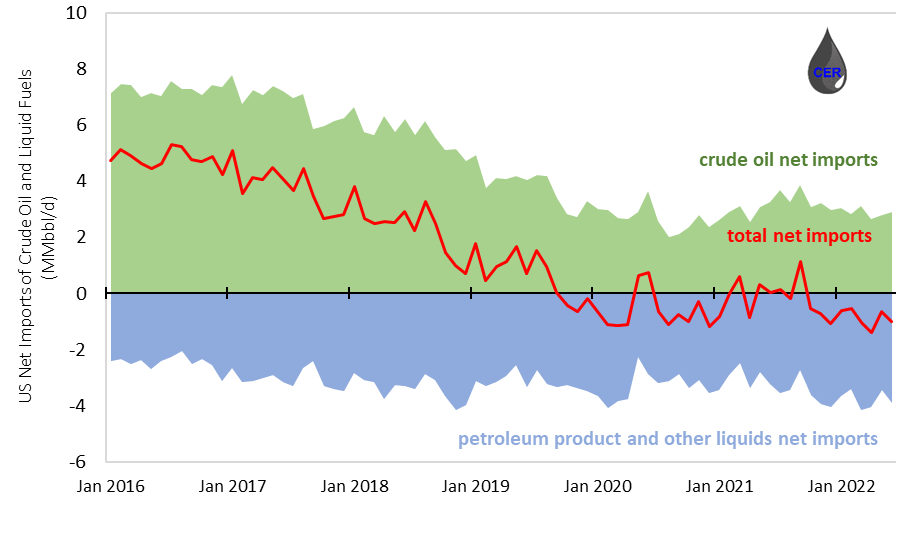
Demand
One of the strongest pillars of the oil stack is the refined product complex, which is reflected by record refinery cracks across the globe. A crack spread measures the difference between the purchase price of crude oil and the selling price of finished products, such as gasoline and distillate fuel, that a refinery produces from the crude oil. Crack spreads are an indicator of the short-term profit margin of oil refineries because they compare the cost of the crude oil inputs to the spot prices of the outputs (although they do not include other variable costs or any fixed costs).
As such, crack spreads can be used as barometer for implied product demand as spreads will begin to compress in the case of product demand destruction. Currently, crack spreads continue to remain strong and have skyrocketed in comparison to recent years, all while inventories for both product and crude continue to decrease. U.S. refiners remains well positioned to generate robust cash flows as refineries operate at high utilization levels while crack spreads remain elevated.
Figure 6: US 3-2-1 Refinery Crack Spread (Source: EIA, generated and formatted by CER)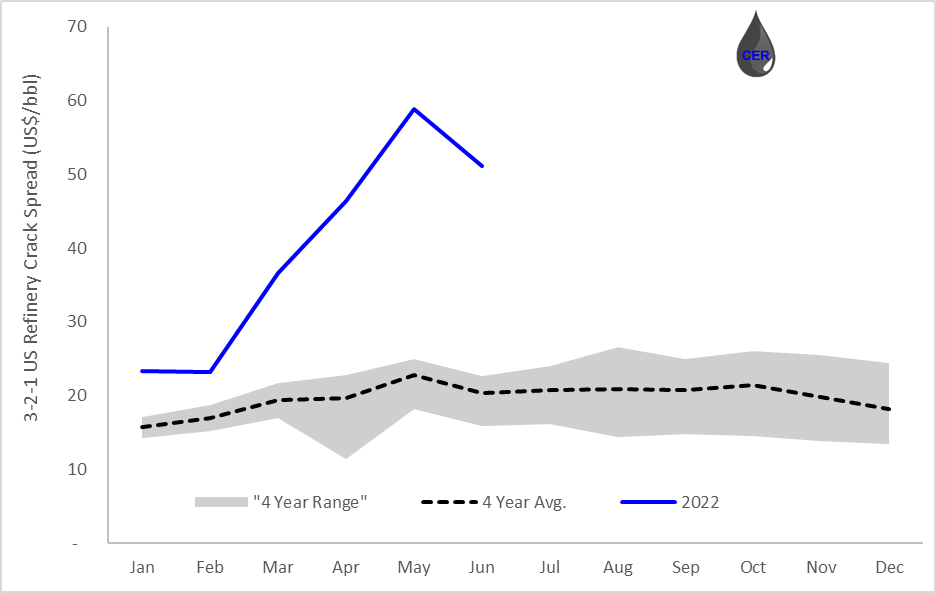
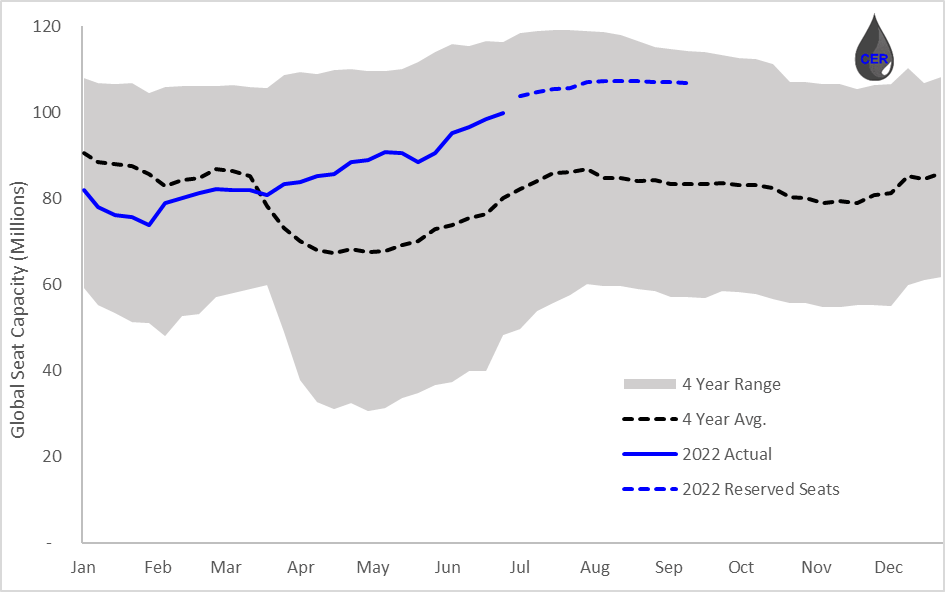
Let’s first consider kerosene demand (used primarily for jet fuel). Several sources can be considered as a proxy for implied travel demand, namely the TSA checkpoint, which counts the number of travelers going through the United States (including both inbound and transfer flights). This serves a proxy for implied flight demand in North America. Additionally, the Official Aviation Guide monitors the historical and future (3 month forward) seat capacity on a global, domestic, and international scale. It also provides a summary of the confirmed booked seats for the next three months. The trends all appear constructive, illustrating growing flight demand which will in turn translate to increased kerosene product demand, further supporting a bullish outlook for crude oil (CL1:COM).
Figure 7: TSA Checkpoint Passenger Throughput (Source: TSA, generated and formatted by CER) Figure 8: Global Seat Capacity (Source: OAG, generated and formatted by CER)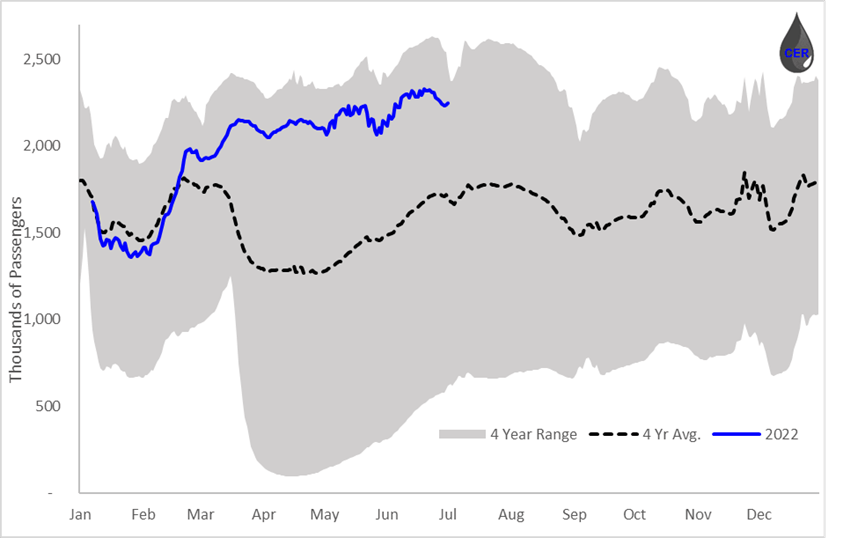
The 3:2:1 crack spread approximates the product yield at a typical U.S. refinery: for every three barrels of crude oil processed, it makes two barrels of gasoline and one barrel of distillate fuel. In order to partly deconstruct the skyrocketing crack spreads, let’s consider gasoline demand which would drive a majority of the product demand associated with a 3:2:1 spread. Similar to the example for implied jet fuel demand, several proxies illustrate implied gasoline demand across the country.
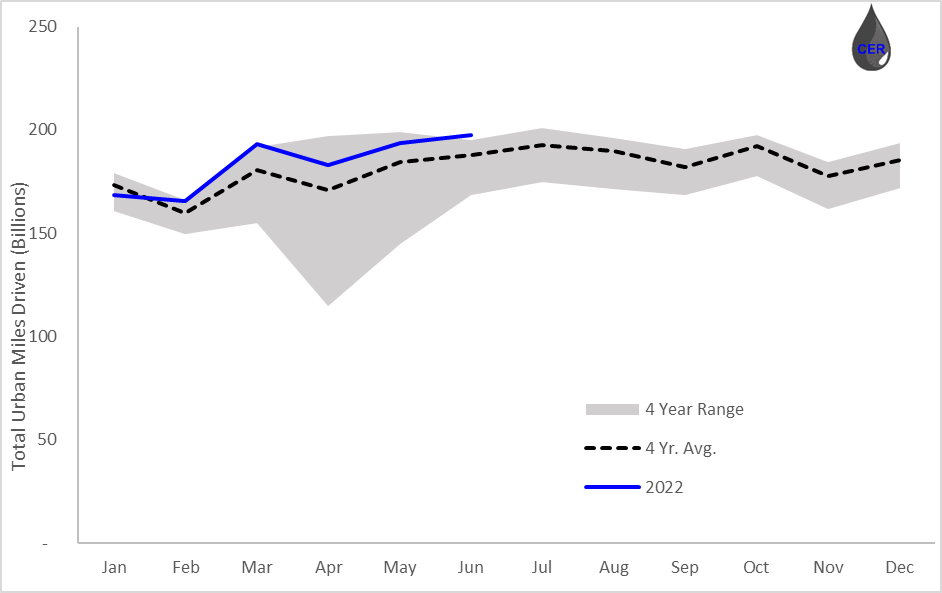
The Federal Highway Administration (FHWA) provides a monthly summary of the total urban and rural miles driven across the country. The plots below indicate the 2022 mileage is already trending at the upper range of the four-year average, a bullish indicator for consumer gasoline demand on both rural and urban roads.
Figure 9: Total Rural Miles Driven (Source: FHWA, generated and formatted by CER) Figure 10: Total Urban Miles Driven (Source: FHWA, generated and formatted by CER)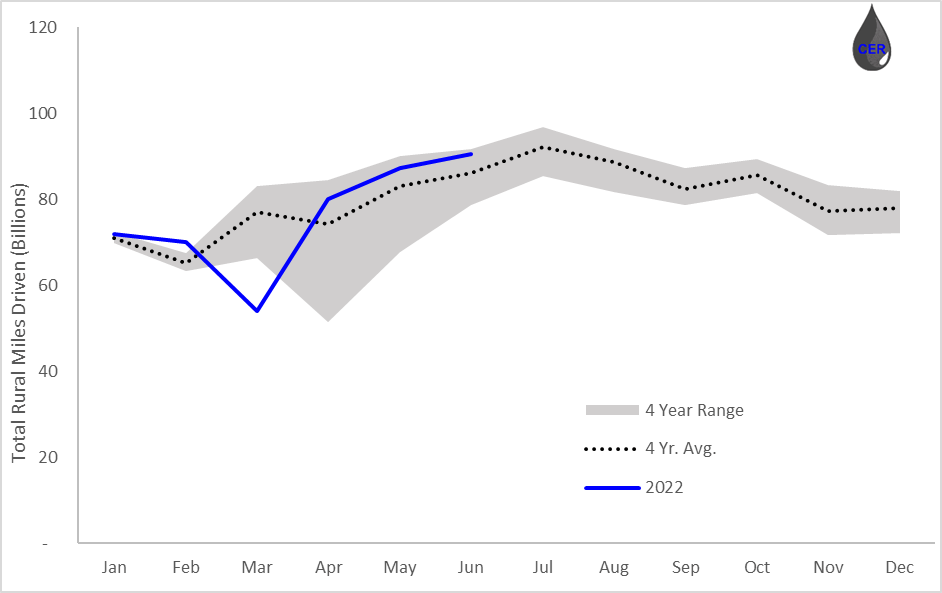
Lastly, let’s consider the case for demand destruction. The last time prices peaked in 2008, they were led by household saving rate of around 3% which was well below the 50 year average of around 8%. Prior to crude oil and product prices rising in 2022, household savings rates reached an all-time high and most households were sitting at an average 11% household saving rates. Furthermore, the 30 year historical gasoline expenditure as a percentage of total spend is around 3.6%, while as prices rose back in 2008 gasoline expenditures increased to 4.5%. Despite record prices, current expenditure as a percentage of total spend is 3.5% meaning that it still trailing the 30 year average and meaningfully below 2008 expenditure levels. Moreover, in order to increase personal expenditure back to 2008 levels, gasoline prices would have to increase another 30% from current levels bringing the national average up to US$6.60/gal.
All this to say: consumers have significantly more fiscal capacity to sustain higher prices before the onset of demand destruction begins to reduce product and crude pricing. Moreover, although current pump prices are high, consumers have the ability to cut a significant amount of discretionary spending before having to cut back on core demands such as gasoline. The way we see it, habitual changes due to the higher gas prices (such as taking public transit more) is more in-line with “demand reaction” rather than true “demand destruction” as would be the case if many consumers took more drastic decisions such as returning to a lockdown level of economic activity and cancelling vacations (which is not the case as illustrated by flight bookings in Figure 8 above).
Figure 11: Household Savings Rate and Consumer Spending on Gasoline (Source: FRED, generated and formatted by CER)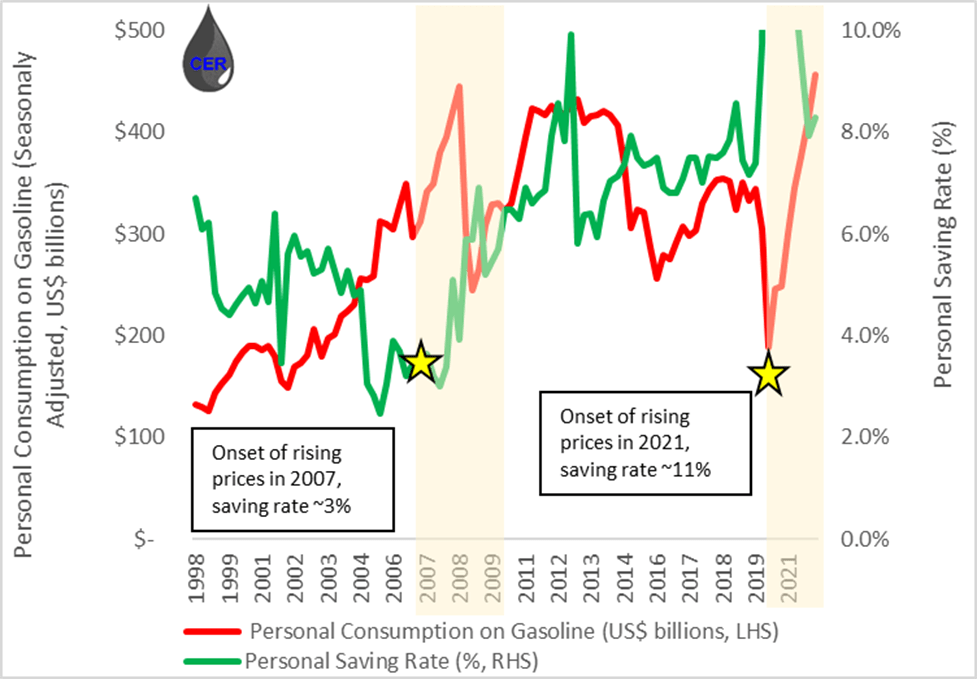
Finally, we conclude by noting that October 2022 will key timing for consideration for many investors. Firstly, the SPR inventories will be encroaching their minimal storage level, and the U.S. government will have to close the taps in order to abide EIA member country requirements. This could have meaningful impact to crude prices as another tier of supply is abruptly removed from the market.
Secondly, the Chinese Communist Party will meet for its 20th National Congress will meet in October to discuss future plans for China, including its re-opening policy. If constructive, China’s re-opening could have a meaningful pull demand.
These two factors in isolation would be bullish to the oil cycle, aside from the fact that in October temperatures begin to decrease in North America. This has historically coincided with lower crude and product inventories as demand increases heading into winter.
Supply
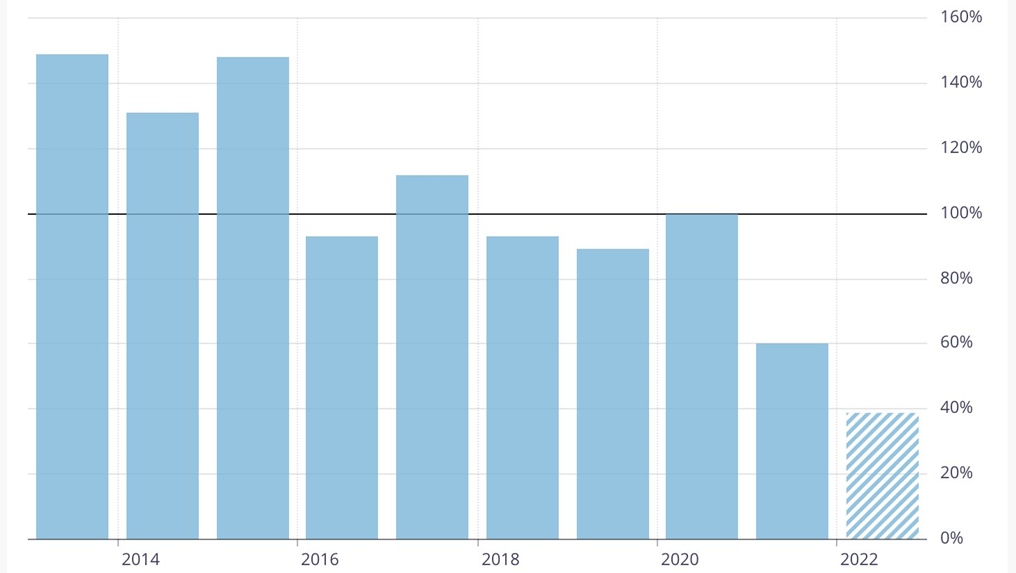
For over a decade, there has been a meaningful reduction in capital investment in oil and gas for both Canada and the United States. With capital expenditures shrinking from ~6-7% of GDP to 3% of GDP since 2010, all while global energy consumption has increased over 15%. This has resulted in an ever more tightened supply-demand imbalance, with production unable to ramp up due to the limited amount of organic upstream investment in recent years. Furthermore, albeit the high commodity pricing of recent months, the Bank of Canada released that capital spending in the Oil and Gas sector is meaningfully lower than it was pre-pandemic. Companies and energy producers are setting aside just 40% of cash flow towards capital investment, down from 100% pre-pandemic.
Figure 12: Oil and Gas Capital Expenditures as a Percentage of GDP (Source: EIA, AER, Government of Canada, generated and formatted by CER) Figure 13: Capital Expenditures in Energy as a Percentage of Cash Flow (Source: Government of Canada, Toronto DS)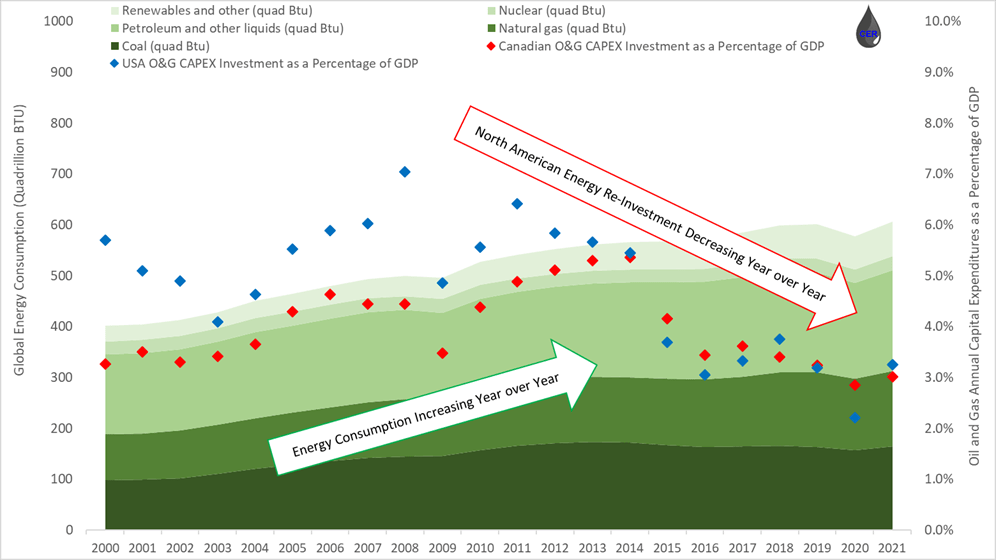
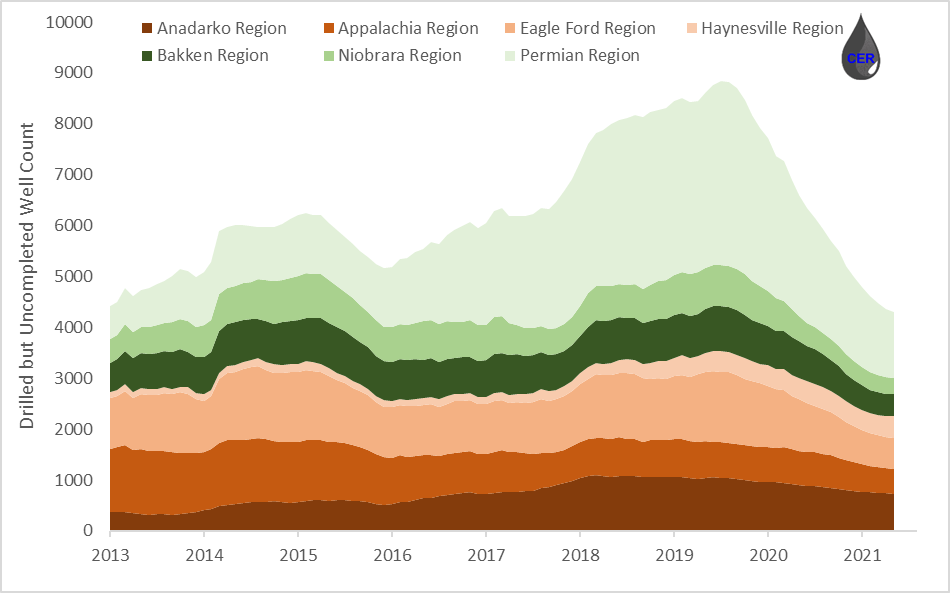
Production from the major U.S. regions has largely returned to pre-pandemic levels but has not increased beyond those levels albeit surging energy prices, as illustrated by the figure below. Note the orange tint for oil-weighted regions and the green tint for gas-weighted regions. Furthermore, the drilled but uncompleted (DUC) well count, which has been decreasing drastically since the onset of the pandemic, has begun to taper off. As DUCs decrease, more wells are being completed than are being drilled. Meaning operators are only investing capital on assets with some partial investment already in the ground. Moreover, as DUCs begin to taper off and increasing, it means more wells are being drilled than are being completed. Indicating that capital is being deployed to identify and exploit new locations. Although we are seeing signs on DUCs decline beginning to taper off, it will be several months before this trend is reversed and we see meaningfully higher drilling activity in North America.
A critical hurdle for many E&P operators to overcome now is inflation. Cost inflation for the upstream industry has increased to levels not seen in decades. Wood Mackenzie projects ultradeep rig rates will rise at 26% YoY, while other U.S. Lower 48 onshore costs are expected to rise by 15-20%. A differentiator among operators will be their strategic ability to procure tubing, casing and other long-lead items at favorable price. Moreover, labor supply appears to be tight across all producers, given many workers who were laid off during the pandemic may do not have much appetite to return to the industry.
Many operators are now facing the difficult decision to increase production but at deteriorating profit margins, or maintain current production levels but forego to short term pricing upside. All this further supports a bullish pricing outlook as supply is unlikely to materially increase in the near term future.
Figure 14: US Production by Region (Source: EIA, generated and formatted by CER) Figure 15: US Drilled but Uncompleted [DUC] Well Count by Region (Source: EIA, generated and formatted by CER)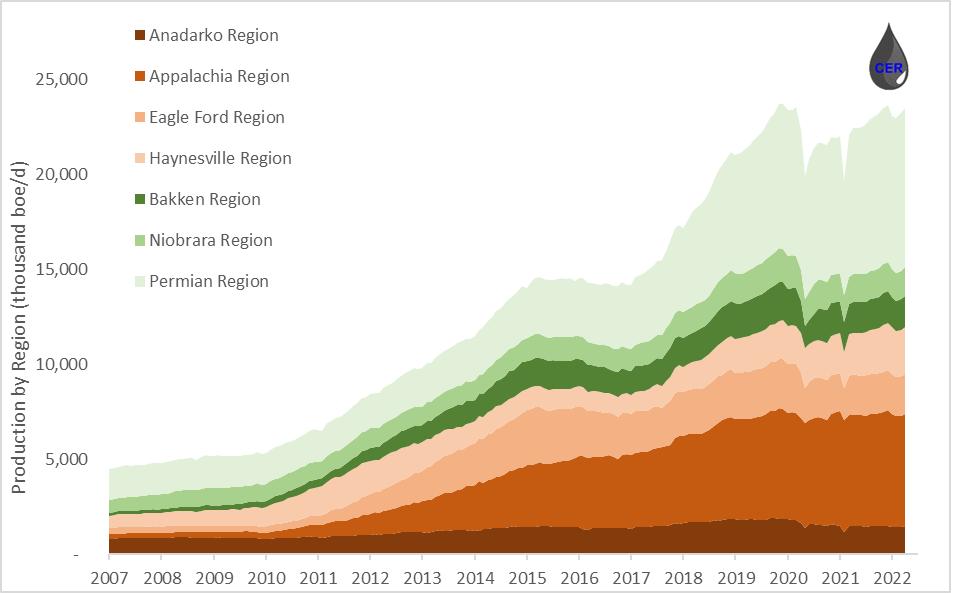
This theme of undersupply and slow production growth is not concentrated to OECD countries. Earlier this month the 20 members agreed to raise targets by 648,000 barrels per day. The group’s actual production has fallen drastically short of target, with all by two OPEC+ members (Algeria and UAE) being able meet their targets for the month of May. OPEC inventories and supply has also been trending downward, and this is manifesting itself as OPEC countries are now missing output targets by over 2.6 million bbl/d. A final catalyst of an incredibly tight energy market, and a bullish indicator for commodity pricing in the year ahead.
Figure 16: OPEC+ Production Output Relative to Target (Source: Bloomberg generated and formatted by CER)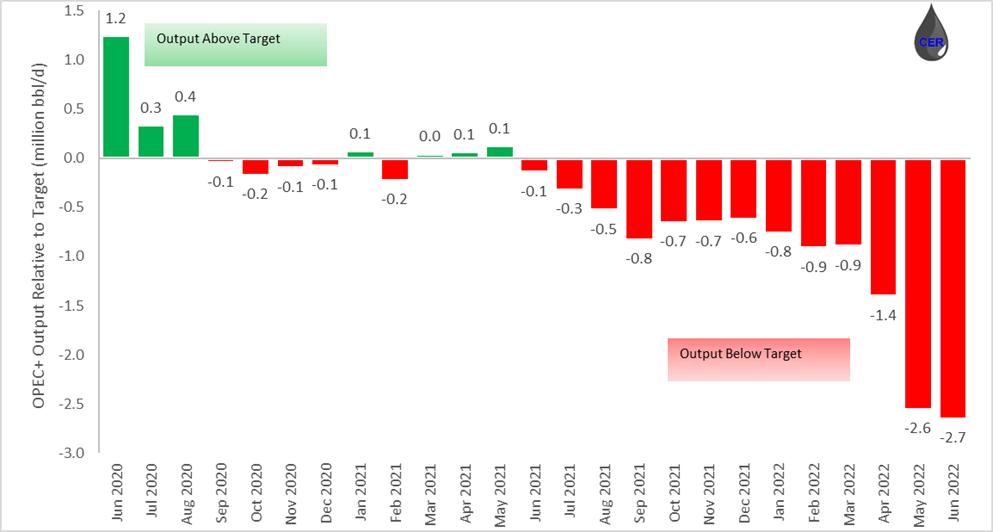
Overall Themes and Top Picks in Canadian O&G
As we approach the end of the first half of 2022, and building on the constructive market backdrop above, we have summarized common themes from investors and management across Canadian E&P. In addition to the common themes, we will share relevant trading multiple metrics and highlight our highest conviction picks heading into the second half of the year. Among Canadian producers management has continued to highlight excess FCF generation in 2022+, supporting rapid debt reduction and incremental capital to be returned to shareholders.
As such, many companies have noted they will reach a net cash position in 2023. Canadian E&Ps have reiterated focus towards disciplined free cash flow allocation strategies. With the primary goal of strengthening the balance sheets, and a secondary goal of managing shareholder returns while remaining as flexible as possible. As such, shareholder returns have materialized through special dividends and share buybacks, with some companies also increasing their base dividend.
Albeit the pricing environment, producers continue to remain disciplined and haven’t demonstrated much appetite towards increasing growth. Partly due to inflationary pressures driving the costs of labor, logistics, fuel and tangible items as high as 15-25% year over year. As such, many of the producers have continued to reiterate low to mid single digit production growth. As illustrated by the plot below, overwhelming majority of Canadian producers are guiding towards a YoY production growth of low to mid single digit growth, from 2022 to 2023. Further reiterating a pull towards capital retention and a focus towards shareholder return over production growth.
Figure 17: Canadian E&P 2022 to 2023 YoY Production Growth and Capital Spend (CAPEX / Production) (Source: Corporate Disclosures, generated and formatted by CER)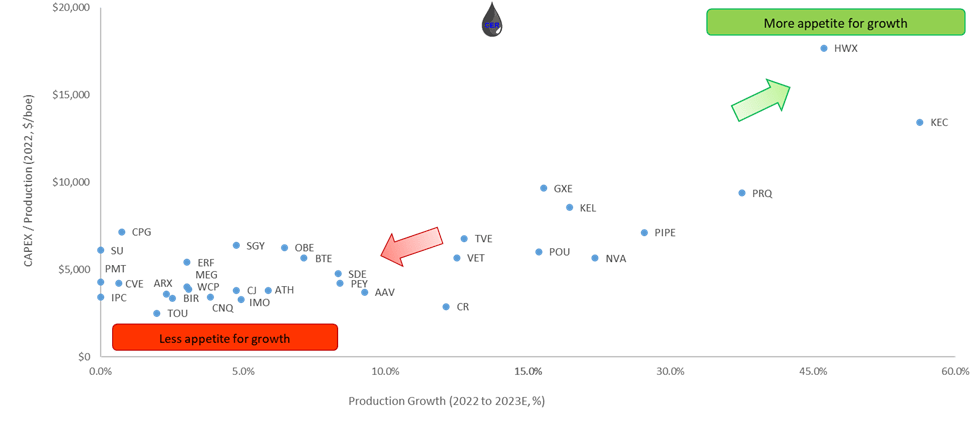
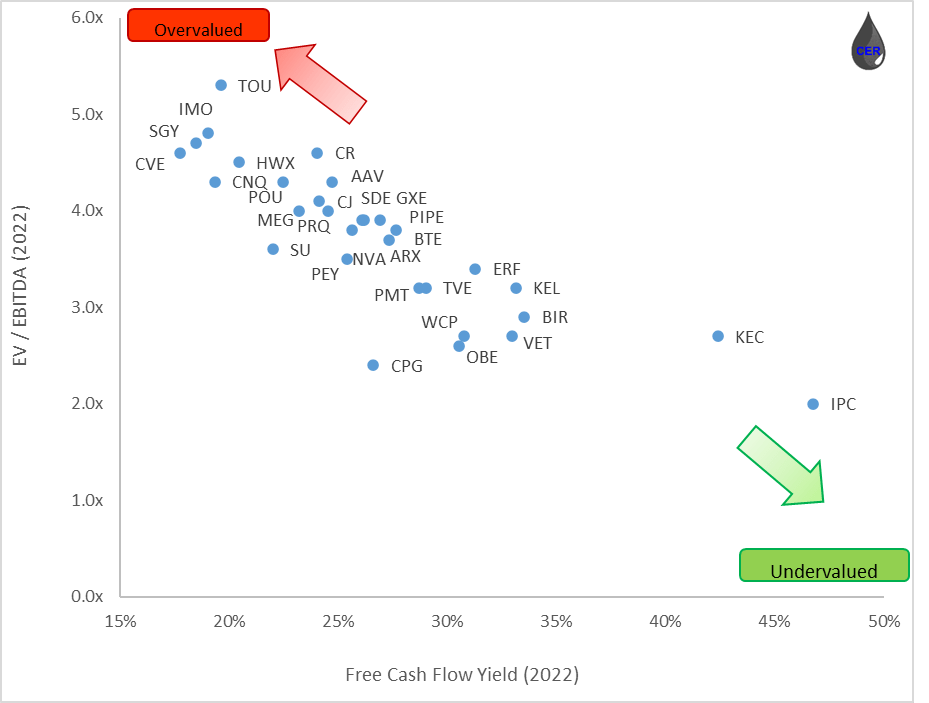
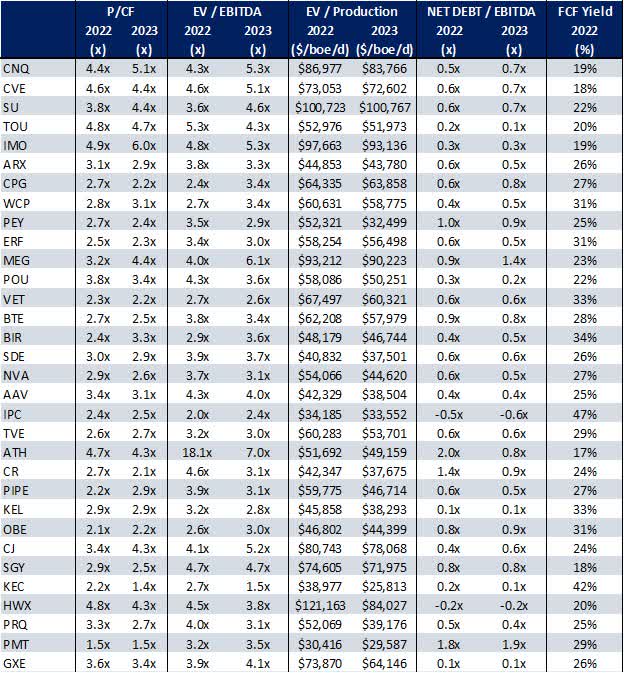
Looking exclusively at relevant multiples, some of the favorites that stand out include IPC (OTCPK:IPCFF), Kiwetinohk, Obsidian (OBE), and Perpetual Energy (OTCPK:PMGYF). With an overwhelming majority of companies trading between a 2.0x – 3.0x P/CF and C$40 000 – C$60 000 EV/Production multiples. More impressively, most companies are still posting over 20% FCF yield albeit the meaningful increase in equity valuation year to date.
If you are looking for oil exposure, one of our favorites is MEG Energy (OTCPK:MEGEF). MEG is a best-in-class in-situ oil sands operators in terms of iSOR and OPEX minimization, who will generate over US$1.6 billion in free cash flow in 2022 and is poised to return a meaningful amount to shareholders. In terms of natural gas exposure, one of our favorites is Birchcliff Energy (OTCPK:BIREF) who has been trading at attractive multiples compared to peers, maintains a dominant position in the Peace River region and is poised to generate US$450 million in free cash flow in 2022 given the strong natural gas pricing environment.
Figure 18: Canadian E&P P/CF and EV/Production (Source: Corporate Disclosures, generated and formatted by CER) Figure 19: Canadian E&P EV/EBITDA and Free Cash Flow Yield (Source: Corporate Disclosures, generated and formatted by CER) Figure 20: Canadian E&P P/Relevant Trading Multiples (Source: Corporate Disclosures, generated and formatted by CER)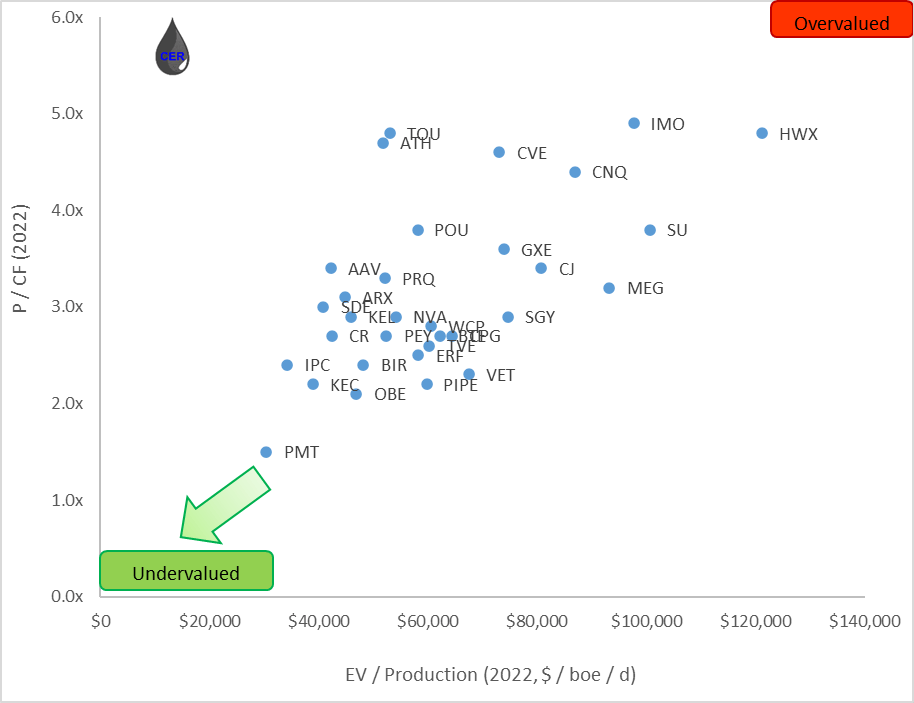
Be the first to comment