

ahopueo/iStock via Getty Images
OIH and XES Overview
VanEck Vectors Oil Services ETF (NYSEARCA:OIH) and SPDR S&P Oil & GAS Equipment & Services ETF (NYSEARCA:XES) both track 100% oilfield service (OFS) indexes. Both funds invest in stocks of companies operating across energy, energy equipment and services, and oil and gas drilling. OIH tracks the performance of the MVIS U.S. Listed Oil Services 25 Index by full replication, while XES tracks S&P Oil & Gas Equipment & Services Select Industry Index by representative sampling.
Fund Profiles
Seeking Alpha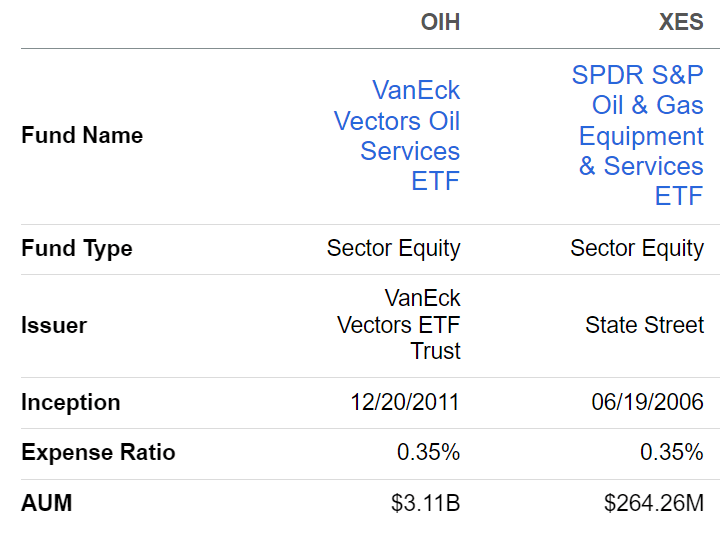
Expense ratios for both funds are reasonable at 0.35%. OIH has $3.11B in assets under management, while XES is much smaller with only $264.26M under management.
Fund Quant Ratings
Seeking Alpha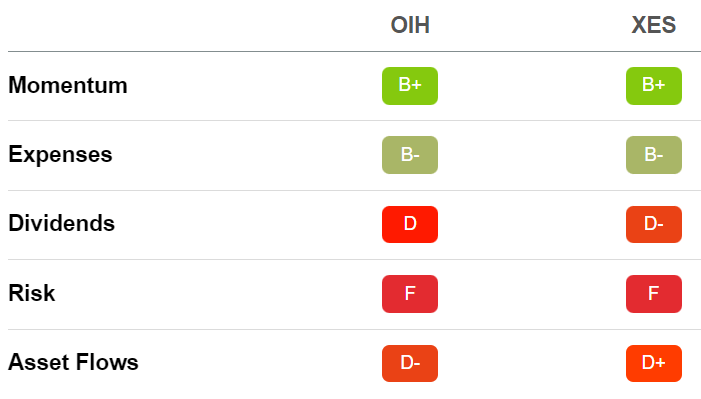
With relation to Seeking Alpha’s Quant system, OIH and XES rate well for momentum and expenses. Both funds have somewhat poor scores for dividends, risk, and asset flows.
Historical Price Return
Seeking Alpha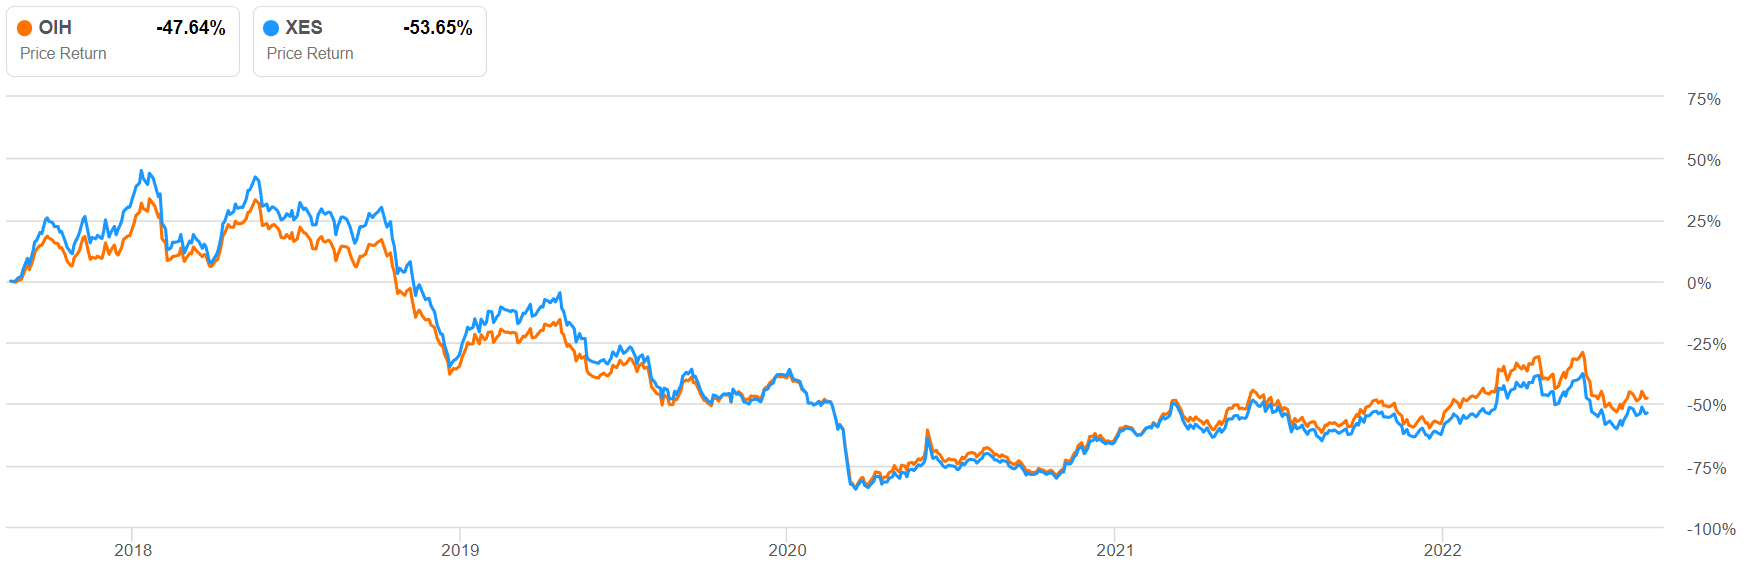
Both OIH and XES are still down over 50% from 2018 highs despite returning about 25% YTD. I think both are headed toward their 2018 highs for a possible 100% return over the next three years, and I rate both a buy. In the following paragraphs, I will present my investment thesis for OIH and XES and discuss notable differences between the funds.
Oil and Gas Demand
Energy markets are volatile with abundant and often contradictory news every day. OPEC continues to underproduce its own production quotas, the U.S. has tapped its strategic petroleum reserve, and Europe’s energy crisis is probably just beginning. Meanwhile, governments and perhaps most investors are more excited about renewable energy. One might be forgiven if he or she imagines that oilfield services are dead men walking. However, the EIA projected near constant demand for oil and gas through 2050 in its latest International Energy Outlook report.
Global Energy Demand From All Sources
U.S. EIA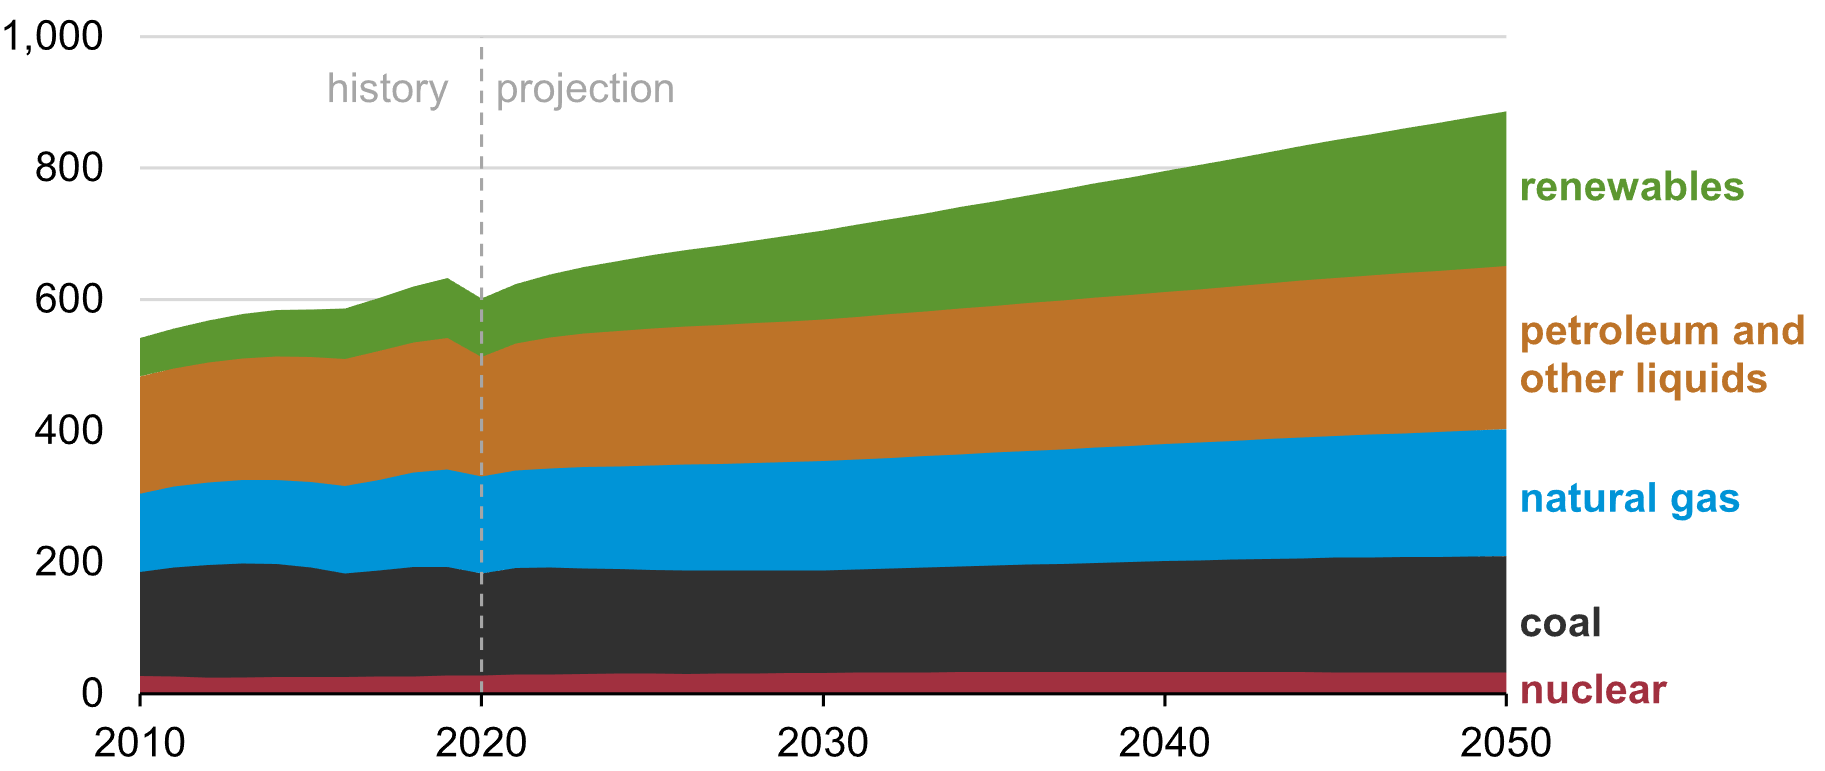
In my recent coverage of the Vanguard Energy ETF (VDE), I built the case for a broad investment in oil and gas even as the world aims to transition to renewables. In short, renewables are not cheaper in many cases and new energy production from renewables will be offset by increased demand for energy from all sources including oil and gas. In the US, most of that oil and gas will be produced from tight reservoirs.
Tight Oil and Gas Reservoirs
Tight or unconventional reservoirs exhibit low permeability, complex lithology, and high production decline rates in new wells. Since 2005, new U.S. production has been predominantly from tight reservoirs facilitated by horizontal drilling and hydraulic fracturing technology .
U.S. Gas Production by Reservoir Type
U.S. EIA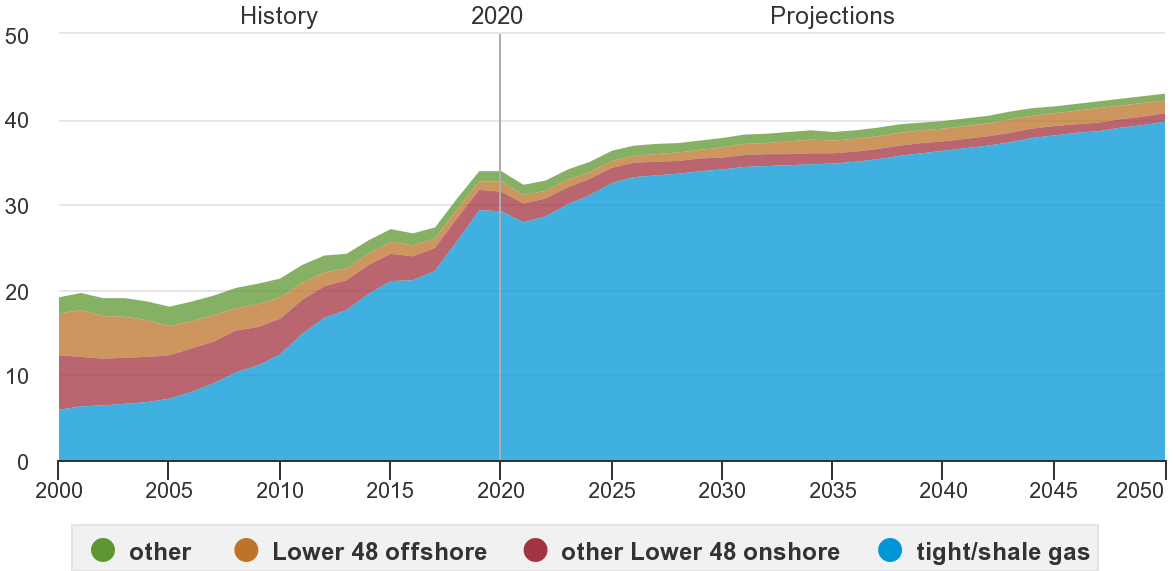
Currently, gas production from tight reservoirs dominates total U.S. gas production at over 70% of total U.S. natural gas. U.S. oil production has followed a similar trajectory with over 60% of current production from tight reservoirs, according to the EIA.
Production Decline
Production in tight reservoirs is subject to steep declines as a result of the characteristic low porosity and complex lithology of tight reservoirs. The EIA provided a model for typical production decline in tight oil and gas wells in its Annual Energy Outlook 2022. The EIA’s production decline model is based on wells drilled since 2008, and is based on historical data and unique parameters developed for individual basins and subplays within those basins.
Typical Single Well Production Decline: Backen Central; Williams, N.D.
U.S. EIA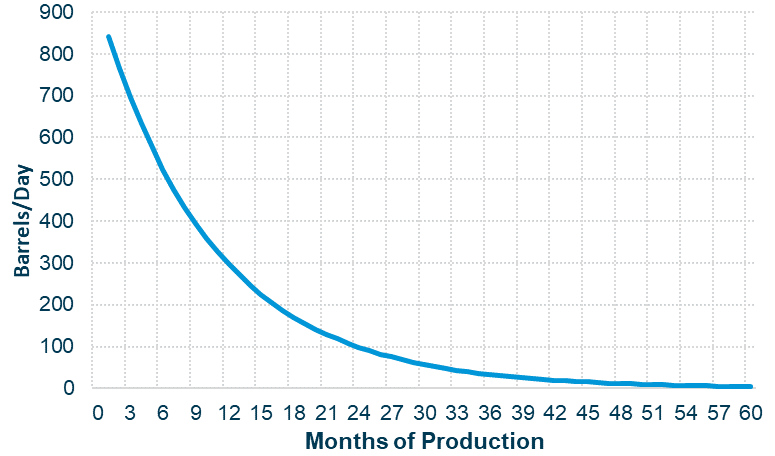
The production decline curve above is based on data for a unique field in the Backen, but generally representative of decline curves in tight reservoirs. In this example, initial production (Q) of almost 800 barrels per day (bpd) drops by more than 50% to about 300 bpd at 12 months. At three years production is less than 50 bpd, or about 6% of initial production. This steep decline necessitates continuous investment in new wells to merely maintain constant production.
Field Production Decline With New Wells Added Over Time
Chart by Author, US EIA Data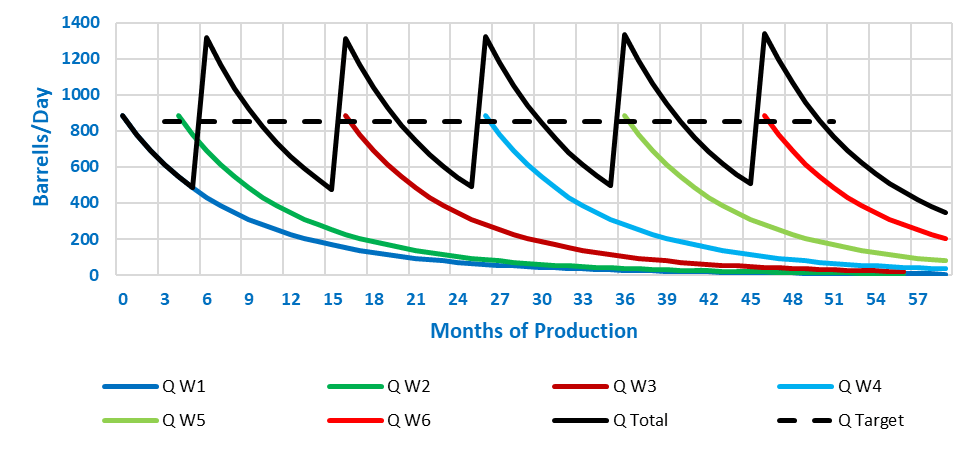
The theoretical production plot above is based on drilling, completing, and producing from an additional new well (represented by the colored lines) every 10 months in the same field as the single well example. The resulting total decline curve is the black sawtooth patterned line of Q Total shown above. In this model, a target average production (Q Target) of 850 barrels/day (represented by the dashed line) is maintained by adding new wells over time. This continuous investment in new wells represents revenue for the OFS companies comprising the holdings of OIH and XES.
Global Drilling Activity
Baker Hughes (BKR) has provided North American rig counts since 1944 and added international activity in 1975. Drilling activity is a good indicator of present and future revenues for oilfield services and is perhaps the best way to take the pulse of the industry. The Baker Hughes rig count acts as a leading indicator of demand for oilfield services including drilling, completing, producing, and processing hydrocarbons.
Global Rig Count 2018-Present
Chart by Author, BKR data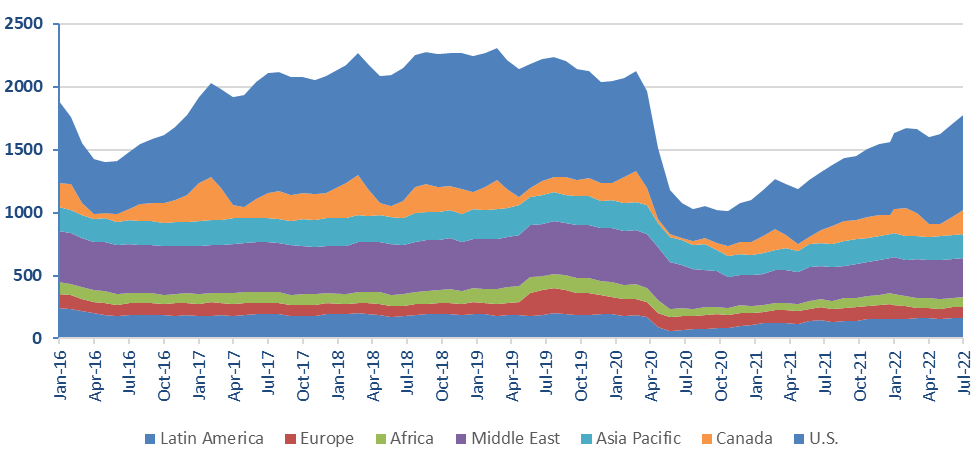
U.S. drilling rig count was 791 in January of 2020 and plummeted to 250 in August 2020, for a decrease of almost 70% as a result the COVID-19 pandemic. Many of the oilfield service holdings of OIH and XES reported several horrifying quarters starting in early 2020, as the following chart illustrates.
EPS – Diluted Before Extra (TTM)
Seeking Alpha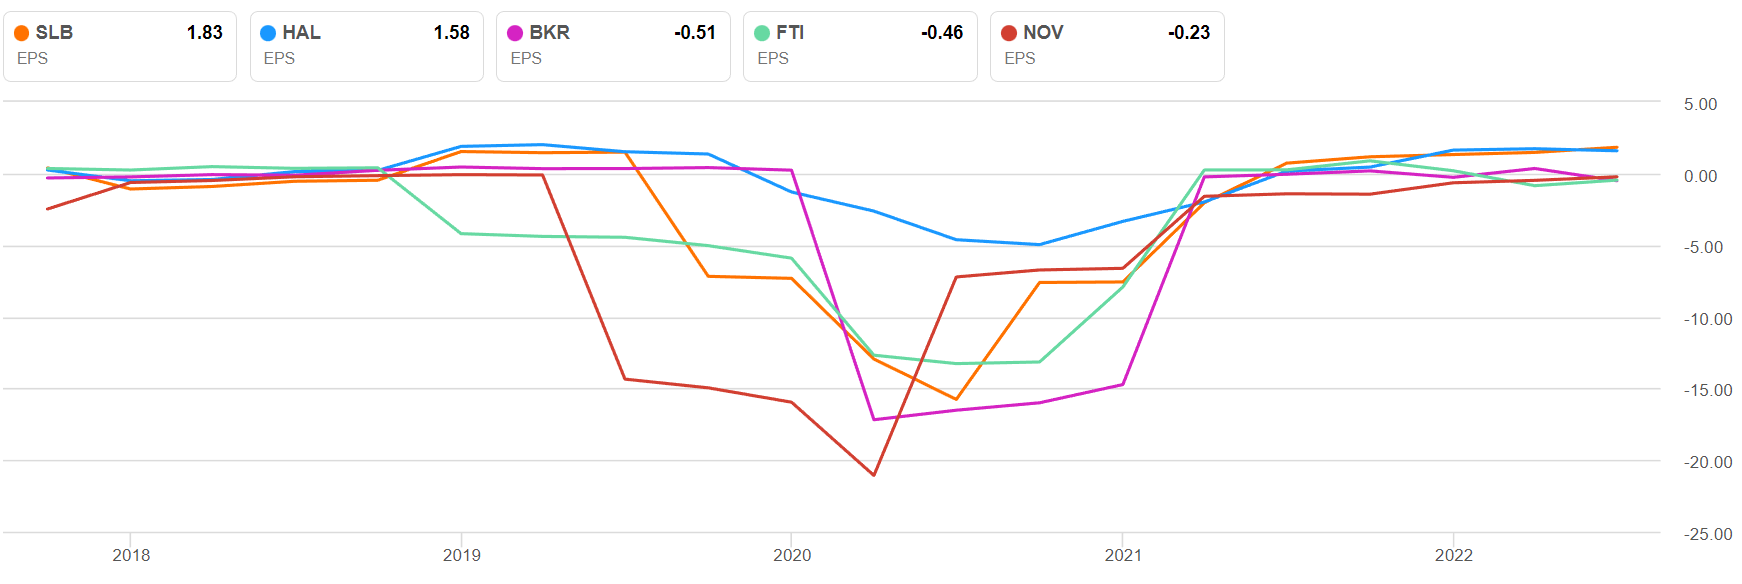
The EPS data shown is for the top 5 holdings of OIH – Schlumberger (SLB), Halliburton (HAL), BKR, TechnipFMC (FTI), and NOV (NOV) – and is generally representative of the OFS holdings of OIH and XES. The large dip in EPS is concurrent with the bottom of drilling activity in mid 2020. As drilling activity has begun to recover, many OFS companies have recently posted their first positive earnings since Q4 2019 while others are approaching profitability. My recent analysis of FTI provides a broader discussion of increased oilfield investment.
A Closer Look at OIH and VDE
Although OIH and XES are each 100% oilfield services, their top ten holdings and weights of those holdings are very different.
|
OIH Top 10 Holdings – 72% |
XES Top 10 Holdings – 48% |
||
|
SLB |
19.25% | FTI | 6.13% |
| HAL | 11.13% | SLCA | 5.27% |
| BKR | 6.67% | NOV | 4.93% |
| FTI | 6.26% | CHX | 4.91% |
| NOV | 5.62% | VAL | 4.67% |
| TS | 5.22% | HP | 4.66% |
| CHX | 5.13% | NE | 4.66% |
| HP | 4.67% | LBRT | 4.59% |
| PTEN | 4.41% | WHD | 4.56% |
| WHD | 4.33% | PTEN | 4.39% |
OIH’s top ten holdings account for 72% of total holdings and are led by the three largest OFS companies in the world by market cap: SLB at 19.25%, HAL at 11.13%, and BKR at 6.67%. XES’s top ten holdings account for 48% of total holdings and are led by smaller OFS companies by market cap: FTI at 6.13%, SLCA at 5.27%, and NOV at 4.93%.
OIH and XES: All Holdings by Weight
Chart by Author, BOA Data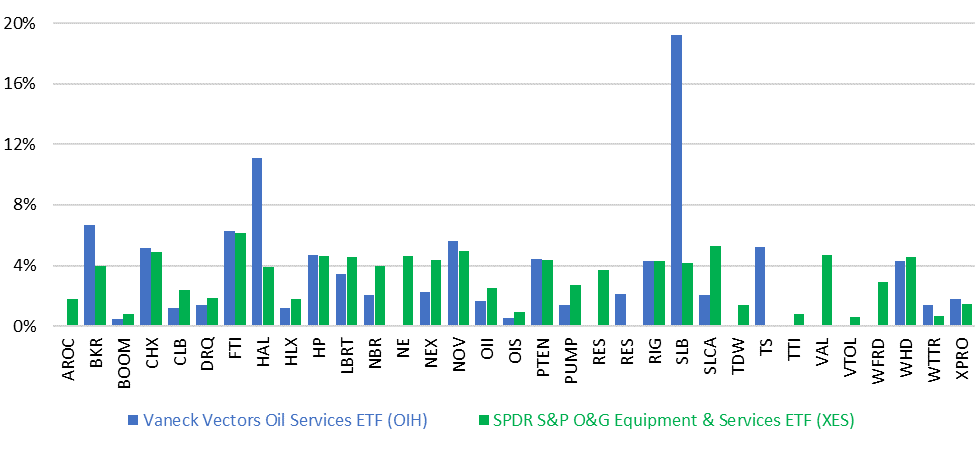
OIH’s top heavy holdings (SLB at 19.25%, HAL at 11.13%, and BKR at 6.67%) are readily apparent when plotted with all holdings of OIH and XES. XES’s holding distribution is nearly the opposite: the majority of holdings are approaching equal weight at around 5%, with a few smaller holdings at less than 2%.
OIH and XES: Market Cap of Holdings by Weight
Chart by Author, BOA Data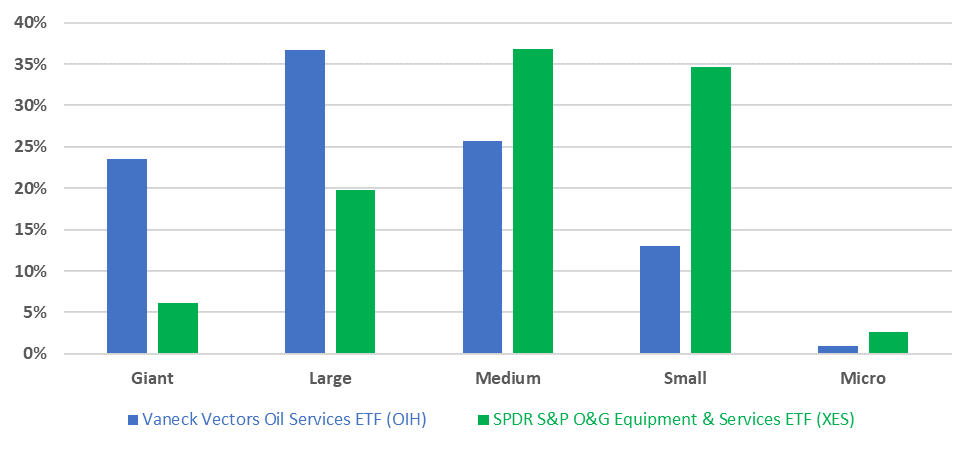
With relation to market cap distribution, OIH is weighted further toward giant and large caps, while XES is weighted toward medium and small caps with almost 3 times OIH’s exposure to micro-caps.
Risks
Reducing carbon emissions is a growing initiative globally. Governments might subsidize renewable energy while discouraging oil and gas. Recently, state efforts to sue oil and gas companies for damages have moved forward in federal court.
The current up-cycle in oilfield services began with the dramatic pandemic induced dip in April 2020, and it’s uncertain if the peak has been reached or how long oil and gas prices will remain elevated. Demand destruction and recession are both risks across the entire oil and gas sector. Oil and gas markets are volatile and subject to fear and speculation. Recession, or even continued fear of recession, could drive energy markets down.
Although OIH and VDE are well-diversified within the oilfield services, the industry is a very small niche within a cyclical sector. Asymmetric alpha is possible, but investors would be wise to invest in OIH or VDE as a proportional component of a well-built portfolio.
Conclusion
The renewable energy transition is not likely to destroy demand for oil and gas within the next 5 years. I would direct those most interested in the renewable energy boogie monster to my recent coverage of VDE and the renewable energy transition. I am convinced that oil and gas will remain essential components of global energy over the next several years.
Oil and gas markets are currently elevated with tight supply and nearly limitless uncertainty. U.S. production and exports of natural gas are at record highs while Europe struggles to import enough gas to replace Russian supply. Drilling activity indicates renewed oilfield investment by energy producers.
U.S. production of oil and natural gas is heavily weighted toward tight reservoirs with sharp production declines from initial rates. These tight reservoirs contain massive proven reserves, but, quite simply, they don’t stay drilled. Currently, 756 rigs are working to ensure sufficient supplies of oil and gas and that job will never be finished. Metaphorically, maintaining production in tight reservoirs is more like mowing the lawn than planting a tree. The job must be repeated on a regular schedule and growing revenue for the OFS companies that make up OIH and XES is nearly certain.
The latest monthly rig count of 756 in the U.S. and 1,019 international rigs demonstrates a robust recovery from the November 2020 low point of 310 U.S. rigs and 764 international rigs. OFS earnings have already responded favorably and I expect oilfield activity to continue to increase, providing growing revenues for OFS, and driving price return for OIH and XES.
OIH and XES are each 100% oilfield services, but their holdings and the weights of those holdings are very different. A methodical investor might wish to carefully choose between OIH or XES while managing the exposure and diversity of an individual portfolio. You may already hold a substantial position in one of OIH’s heavily weighted positions. Likewise, you may already own several of XES’s small caps.
I recommend that investors buy OIH and/or XES at current market prices. Both funds are a targeted investment in oilfield services backed by global energy demand and the need for continuous oilfield investment.
Be the first to comment