

ArLawKa AungTun
Thesis
Berkshire Hathaway’s (BRK.B) latest 13F filing shows that Warren Buffett kept accumulating shares of Occidental Petroleum (NYSE:OXY) shares. As you can see from the following chart, since Q1 2022, Warren Buffett has accumulated a huge position in OXY in a price range between ~$55 to ~$62. To wit, the BRK equity portfolio now holds a total of 194M OXY shares, with the bulk of them accumulated during Q1 to Q3 of 2022 in this price range.
Source: Dataroma.com Source: Yahoo! data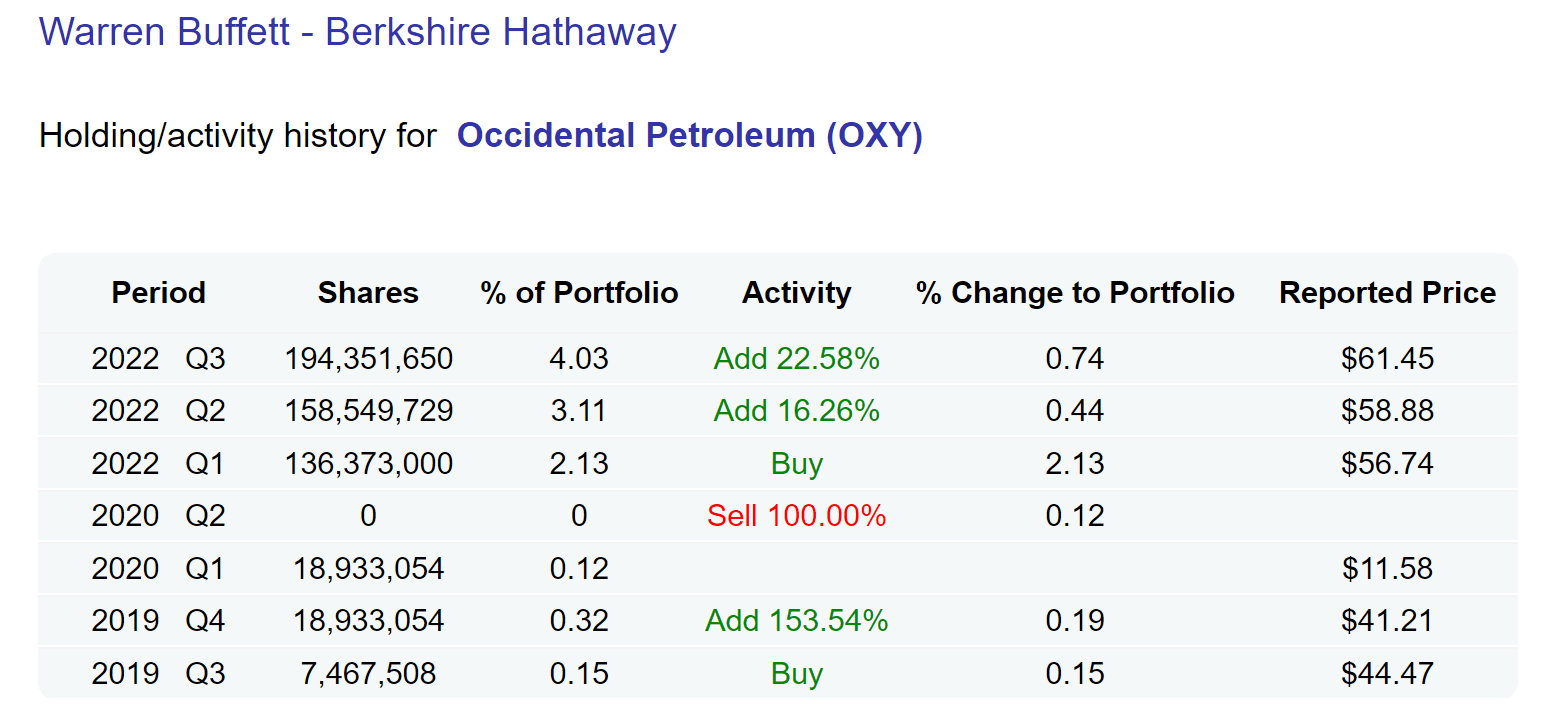
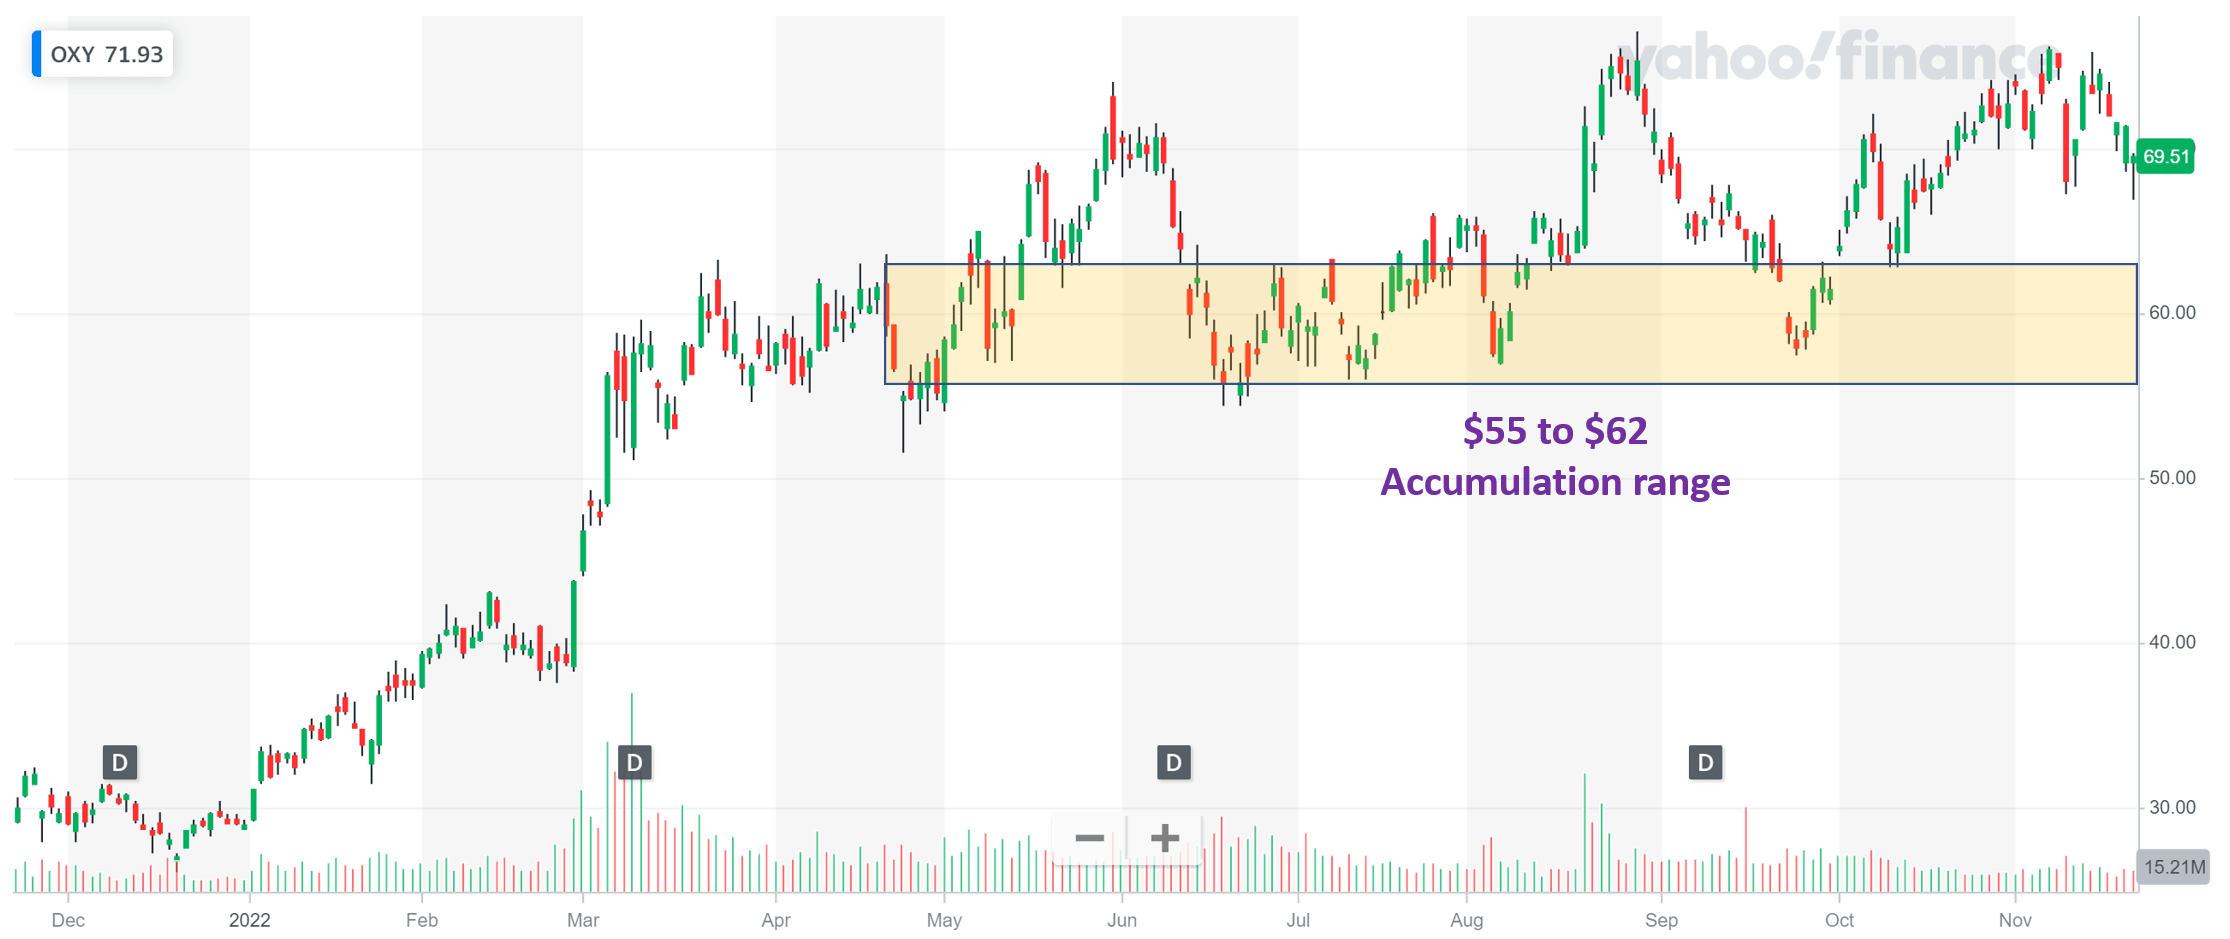
The stock price currently hovers around $70, about 15% above the mid-point of this range. However, given the historical volatilities in the stock, I see a good chance for its prices to revisit this range. And in this article, I will detail my thoughts on these trigger points so potential investors can better prepare if the price indeed revisits this range. In a nutshell, I see this range as a favorable setup for both long-term investors (there is a good reason why Buffett kept buying in this range) and also short-term swing traders.
For swing trading, business fundamentals and valuation metrics are not that meaningful and even be misleading, especially due to the extreme volatility in commodity prices. For highly cyclical stocks, peak valuation can occur at the bottom of their business fundamentals. And vice versa. Thus, short-term price movements are largely dominated by trading activities as shown in the chart below. OYX’s stock price is 8.4% off its recent peak. And if the price gets to a $55 level, it would translate into a correction of 22%, the deepest level in its recent trading history.
The remainder of this article will focus more on the implications of these trigger points for long-term holders. As you will see, a price range of $55 to $62 would translate into an FW EV/EBITDA of only 3.4x to 3.8x for the stock, and you will also see why EV/EBITDA multiples offer very favorable risk/return profiles for the long run.
Source: Author based on Seeking Alpha data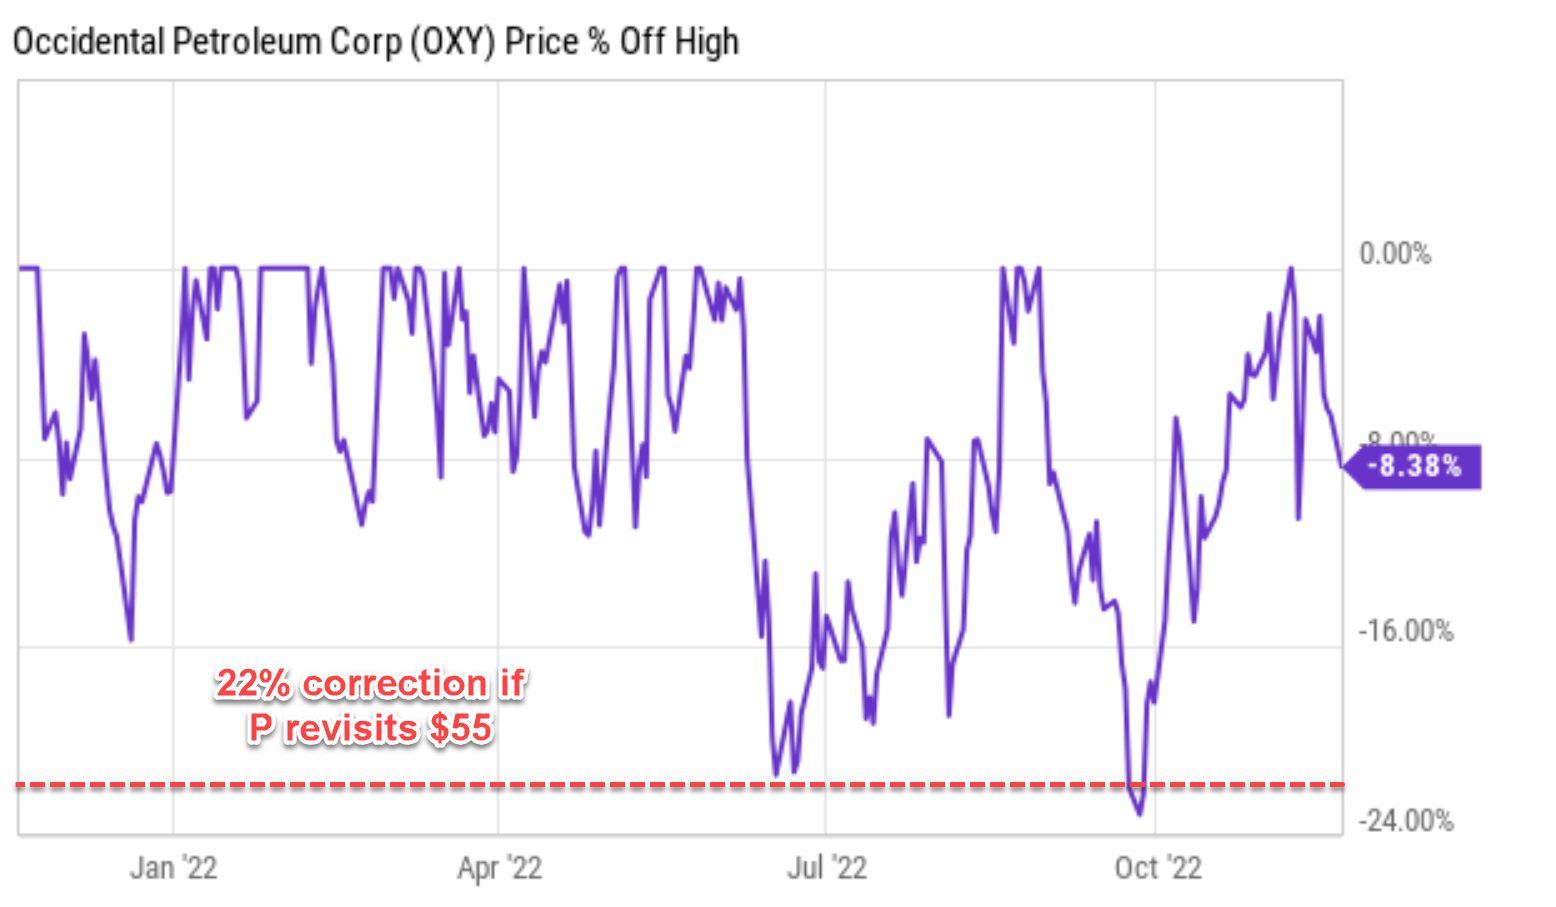
OXY’s long-term growth rekindled
Thanks to its robust cash flow in recent quarters, OXY now enjoys superb capital allocation flexibility. And it has resumed its CAPEX reinvesting aggressively to fuel future growth as you can see from the following chart. To wit, its CAPEX expenditures used to be on the $2B level back in ~2014. Then it plummeted and stayed in the $800 level for years due to compressed oil prices, suffering underinvestment for years. Now, since oil prices bottomed in 2020 following the COVID pandemic, its profitability recovered, and it has the ability to resume reinvestment. And as seen, its CPAEX expenditures have been recovering quickly to the current level of over $1B.
Source: Author based on Seeking Alpha data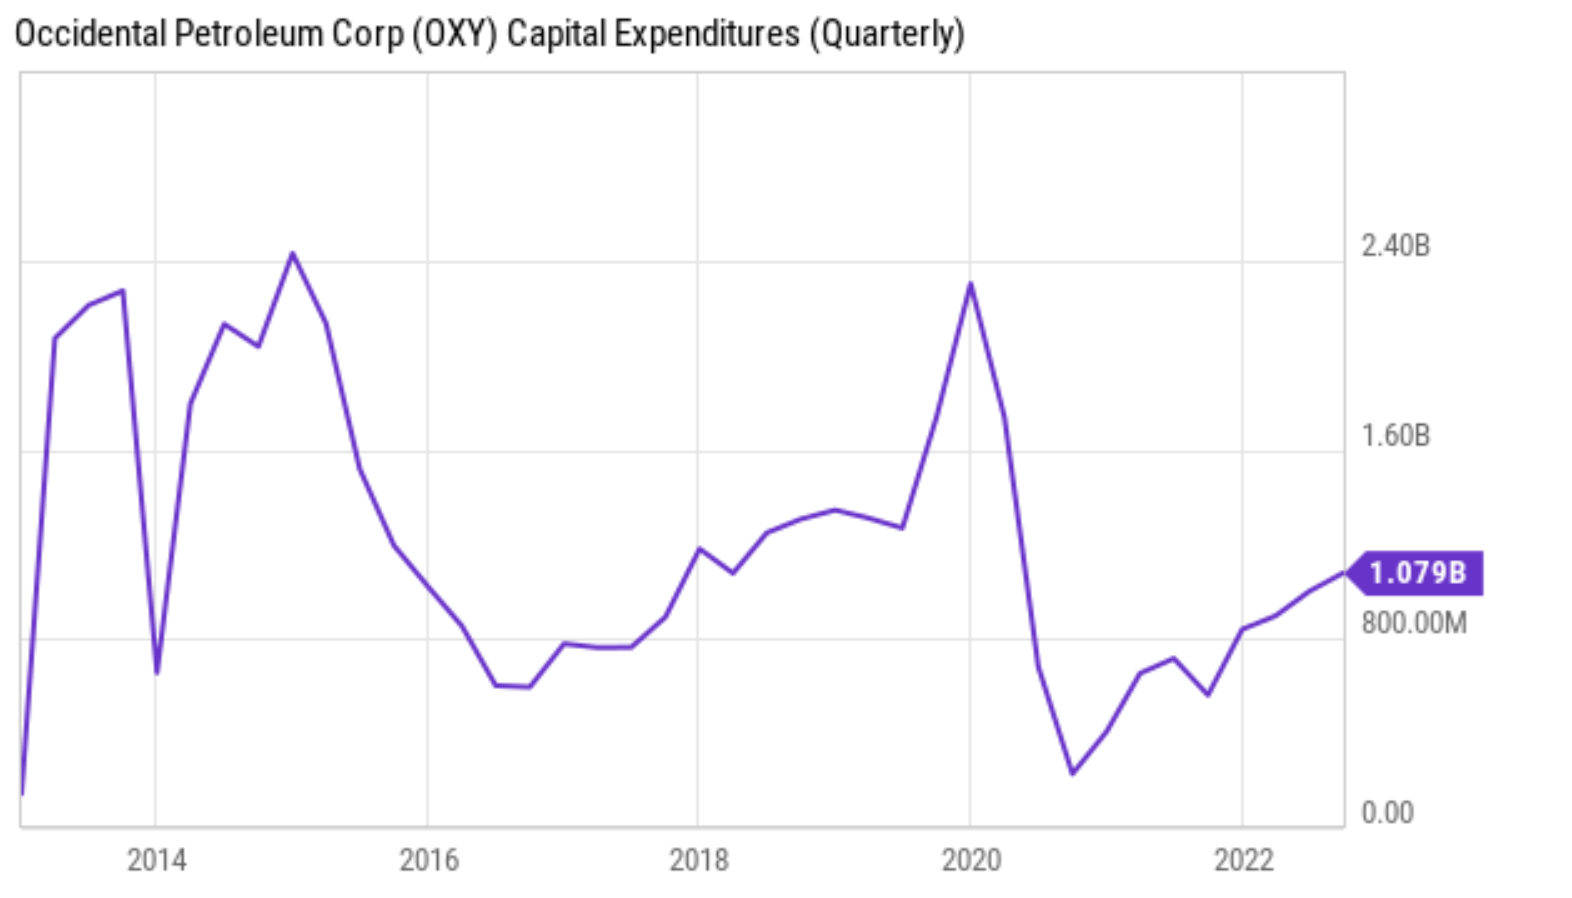
Behind the recovery of its CAPEX investment is of course its profitability. As measured by its return on capital employed (ROCE, detailed in our earlier writings), its ROCE now stands at 25.2% based on its Q3 TTM financials, the peak value in years. Its current ROCE is not only far above its historical average of 11.9% but also far above the average of the energy sector (approximated by XLE, which is ~14.1%).
Source: Author based on Seeking Alpha data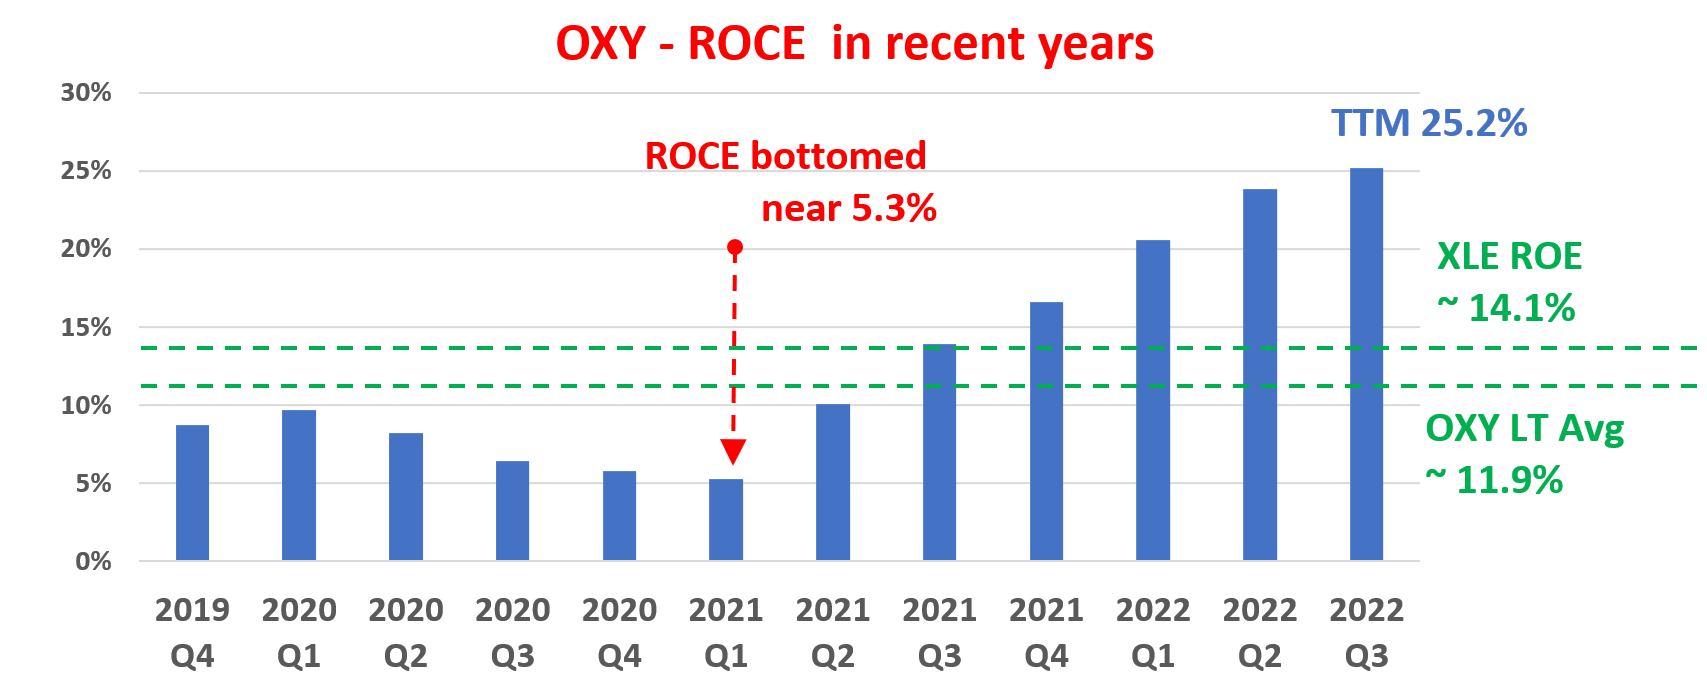
There are certainly near-term uncertainties
There are certainly headwinds in the near term (that is why I have good confidence in the odds of its price fluctuating and possibly revisiting the accumulation range). After all of its deleveraging recently, OXY still depends on leveraging to a great extent and thus can be sensitive to interest rate hikes. At the same time, I see oil prices to keep fluctuating in a wild range given the ongoing geopolitical risks in the Russian/Ukraine area.
These uncertainties are reflected in the large variance in the consensus estimates as you can see from the chart below. A total of 19 analysts submitted earnings revisions for OXY in the past 3 months. And a total of 13 of them revised the earnings downward and 6 upward. Moreover, there is extreme variance in the revised EPS estimates too. As seen, for the next year, the higher end of the consensus EPS is $10.59, almost a 200% variance compared to the lower-end estimate of $5.23. The variance is even larger for 2024 around almost 300%.
Source: Author based on Seeking Alpha data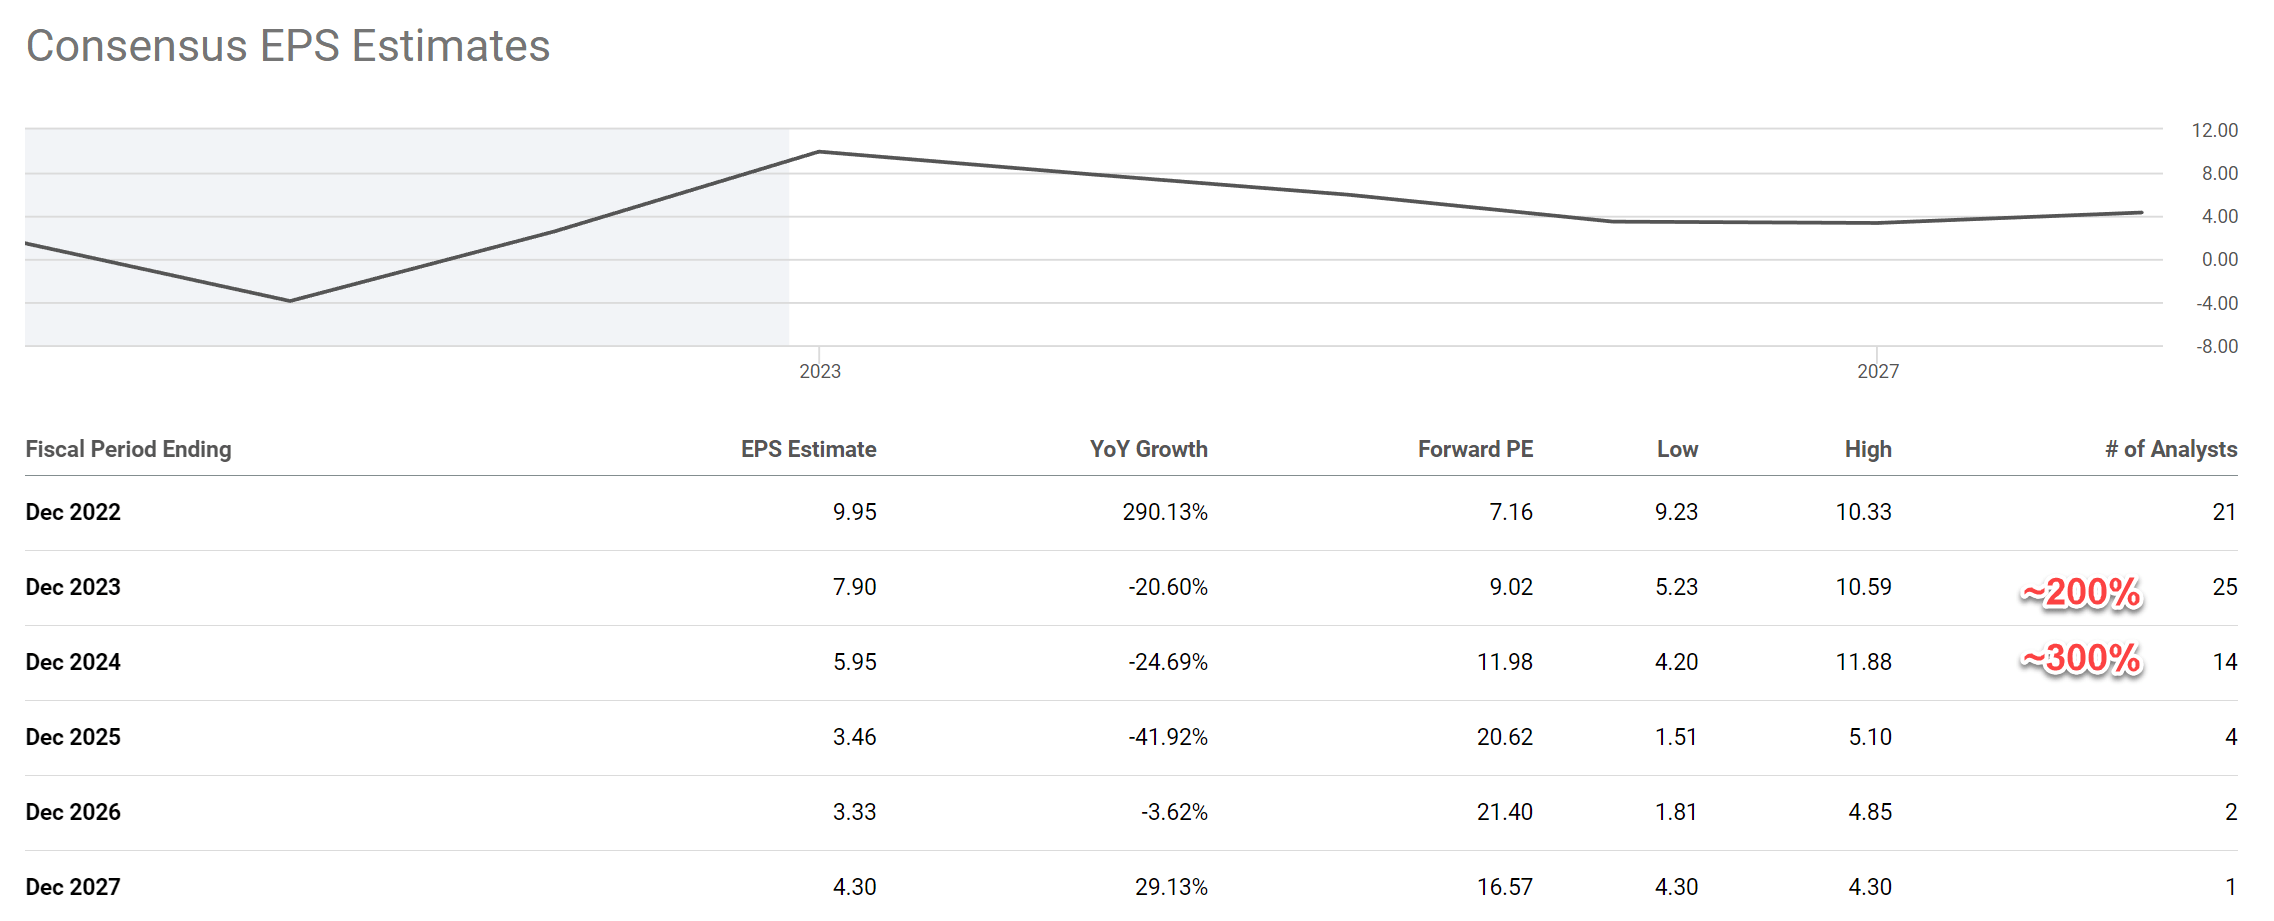
The $55~62 accumulation range again
However, at an overall level, I disagree with the general trend of the consensus estimates. As seen from the chart above, consensus estimates foresee a declining trend (from $9.95 EPS this year to $4.3 in 2027). I see growth in contrast in the 4%~5% considering its recovered reinvestment rate as aforementioned and also its reasonable long-term ROCE. A 10% reinvestment rate combined with a 20% average ROCE could drive 2% real growth sustainably (10% reinvestment rate * 20% ROCE = 2%). Considering that oil prices have been rising faster than inflation in the long term, adding a conservative escalator of 2.5% would lead to a 4.5% annual growth rate.
Yet, the valuation of the stock is extremely compressed as you can see from the two charts below. The first chart shows that in terms of EV/EBITDA multiple, it is trading at 4.2x only, near a secular bottom. And the second charts show that in terms of P/CFO (cash from operations), it is trading only at 4.2x too.
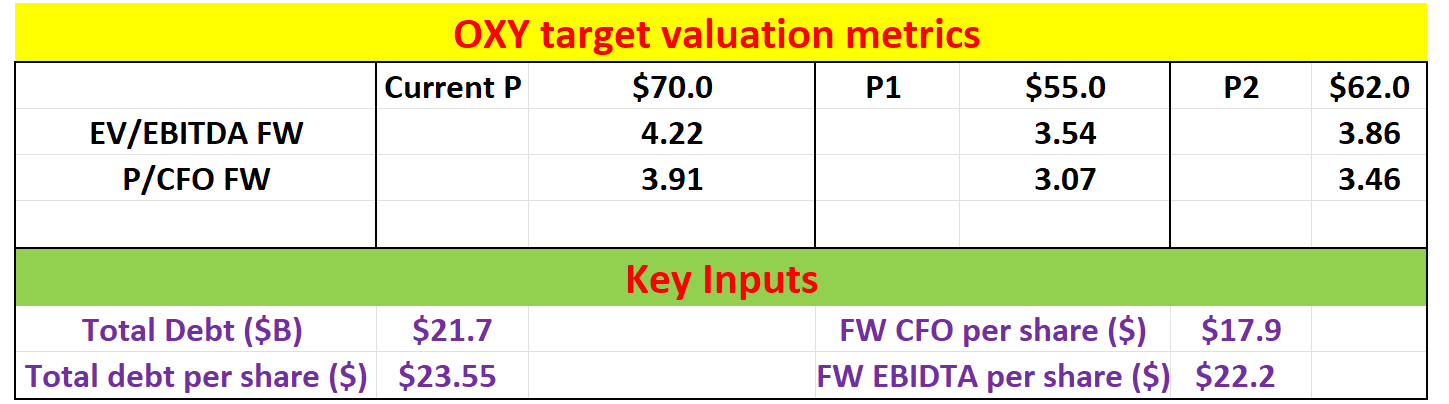
The valuation multiples in my target price range are displayed in the second table below. These analyses were performed using financial data provided by Seeking Alpha (and summarized in the bottom part of the table). As you can see, at $55, the lower bound of the target range, the EV/EBITDA multiple would be only 3.54x. And at $62, the higher bound of the target range, the EV/EBITDA multiple would be only 3.86x. And remember the lowest EV/EBITDA multiple has been 3.87x. Thus, any entry point within this range leaves plenty of margin of safety.
Source: Author based on Seeking Alpha data Source: Author based on Seeking Alpha data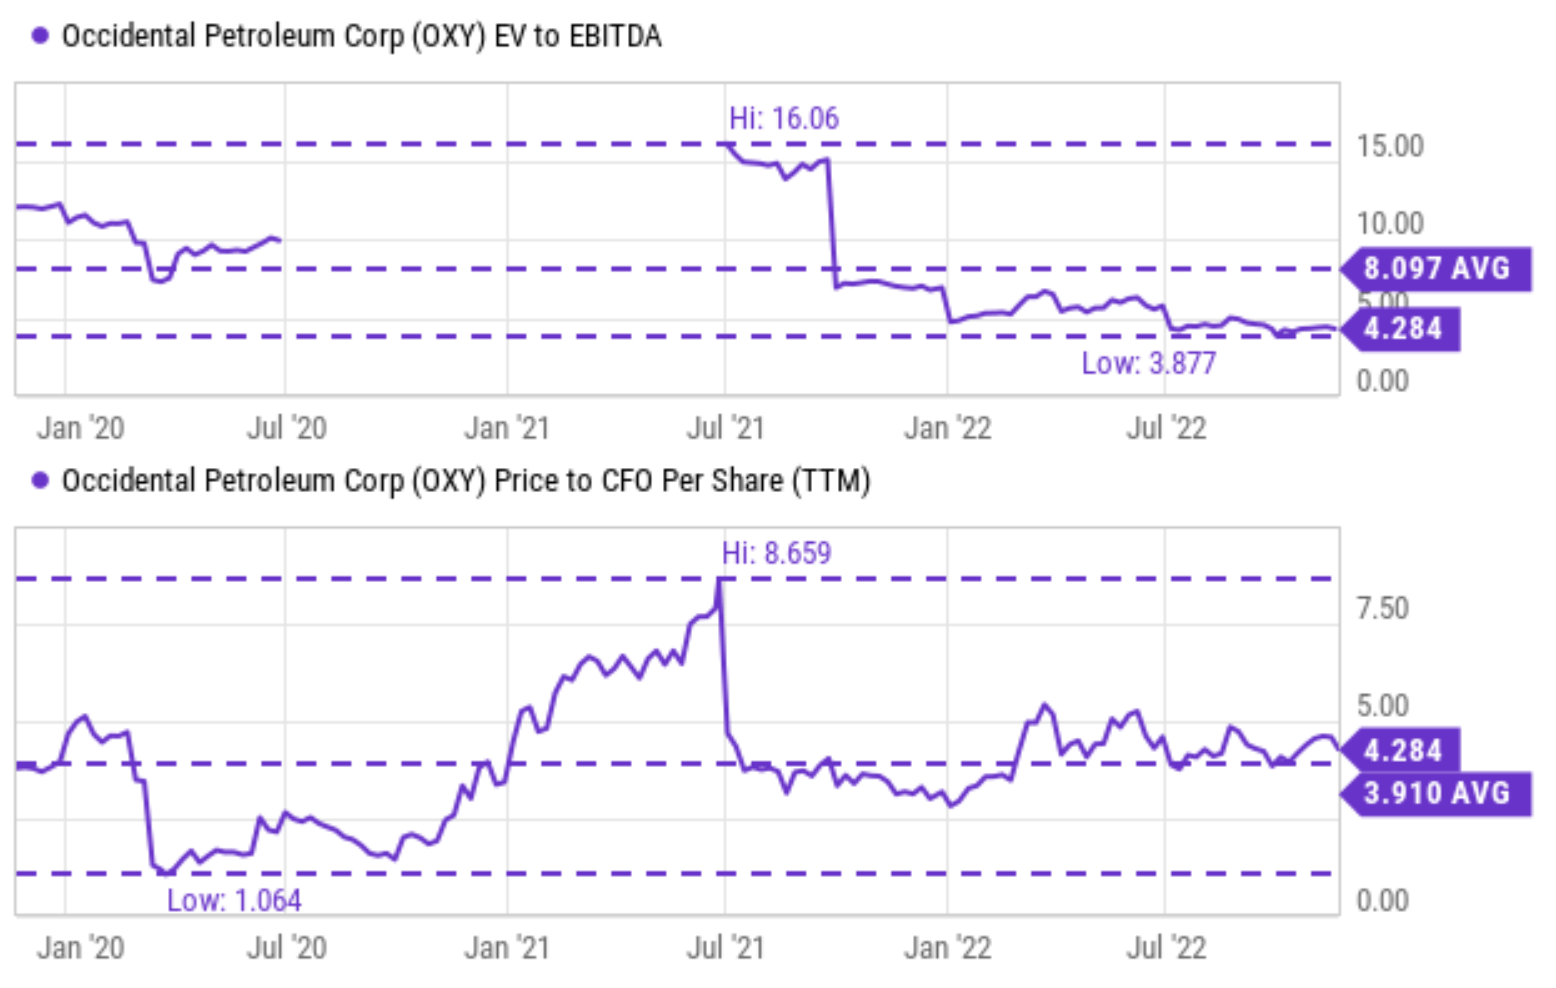
Risks and final thoughts
To reiterate, there is no shortage of uncertainties on the horizon for OXY (and other oil stocks too). I have no doubt that oil prices would keep demonstrating high volatility in the near future due to a wide range of uncertainties, with the Russian/Ukraine war being the leading factor. And specifically for OXY, it is still more leveraged than other major oil stocks such as CVX and XOM, and therefore it can be more sensitive to interest rate hikes. These risks are probably best reflected in the large variance in the consensus estimates. The variances are in the 200% to 300% range between the higher- and lower-end estimates even for the next 2 years.
However, it is precisely such short-term uncertainties that give me the confidence that its stock prices have a good chance to revisit the $55 to $62 range. And the thesis of this article is to argue that such a range, if indeed revisited, would present a good setup for both short-term swing trading and long-term holding. This price range translates into an FW EV/EBITDA of only 3.4x to 3.8x, below its secular bottom level and thus offering a large margin of safety.
Be the first to comment