

imaginima
Thesis
It is public information that Warren Buffett placed heavy bets on oil companies recently. Recent Berkshire disclosures showed that Warren Buffett increased positions in Occidental Petroleum (NYSE:OXY). All told, Buffett now owns a total of 175 million OXY shares, translating into a stake of about 18.6% in the business according to a filing. Besides OXY, he has also accumulated a sizable position in Chevron (CVX), now the 4th largest position in the Berkshire equity portfolio.
Analyzing highly cyclical stocks like OXY can be tricky, and common metrics are not only limiting but can also be misleading. Take dividend yield as an example. As you can see from the top panel of the following chart, the dividend yield for OXY has fluctuated in an extremely wide range. Its dividend yield has fluctuated in the past decade between as low as 0.07% and as high as 32.5%. The average is 4.62% but is really meaningless given the range of variance.
Therefore, its current dividend yield, although attractive in absolute terms, is actually below its historical average by 16%. In contrast, WBA’s dividend yield fluctuated in the past five years between 1.84% and 5.49% with an average of 3.31%. Therefore, its current 4.67% dividend yield is above its historical average by a whopping 41%. Its current yield of 0.49% is also near a historical low. As you will see later, its balance sheet is also quite stretched. So why should Buffett (or you) bet so heavily on it at such a time?
For highly cyclical stocks, the trick is to look past the earnings in any single year. Instead, investors should look at several key financials holistically over the span of a few years. For further illustration, this article will compare OXY to a more stable stock, Enterprise Products (NYSE:EPD), as you can tell from its dividend yields in the bottom panel of the following chart. As you will see once the financials are considered holistically, OXY is quite attractive all around (and so is EPD) in terms of safety, valuation, and profitability.
Seeking Alpha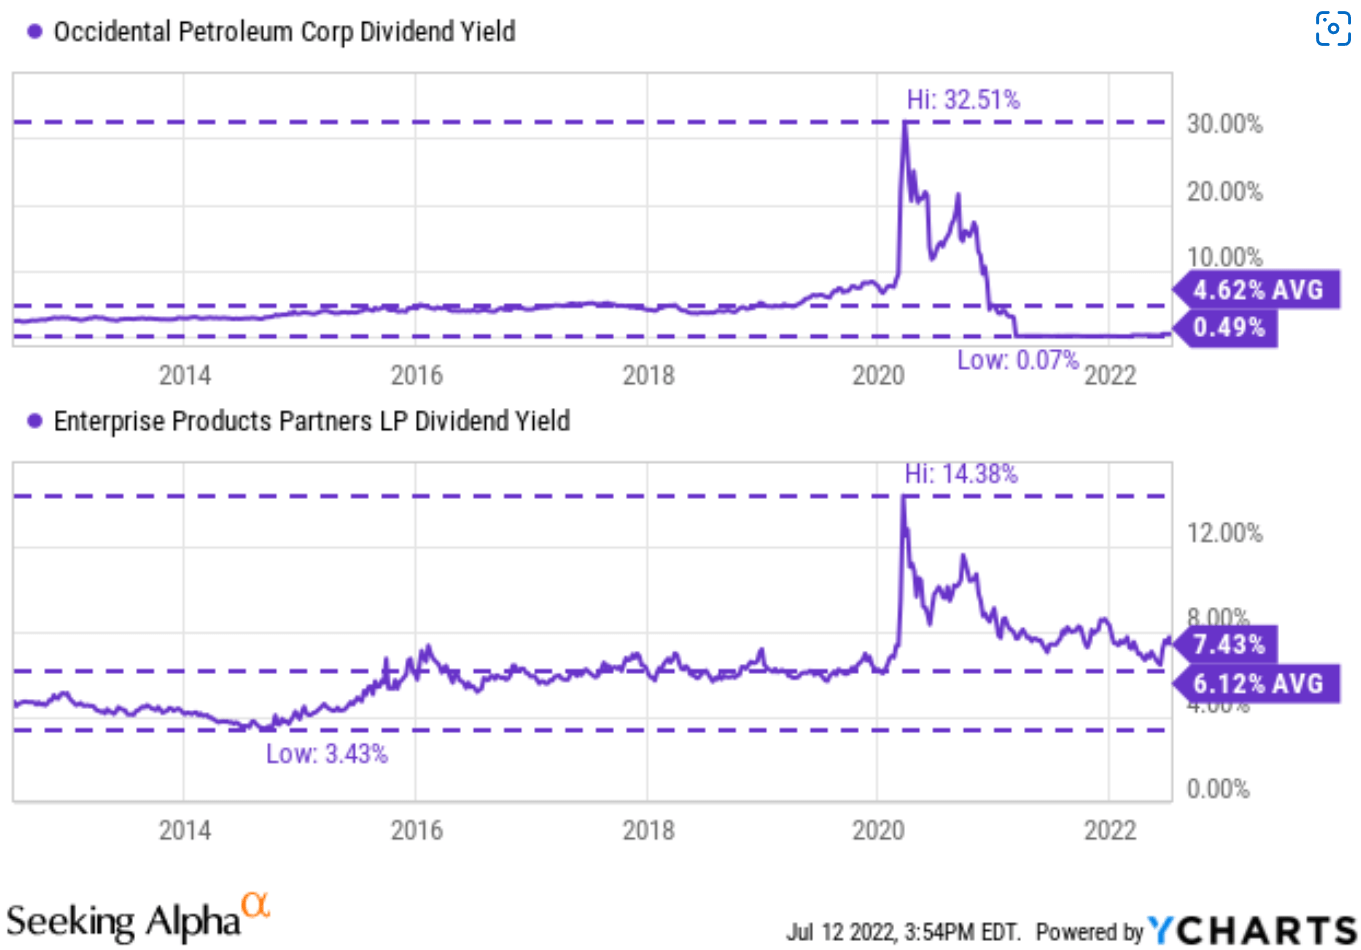
EPD and OXY: what’s comparable and what’s not
Besides being in the general energy sector, their businesses overlap substantially at a specific level. Both have a substantial operation in midstream services, natural gas liquids, petrochemicals, and also the transportation of natural gas through pipelines. However, there are also key differences.
The first key difference involves geographical exposure. OXY, together with its subsidiaries, is exposed more globally. It has business operations and also owns gas properties in the United States, the Middle East, Africa, and Latin America. EPD in comparison is more of a pure North American player, with assets and services primarily in the U.S. and Canada.
The second key difference is that OXY is more integrated than EPD (on a relative scale between themselves). Besides the common business segments mentioned above, OXY also explores and owns a substantial amount of oil and natural gas reserves. Its proven reserves include 1.77 billion barrels of oil and 5.85 billion cubic feet of natural gas.
These differences definitely should be part of your investment consideration and be tailored to fit your goal of risk control and geographic diversification. This article will mostly focus on their financials and profitability only, which are very comparable.
Financial safety and dividend safety
A key concern for many OXY investors is its financial safety, for good reasons. Before looking at OXY, let’s first look at EPD to set a baseline (again, because EPD is more stable). As you can see from the top panel in the chart below, the leverage ratio for EPD has been quite consistent over the years. Its debt to EBITDA ratio has fluctuated in a relatively narrow range between about 3.4x to 4.5x with an average of 3.8x in the past 10 years. And its current leverage ratio of 3.6 is not only below average, but also close to the lower level in a decade.
Seeking Alpha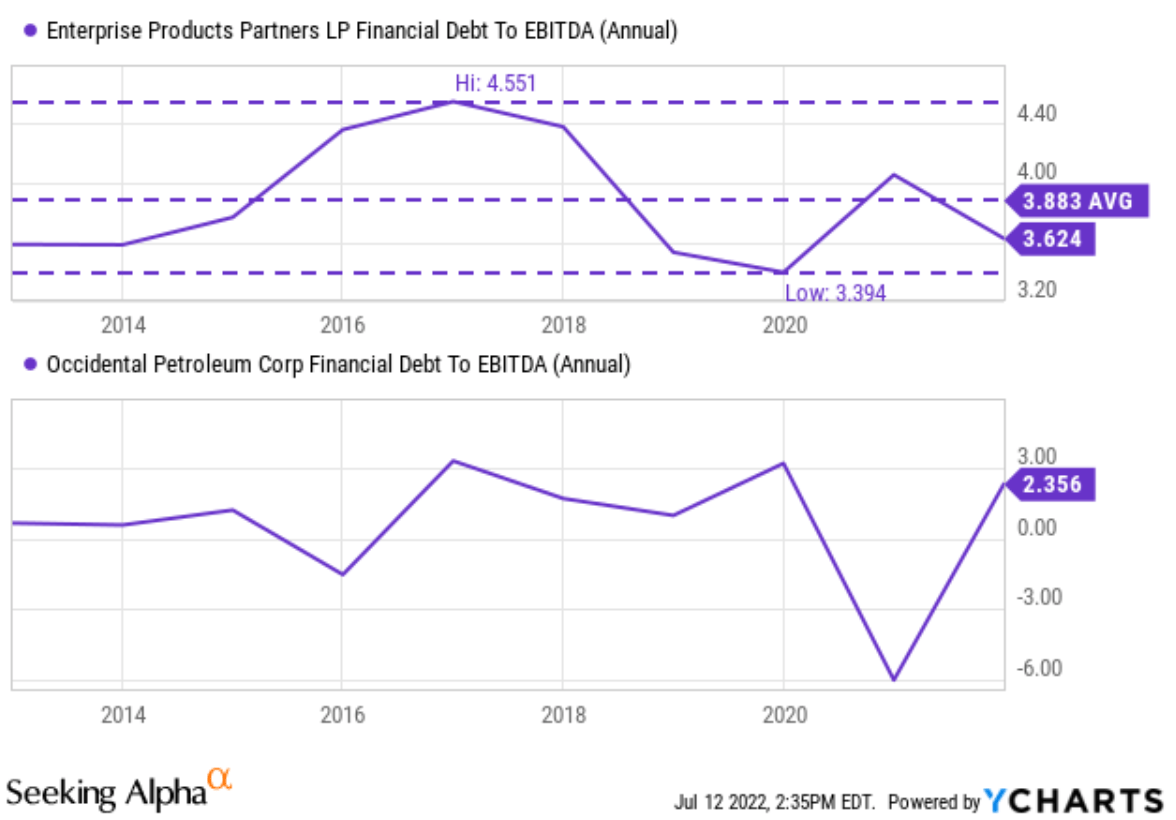
With this baseline, you can see why OXY’s picture is so much more concerning. Again, its leverage ratio fluctuated in such a wide range to render any average meaningless. Furth more, its current leverage ratio of 2.35x is near the highest level in a decade. It is still in the process of digesting its large debt burden (almost $45 billion) from its Anadarko purchase back in 2019. It has been consistently reducing its debt since then, but long-term debt still stands at $25.8B. Management is aware of the issue and has been working hard to get its financial house in order. The goal is to reduce debt to $20B before it considers share repurchase, as its CEO Vicki Hollub commented (abridged and emphases added by me)
As we will detail in a few minutes, we made meaningful progress towards our near-term goal of retiring $5 billion of debt. We remain focused on reducing debt this year as we advance our shareholder return framework. We repaid over $3.6 billion of debt as a part of the near-term goals we announced last quarter to repay an additional $5 billion of principal and lower net debt to $20 billion. Once the $5 billion target has been achieved, our focus will expand to the $3 billion share repurchase program.
Many of us are drawn to energy (or midstream) stocks particularly by their dividends. As you can see from the following comparison, OXY’s pictures are so irregular to be of any guidance. Again, it is helpful to first look at the EPD picture to form a baseline. Take payout ratios as an example, EPD has been again quite stable and fluctuated in a relatively narrow range between about 85% and 131% with an average of 101%. Do not be alarmed by the fact that the number is close to or above 100%. EPD is a partnership and pays out most of its earnings as dividends. In contrast, OXY’s payout ratios fluctuated between negative 400% to positive 358%.
Seeking Alpha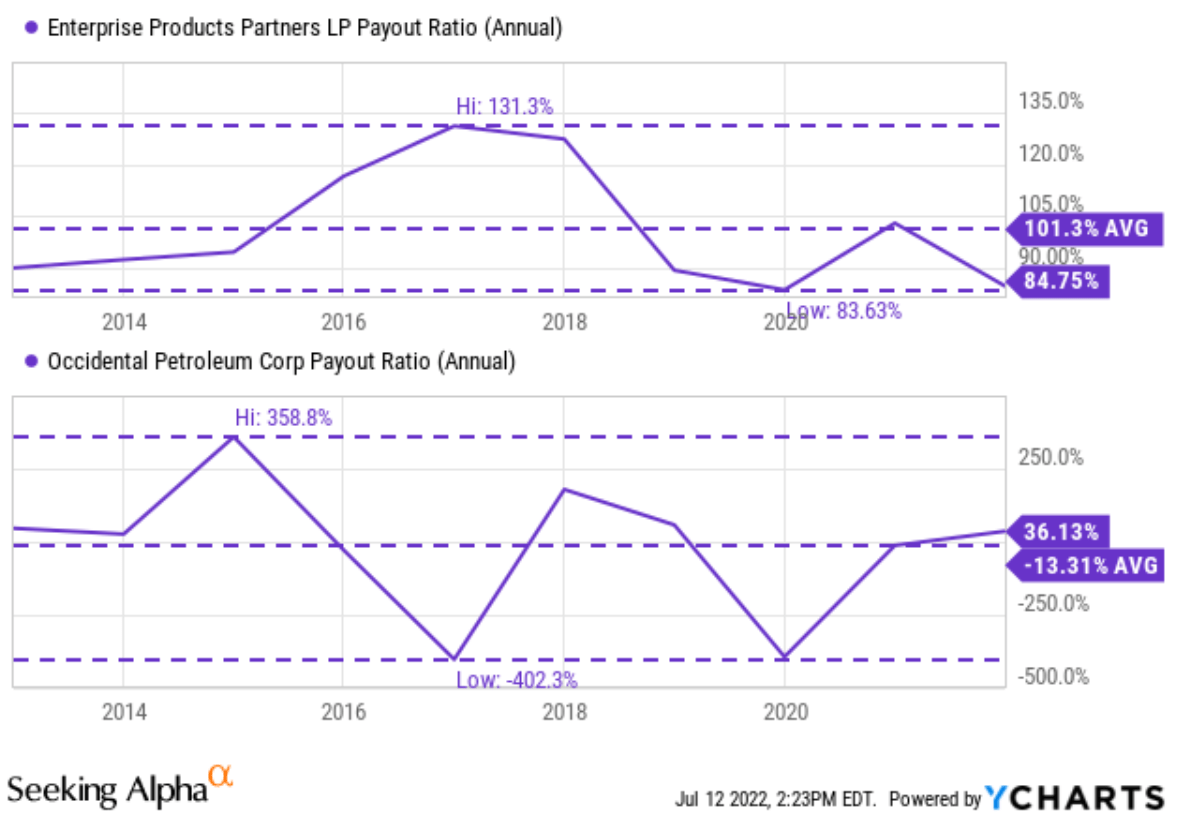
Dividend cushion ratios
As aforementioned, to analyze highly cyclical stocks like OXY, the trick is to look past the earnings in any single year. Because of the cyclicality, the metrics will fluctuate in extreme ranges and render no pattern at all as seen above. And the pattern begins to emerge once we look at the key financials holistically over the span of a few years.
An effective way of such holistic consideration is through the dividend cushion ratio. The method has been detailed in our earlier article here and also in Brian M Nelson’s book entitled Value Trap. A summary is quoted below:
The Dividend Cushion measure is a ratio that sums the existing net cash (total cash less total long-term debt) a company has on hand (on its balance sheet) plus its expected future free cash flows (cash from operations less all capital expenditures) over the next five years and divides that sum by future expected cash dividends (including expected growth in them, where applicable) over the same time period. If the ratio is significantly above 1, the company generally has sufficient financial capacity to pay out its expected future dividends, by our estimates. The higher the ratio, the better, all else equal.
We made one revision to the above method here. Instead of subtracting the total long-term debt, we subtracted the total interest expenses over a past five-year period. This revision is to adjust for the status of businesses like EPD and OXY. Such mature businesses probably will never have the need to repay all the debt at once. But it does need to service its debt.
With this background, the dividend cushion ratios for OXY and EPD are calculated and shown below. As can be seen, both have always been maintaining a positive dividend cushion ratio since 2016. Although the ratios for both are below 1x. And a cushion of 1x is the threshold considered to be safe and 2x excellent. A cushion of 2x approximately means a business can comfortably cover its dividends even if it suffers earning difficulties for about 2 years in a row. OXY’s cushion was about 0.5x and EPD almost zero in 2016. Then EPD has been steadily improving its dividend cushion since then to the current level of 1.46x, a very healthy level.
While OXY’s cushion kept deteriorating and reached a bottom of 0.33x in 2019 following its Anadarko acquisition. Since then, it had to cut its dividend almost by half in 2020 and to a token of 1 cent in 2021. I hope this example illustrates the insights provided when we look past short-term noises (and 1 year is considered short-term, let alone quarterly results) and analyze financials holistically.
Fast forward to the present, via a combination of dividend cuts and debt reduction, OXY’s cushion ratio has kept climbing since 2019. It currently stands at 2.93x, which gives the management the confidence to raise the quarterly dividend to $0.13 a share from the token 1 cent and also to start talking about sizable share repurchase.
Author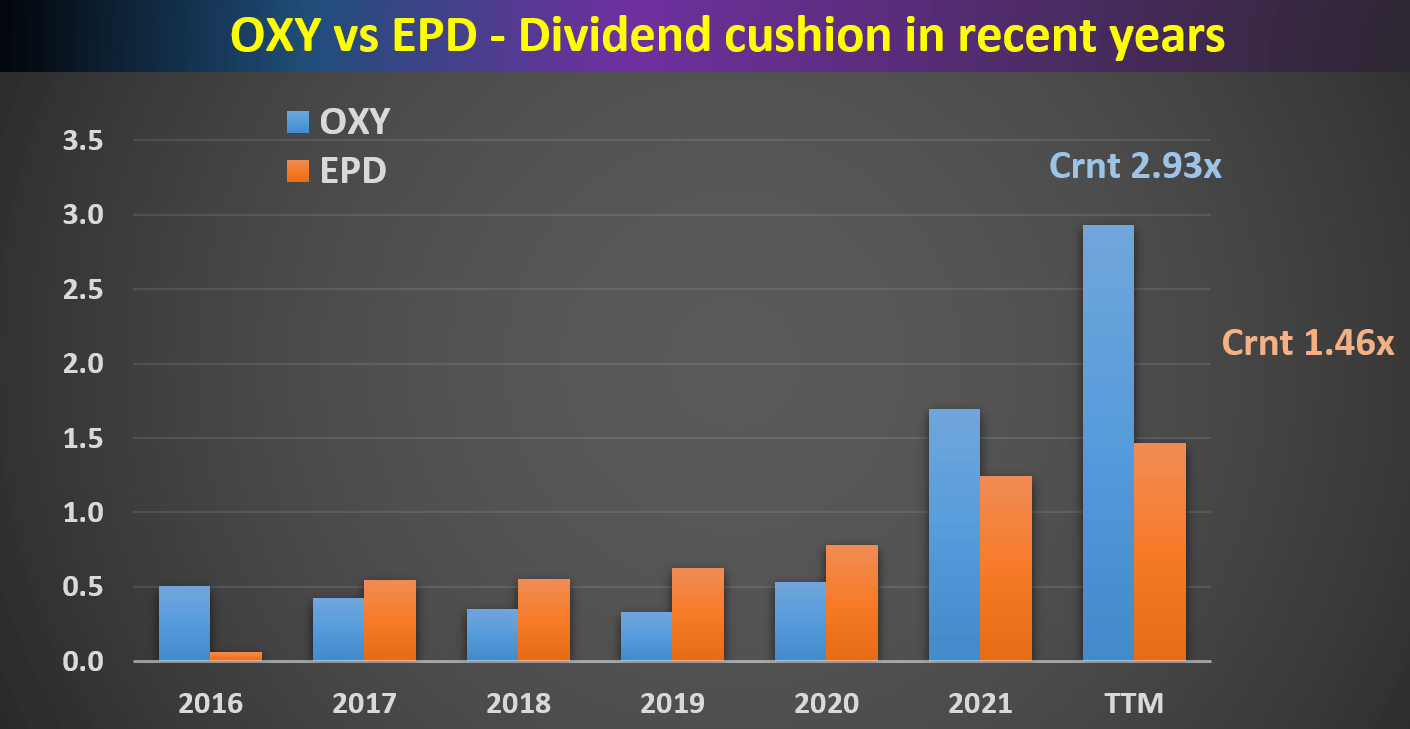
Valuation and profitability
As shown in the chart below, OXY is valued at a dramatic discount relative to EPD. As highlighted in the yellow box, its valuation is discounted by almost ½ in terms of the FY1 PE ratio (5.6x vs 10.1x).
Given both businesses are substantially leveraged, valuation metrics adjusted for leverage are more meaningful. And here is the picture is similar as highlighted in the red box. In terms of EV/EBITDA ratio, OXY is also discounted by more than ½ compared to EPD (4x FW EV/EBITDA multiple vs EPD’s 9.5x).
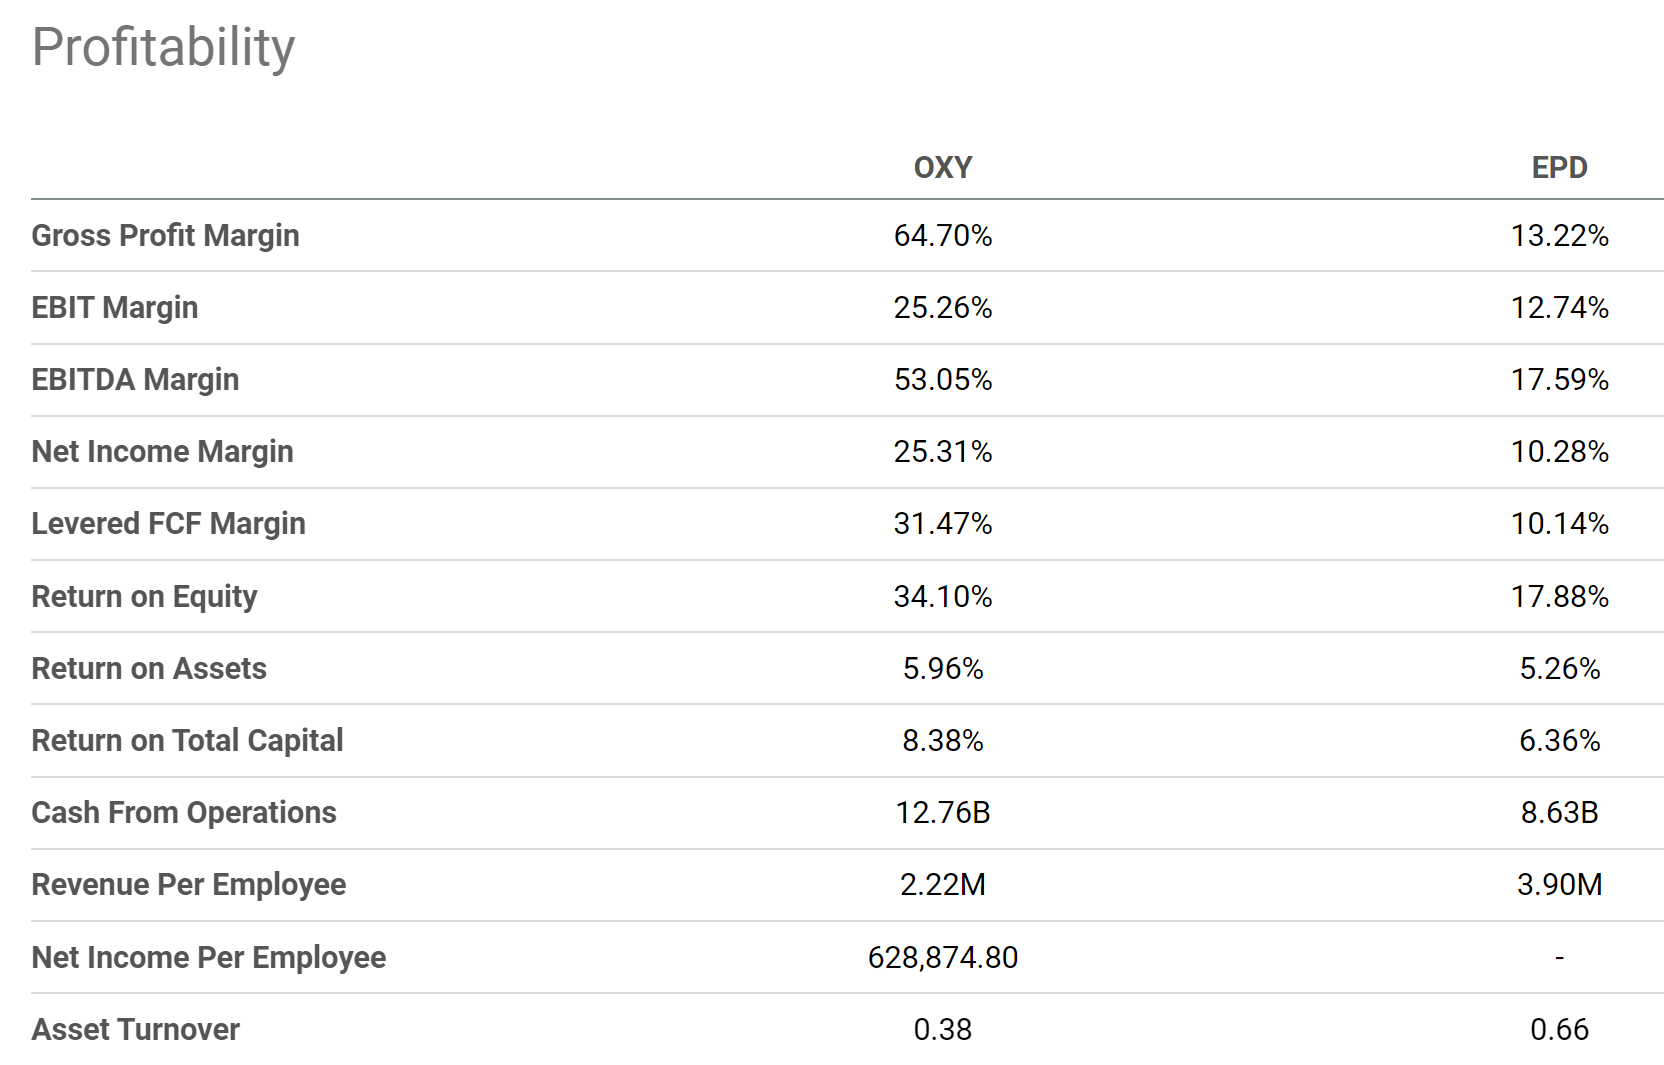
investors should not be alarmed by OXY’s higher EV/sales ratio. as you can see from the next chart, OXY enjoys better margins. And as a result, it is only logical that every dollar of its sales should be more worthy. For example, its EBITDA margin is almost 3x higher than EPD (53% vs 17.6%) and its net margin is about 2.5x higher (25.3% vs 10.1%). So it is totally justifiable for its sales multiples to be 2.5x to 3.0x higher than EPD (and its actual sales multiples are only about 1.5x higher than EPD).
Seeking Alpha Seeking Alpha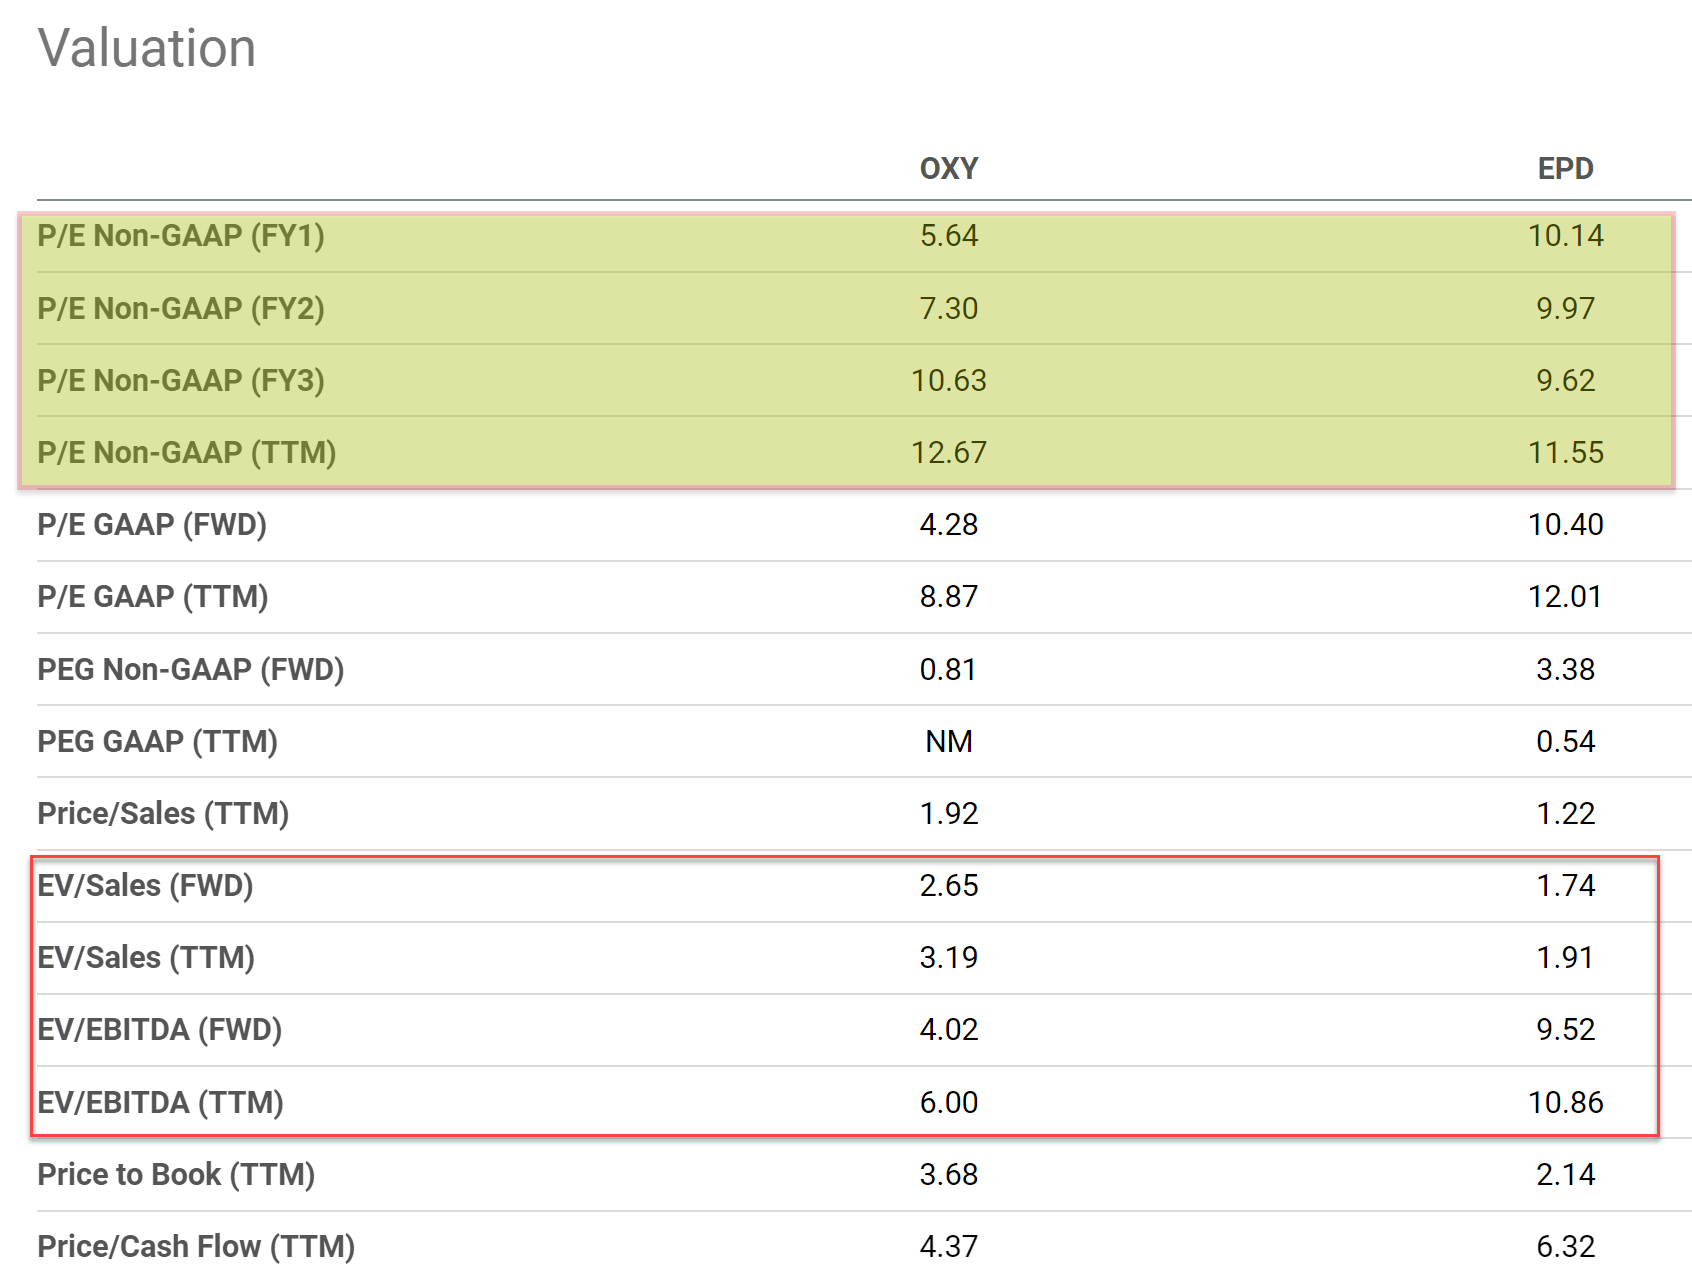
Final thoughts and risks
Highly cyclical stocks like OXY can be difficult to analyze. The fluctuations over any given year (let alone quarter to quarter) can be so extreme as to dominate the real signal. And investors need to look past the noise and analyze key financials holistically. Such a holistic approach reveals the pattern more clearly for OXY (and EPD too). OXY dividend cushion bottomed at 0.33x in 2019, foreshadowing the subsequent dividend cuts.
During the Q&A session of Berkshire’s most recent annual meeting, Warren Buffett cited the purchase of OXY shares and commented that he looks for businesses whose capital return plan is “simple and made sense”. And now with a cushion ratio at an overly safe level of 2.93x, it has indeed become simple for OXY to develop shareholder return plans.
For investors who prefer higher current income and want to avoid the uncertainty of OXY’s dividend raises, EPD is a good choice too. It currently yields 7.43%, not only higher than OXY substantially but also above its own long-term average of 6.1%. EPD’s cushion ratio is also at a record level of 1.46x, above the threshold level of 1x by a good margin.
Finally, risks. Risks specific to EPD have been detailed in my earlier article here. These risks include interest rate risks, energy supply disruptions, and geopolitical conflicts. Many of these risks are shared by OXY too. Specific to OXY, Buffett’s sizable position is both a blessing and a curse. On the good side, it’s never a bad idea to have an endorsement from an independent thinker. But on the bad side, OXY now trades with a Buffett premium embedded as you can see from the following chart. OXY’s total return has been almost 100% in the past 1 year and more than 100% YTD, in contrast to only about 10% for EPD. I am sure there are other factors behind such a sharp rally, but Buffett’s action has certainly played a larger role here.
Seeking Alpha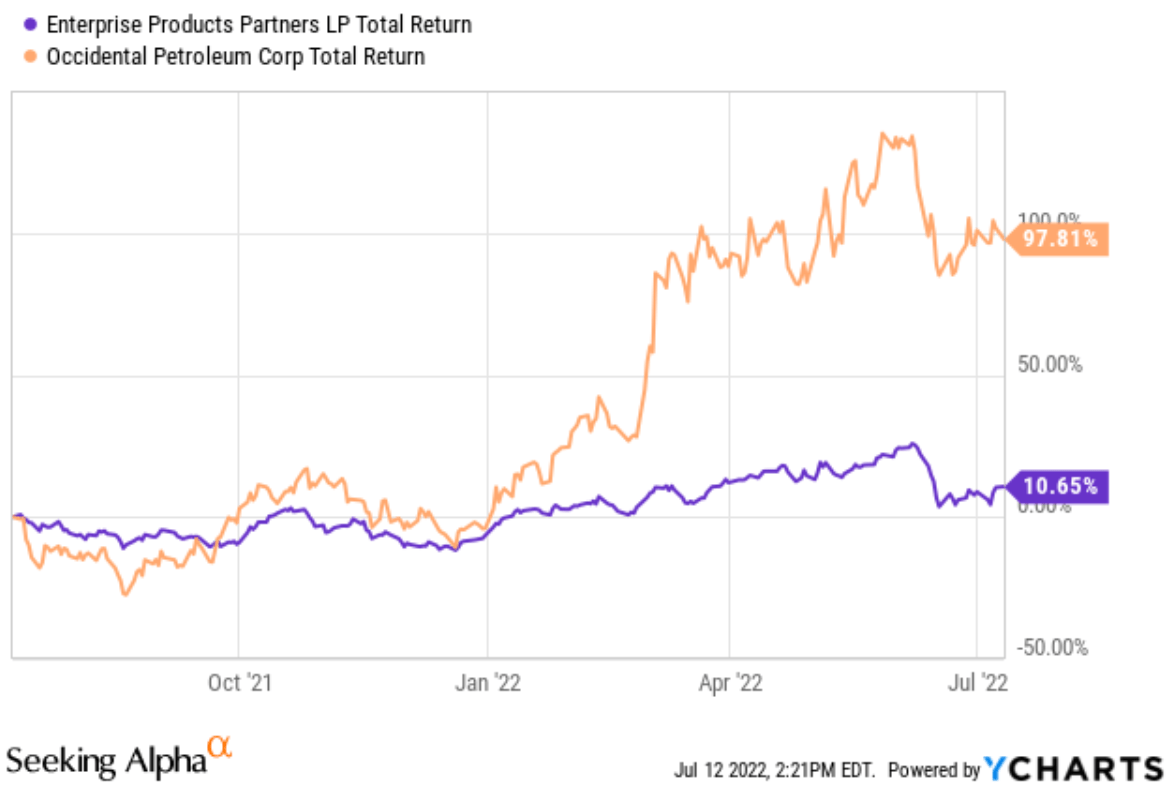
Be the first to comment