

New Zealand Dollar Talking Points
NZD/USD attempts to retrace the decline from the previous week following the limited reaction to the 701K contraction in US Non-Farm Payrolls (NFP), but the exchange rate may continue to give back the rebound from the yearly low (0.5469) as a bear flag formation unfolds.
NZD/USD Rate Outlook Mired by Dovish RBNZ Forward Guidance
NZD/USD trades on a firmer footing as the Reserve Bank of New Zealand (RBNZ) tames speculation for a negative interest rate policy (NIRP), with Chief Economist Yuong Ha arguing that the central bank would need to “assess the effectiveness, efficiency and an impact on financial system soundness of doing so.”
However, recent remarks from Governor Adrian Orr suggest the RBNZ stands ready to deploy more unconventional tools to support the economy as the central bank head pledges to “keep monetary support going for as long as necessary through QE and other tools.”
It seems as though the RBNZ will rely on its non-standard measures to combat the weakening outlook for growth as the central bank remains reluctant to push the official cash rate (OCR) into negative territory. As a result, Governor Orr and Co. may stick to its Large Scale Asset Programme (LSAP) in 2020 as the “Committee agreed unanimously to keep the OCR at this level for at least 12 months.”
Source: RBNZ
With that said, the RBNZ may attempt to buy time at its next meeting on May 13, but it remains to be seen if the central bank will continue to push monetary policy into uncharted territory as officials warn that the effective lower bound (ELB) for the benchmark interest rate “may be below zero.”
In turn, the RBNZ’s dovish forward guidance may continue to drag on the New Zealand Dollar, and NZD/USD may continue to give back the rebound from the yearly low (0.5469) as a bear flag formation unfolds.

Recommended by David Song
Forex for Beginners
Sign up and join DailyFX Currency Strategist David Song LIVE for an opportunity to discuss potential trade setups.
NZD/USD Rate Daily Chart
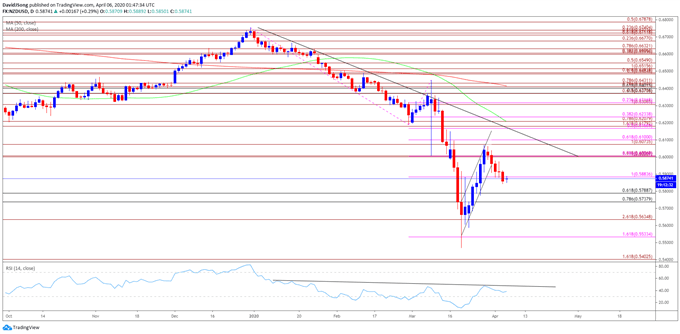
Source: Trading View
- Keep in mind, NZD/USD has failed to retain the range from the second half of 2019 as the decline from earlier this year produced a break of the October low (0.6204), with a ‘death cross’ taking shape in March as the 50-Day SMA (0.6207) crosses below the 200-Day SMA (0.6415).
- The rebound from the yearly low (0.5469) unravels following the failed attempt to push above the Fibonacci overlap around 0.6070 (100% expansion) to 0.6100 (61.8% expansion), with the break of channel support along with the move below the 0.6000 (100% expansion) to 0.6010 (161.8% expansion) region bringing the downside targets on the radar as a bear flag formation unfolds.
- The break/close below 0.5880 (100% expansion) opens up the Fibonacci overlap around 0.5740 (78.6% retracement) to 0.5790 (61.8% retracement), with the next area of interest coming in around 0.5640 (261.8% expansion) followed by the 0.5530 (161.8% expansion) region.

Recommended by David Song
Traits of Successful Traders
— Written by David Song, Currency Strategist
Follow me on Twitter at @DavidJSong
Be the first to comment