

Darren415
This article was first released to Systematic Income subscribers and free trials on Nov. 7.
In this article, we catch up on Q3 results from the business development company (“BDC”) Fidus Investment (NASDAQ:FDUS). FDUS is currently trading at a valuation of 107%. Its dividend yield is tricky to pin down given its unusual dividend policy, which we discuss below. Its base dividend of $0.39 for 2023 results in a base dividend yield of 7.54% as of this writing (i.e., based on a price of $20.69). However, this dividend will very likely continue to be topped up with a supplemental and a special dividend, which should push its total dividend yield into double-digits over the coming quarters.
The stock remains one of our largest BDC holdings in the High Income Portfolio. Since we topped up the holding in October of last year, the stock has handily outperformed the rest of the space, as the following chart shows.
Systematic Income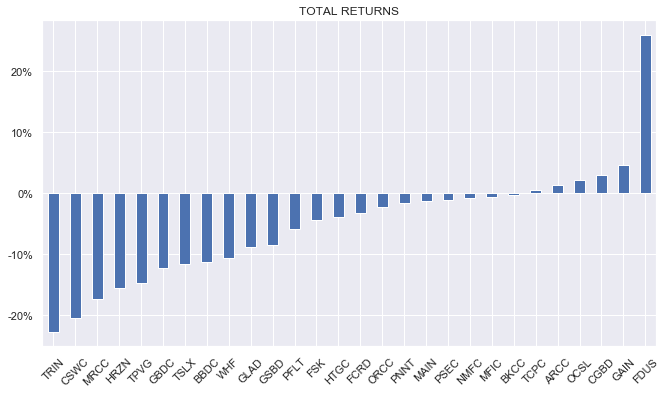
In our last update, we highlighted that, given its large income tailwinds and a huge spillover, the company was very likely to deliver dividend hikes across any of its base, supplemental and special dividends. This is indeed what happened – in fact, there was an increase across all three dividend components.
For Q4, the company kept its regular dividend the same at $0.36 but increased the supplemental from $0.07 to $0.15 while declaring a new special of $0.10. In total, the Q4 dividend equates to $0.61 versus $0.43 for Q3. Because of its massive $2.86/share of spillover (up from $2.37 in Q2), the company will be making a deemed dividend in 2023 as a way to retain a big chunk of it, in order to allow for additional investment opportunities. More information will be forthcoming in January.
For 2023, the company has increased its base dividend to $0.39 and kept the $0.10 special. The supplemental dividend is equal to the gap between the adjusted net income and the prior quarter’s base dividend. For example, the $0.15 supplemental in Q4 is just the difference between the $0.51 adjusted net income and the $0.36 base dividend.
The breakdown of the dividend into three different components is arguably unnecessarily complicated, however, each has a role to play. The base dividend targets the floor the company expects to generate in net income. The supplemental covers the gap between net income and the base dividend. The special dividend is there to gradually push the spillover lower, so it is closer to its target of 3 quarters of the base dividend. As a side note, that equates to roughly a couple of additional quarters of the $0.10 special dividend if the deemed dividend comes in at the guided $1.5 level.
Quarter Update
Total investment income jumped over Q3, supported by both interest income as well as a rise in fee income from relatively depressed levels.
Systematic Income BDC Tool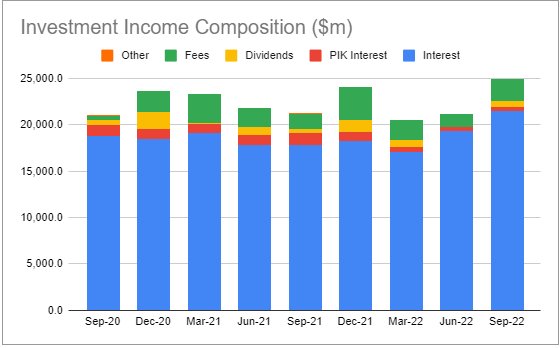
Both GAAP and adjusted net income (adjusted net income excludes capital gains incentive fees) rose over the quarter and stand at the highest levels over the last few years.
Systematic Income BDC Tool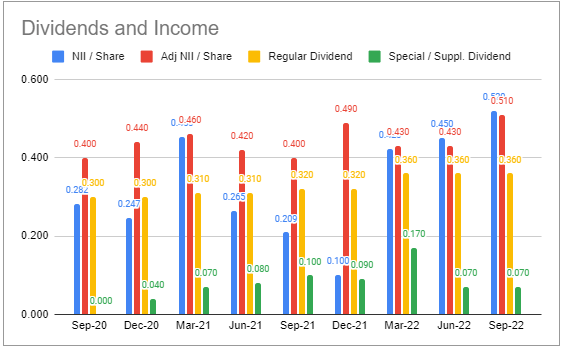
Total dividend coverage rose to 119% in Q3, which explains the bumps in Q4 dividends.
Systematic Income BDC Tool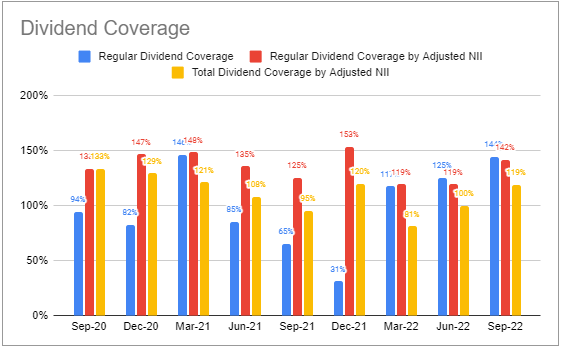
Q4 income will have an excise tax drag of around $0.06-0.07 due to the spillover retention. There will also likely be additional incentive fees payable on recent equity monetization. This suggests that the total Q1 dividend is likely to be lower than its Q4 level.
FDUS NAV fell around 2% versus the median of around a 0.5% drop. The NAV was skewed lower due to an August declaration of the Q4 base and supplemental dividends totaling $0.43. In other words, the NAV bore the brunt of 2 quarters of dividends. This early declaration of a Q4 dividend was intended to satisfy the distribution requirement of 2021 income. Taking this into account, the NAV actually increased over the quarter, once again outperforming the broader sector on an apples-to-apples basis.
Systematic Income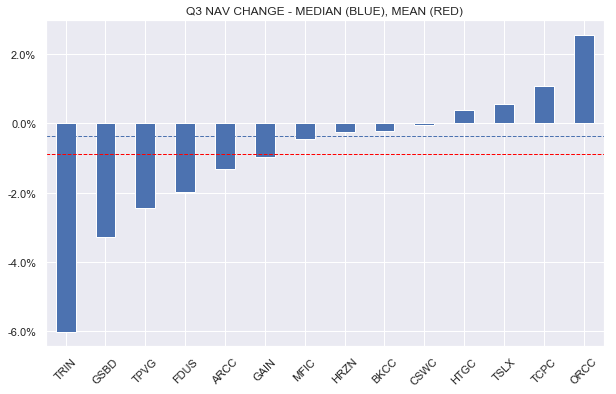
The company has historically seen its NAV appreciate over time, making a full reversal after previous falls, and we expect this pattern to continue.
Systematic Income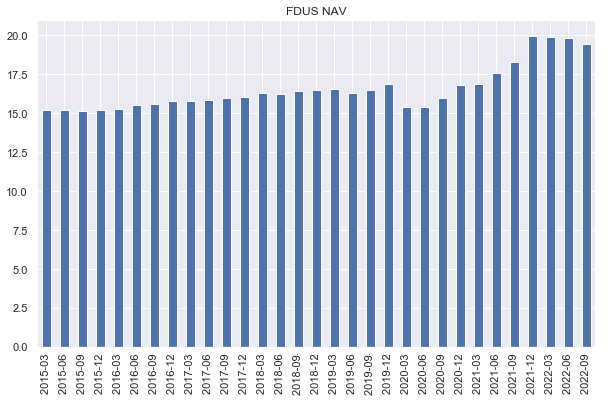
Income Dynamics
The company continues to rotate its equity securities into secured loan/income-producing assets. The portfolio allocation chart below shows that the proportion of secured loans has been growing at the expense of equity. During the quarter, the company monetized $40m of its equity portfolio as part of its broader strategy to cap its equity allocation at 10%. This rotation away from lower-yielding equity positions will increase the fund’s overall investment income, all else equal. Since the end of the year, the debt portfolio has increased by $197m or 35%. In terms of the NAV, it was a 42% increase. This will have a sizable impact on the company’s ability to generate a significantly higher level of income relative to its historic level.
Systematic Income BDC Tool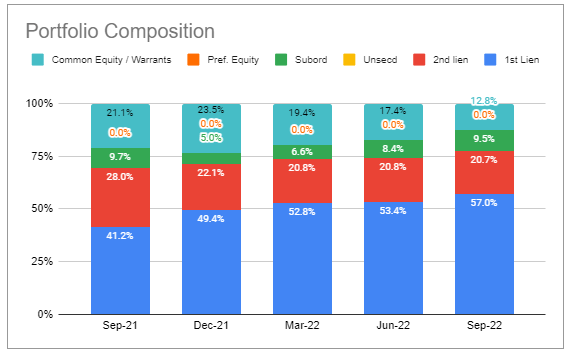
Q3 was big for realized gains, with a net of $40m monetized from its equity portfolio. The company has been very successful on its equity holdings, generating a cumulative $242m of realized gains in the context of a current $857m portfolio.
Systematic Income BDC Tool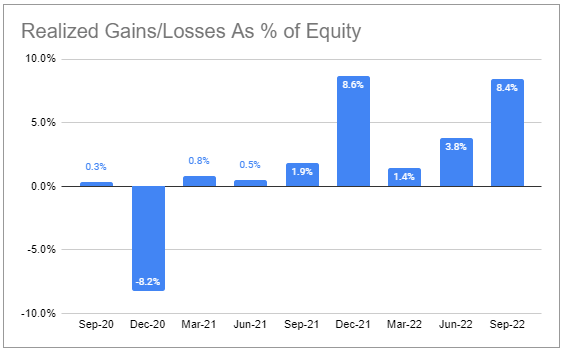
New originations outpaced repayments, resulting in net new investments, creating a further income tailwind going forward.
Systematic Income BDC Tool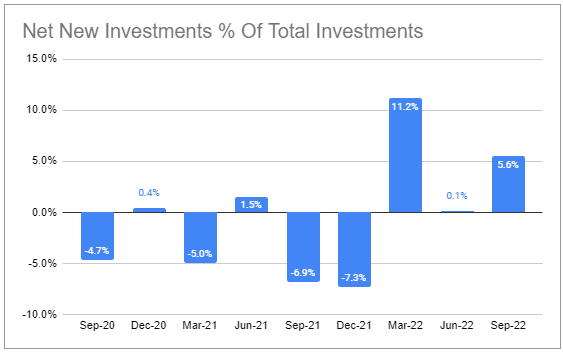
Net income will continue to benefit from rising short-term rates as the following chart shows. The beta to higher rates is slightly below the sector average due to the company’s low level of leverage and a below-average amount of floating-rate assets. As the company right-sizes its equity allocation, we expect its leverage to increase and its net income beta to short-term rates to increase as well.
Systematic Income BDC Tool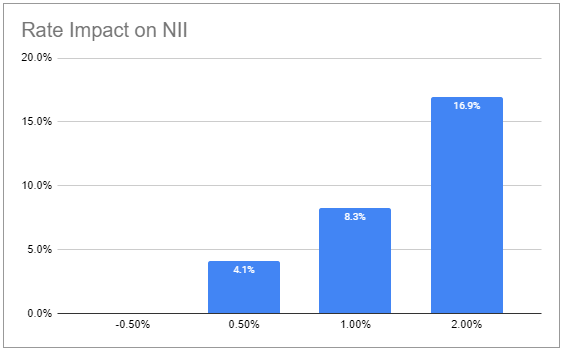
An important feature of the company’s balance sheet is the absence of any floating-rate liabilities. This has been the case since Q1 of this year and is extremely unusual in the sector, with only one other BDC in our coverage having no floating-rate debt. This has allowed the company’s interest expense to flat-line as opposed to increase this year. The slight bump to 3.8% from Q2 is likely due to a reshuffling in SBIC debentures.
Yield on debt investments also jumped sharply by a full percentage point to 12.9%.
Systematic Income BDC Tool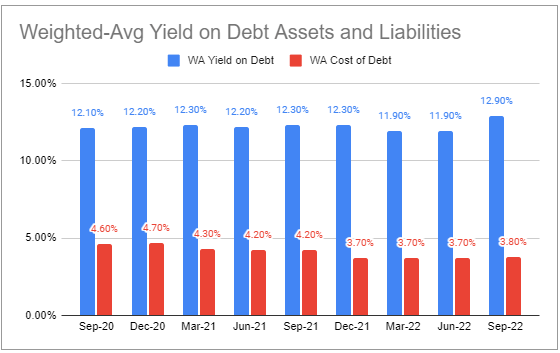
The company’s current weighted-average interest expense of 3.8% is below the sector average despite a lack of an investment-grade rating which many other BDCs have. The debt maturity profile is fantastic, with no real maturities coming until 2026, giving it a significant advantage, all else equal.
Fidus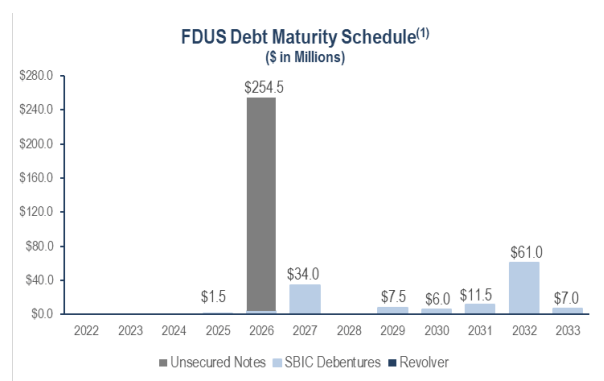
FDUS continues to have one of the lowest levels of leverage in the sector. It has been funding its secured loan investments by monetizing equity positions.
Systematic Income BDC Tool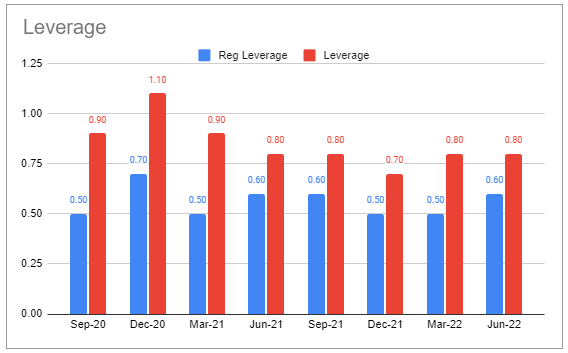
Portfolio Quality
There were no new non-accruals during the quarter. The company’s non-accrual on fair value is about half the average and below the median sector level.
Systematic Income BDC Tool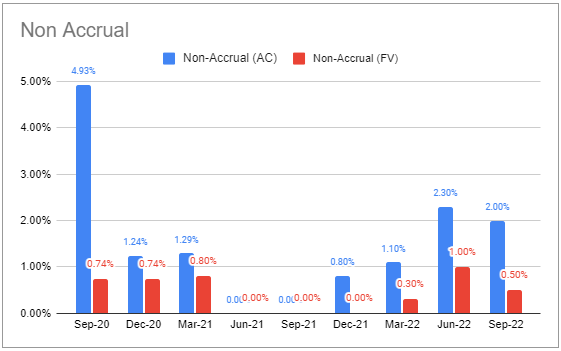
The weighted-average internal portfolio rating worsened for the second straight quarter. This is not out of line with the broader sector and makes sense in the context of slowing economic activity.
Systematic Income BDC Tool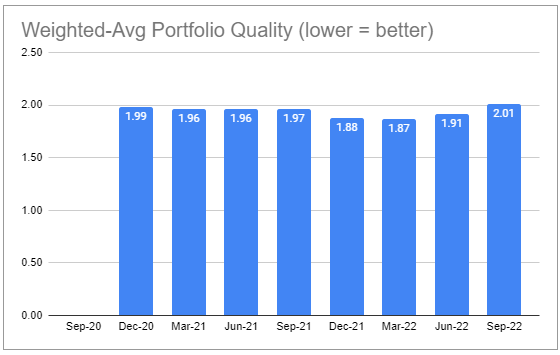
PIK remains well below sector-average levels.
Systematic Income BDC Tool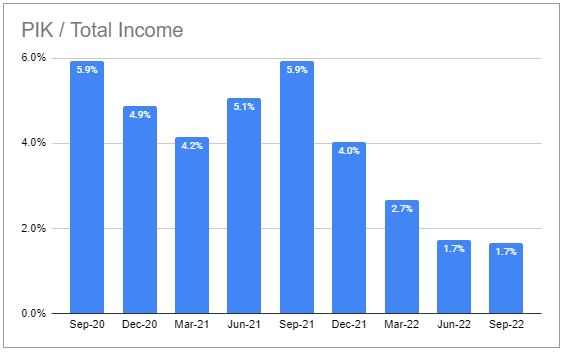
Management has also commented that the interest coverage of their portfolio actually increased from Q2 levels (which were a very respectable 3.4x) due to new investments in lower-leverage companies.
Return And Valuation Profile
The company has one of the best track records in the BDC sector. As highlighted above, the total NAV performance over Q3 was biased lower by around 2%. Adjusted for this, FDUS would have outperformed during the quarter once again, which would have made it an outperformer in 8 of the last 9 quarters.
Systematic Income BDC Tool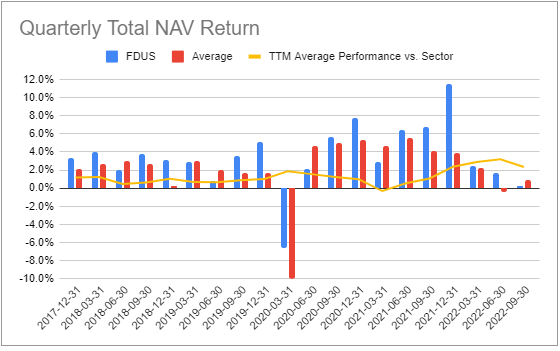
On a 5Y total NAV return basis, FDUS is towards the top end of the sector.
Systematic Income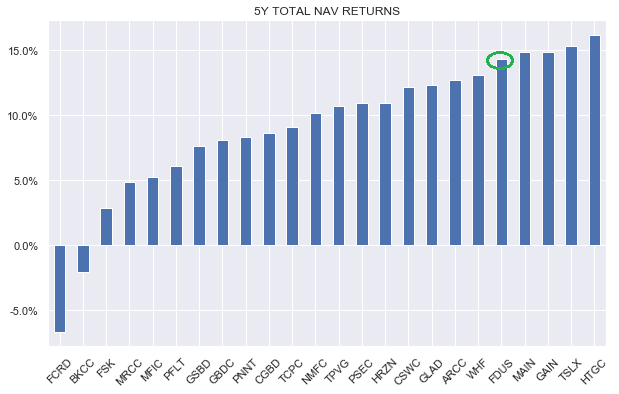
Our previous allocation to FDUS was predicated in part on the combination of strong and consistent historic performance and low valuation relative to its strong performance. The chart below comes from our first article on the company almost exactly a year ago. It shows that among BDCs that have generated a total NAV return of 12-15%, FDUS was trading at the lowest valuation, with the next company with a similar track record, Ares Capital (ARCC), trading at a valuation of around 20% higher.
Systematic Income BDC Tool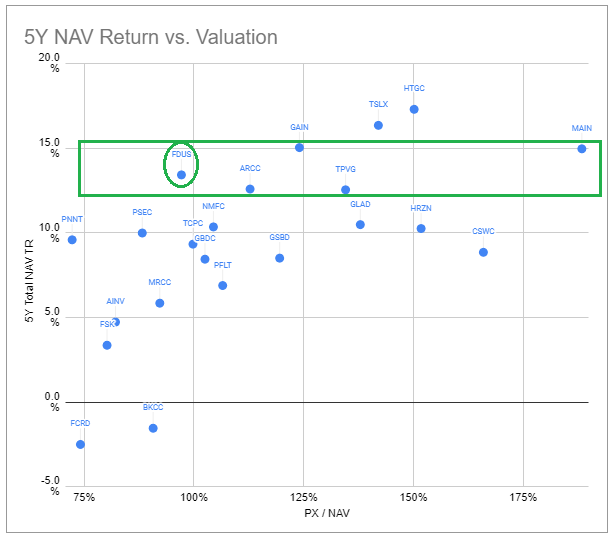
Since then, the valuations of FDUS and ARCC have converged from both ends as FDUS has gained and ARCC has fallen. As of this writing, FDUS is actually trading at a higher valuation than ARCC. This valuation gap will increase further, as ARCC just announced another public offering. Overall, we find FDUS much more fairly valued at the moment than it was at any other time in the previous few years.
Systematic Income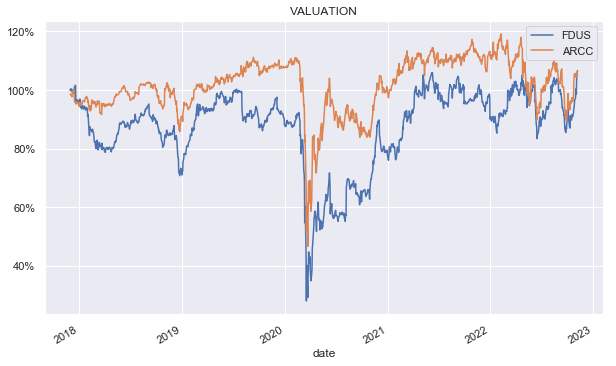
Takeaways
Apart from its strong performance, FDUS is worth a look for diversification purposes for many investors. The company is focused on the lower middle-market segment while also holding an above-average equity portfolio. In this sense, it provides attractive diversification to BDCs focused on the upper middle-market segment such as Oaktree Specialty Lending Corporation (OCSL) and ARCC as well as those primarily focused on secured loans such as Golub Capital BDC (GBDC) and OCSL.
Overall, FDUS is very quickly turning from a higher-risk/higher-beta BDC to a lower-risk/lower-beta BDC. Its equity allocation is falling towards the broader sector average while its leverage remains unusually low in the sector.
This increased focus on secured loans at the expense of equity may mean Fidus Investment’s impressive historic returns may not be repeated. This is certainly possible, however, we remain optimistic. After all, the company’s large equity allocation grew organically through unrealized gains rather than from an initially large allocation. This suggests that further upside for Fidus Investment from equity gains cannot be ruled out.
Be the first to comment