New Zealand Dollar Talking Points
NZD/USD attempts to retrace the decline from last week amid growing bets for a Federal Reserve rate cut, but the exchange rate may continue to exhibit a bearish behavior as the Relative Strength Index (RSI) sits in oversold territory.
NZD/USD Rate Clears 2019 Low as RSI Sits in Oversold Territory
NZD/USD bounces back from the yearly low (0.6191) as the Federal Open Market Committee (FOMC) comes under pressure to insulate the US economy, with President Donald Trump tweeting that “as usual, Jay Powell and the Federal Reserve are slow to act.”
At the same time, Fed Fund futures now reflect a 100% probability for a 50bp rate cut on March 18, and the FOMC may have little choice but to reestablish its rate easing cycle as the coronavirus continues to pose a threat to the global supply chain.
It remains to be seen if the FOMC will respond to the coronavirus and abandon the wait-and-see approach as Fed Vice Chair Richard Clarida insists that “the current stance of monetary policy likely will remain appropriate.” In turn, the Federal Reserve may merely attempt to buy time as “participants concurred that maintaining the current stance of policy would give the Committee time for a fuller assessment of the ongoing effects on economic activity of last year’s shift to a more accommodative policy stance.”
More of the same from the FOMC may spark a bullish reaction in the US Dollar as market participants scale back bets for lower interest rates, but a rate cut paired with a shift in the forward guidance may fuel a larger rebound in NZD/USD as the central bank reestablishes its rate easing cycle.
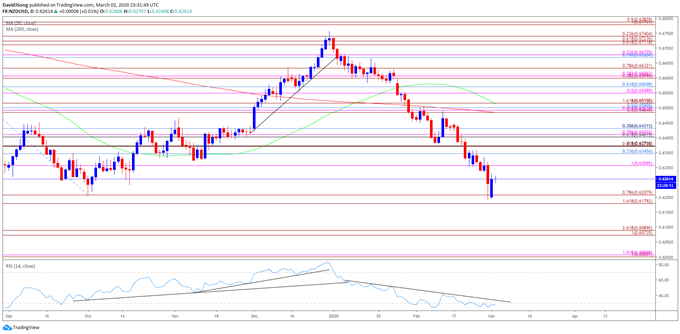
Until then, NZD/USD may continue to exhibit a bearish behavior as the exchange rate snaps the range from the second half of 2019, while the Relative Strength Index (RSI) extends the downward trend from earlier this year and sits in oversold territory.


Recommended by David Song
Forex for Beginners
Sign up and join DailyFX Currency Strategist David Song LIVE for an opportunity to discuss potential trade setups.
NZD/USD Rate Daily Chart
Source: Trading View
- NZD/USD has failed to retain the range from the second half of 2019 as the decline from earlier this year produces a break of the October low (0.6204), and a ‘death cross’ may take shape over the coming days as the 50-Day SMA (0.6514) approaches the 200-Day SMA (0.6485).
- At the same time, the Relative Strength Index (RSI) undermines the recent rebound in NZD/USD as the indicator continues to track the downward trend from earlier this year, and the bearish momentum may resurface as the oscillator sits in oversold territory.
- Need a break/close below the 0.6180 (161.8% expansion) to 0.6210 (78.6% expansion) region to open up the Fibonacci overlap around 0.6070 (100% expansion) to 0.6090 (261.8% expansion), with the next area of interest coming in around 0.6000 (100% expansion) to 0.6010 (161.8% expansion).


Recommended by David Song
Traits of Successful Traders
— Written by David Song, Currency Strategist
Follow me on Twitter at @DavidJSong


Be the first to comment