

serg3d/iStock Editorial via Getty Images
Nvidia’s (NASDAQ:NVDA) stock has fallen sharply in 2022 and appears it may be very close to taking its next major leg lower. The equity has seen its valuation drop materially over the past several weeks, with the current year PE ratio dropping to around 28.4 from a peak of nearly 80 in November 2021. That declining earnings multiple has come due to broader compression that has taken place across the sector and the entire equity market as interest rates have climbed.
The falling PE multiple has significantly impacted the stock over the past few months. Analysts’ earnings estimates for Nvidia have held up reasonably well, with fiscal 2023 estimates dropping to $5.50 from $5.67 at the end of May. Additionally, earnings estimates for 2024 are $6.54 per share, down from $6.79 per share.
The declining PE at this point seems tied heavily to the direction and trends of the broader markets and the sector and may not be due entirely to the underlying fundamentals based on current earnings trends. This would indicate that if interest rates begin to fall, earnings multiples will expand, and Nvidia stock is likely to rise. However, if rates continue to increase and market multiples drop, the earnings multiple would compress, pushing Nvidia shares lower.
Bloomberg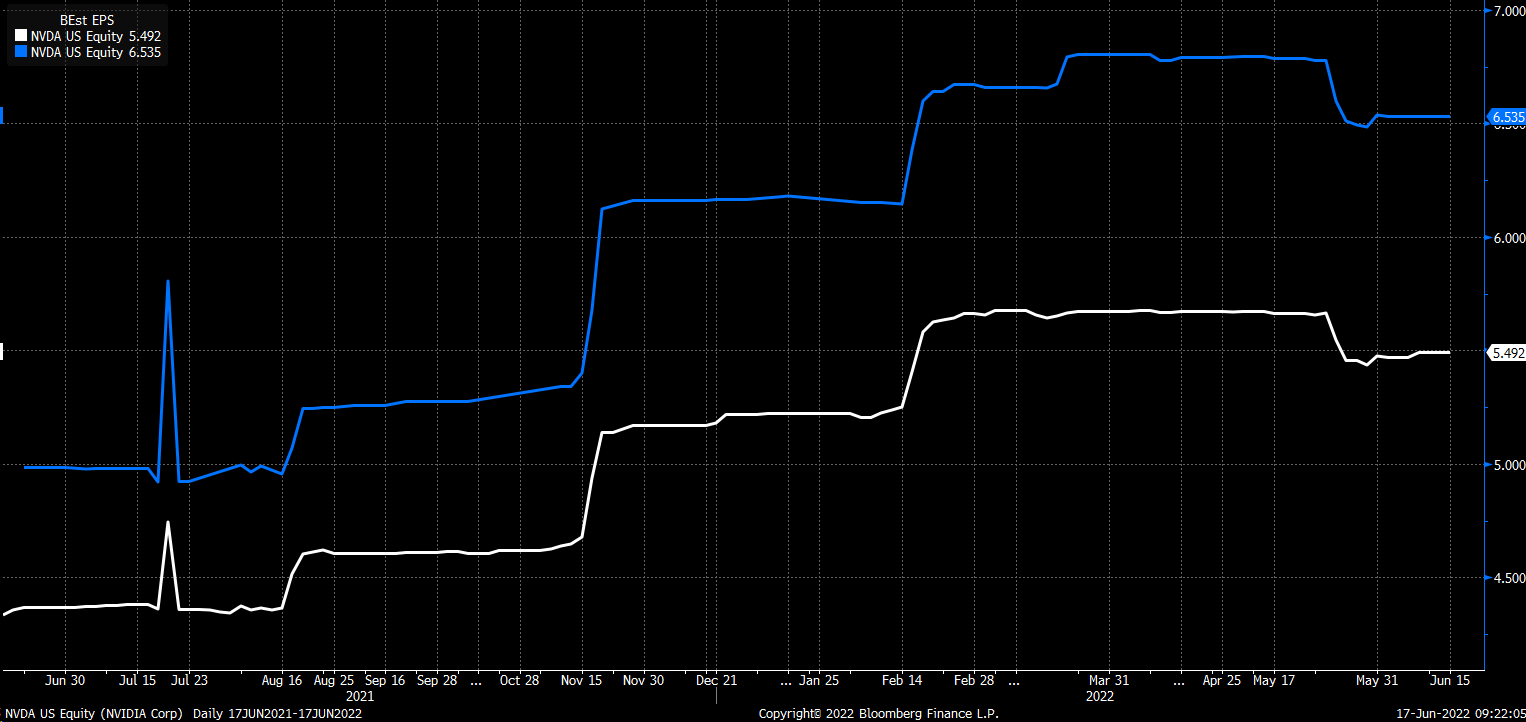
The PE ratio relationship between the stock and the PHLX Semiconductor Index (SOX) shows further evidence of the outside force driving most of the stock’s move. The PE ratio for Nvidia vs. the SOX index has returned to the historical average, with Nvidia trading around two times the PE ratio of that of the index.
Bloomberg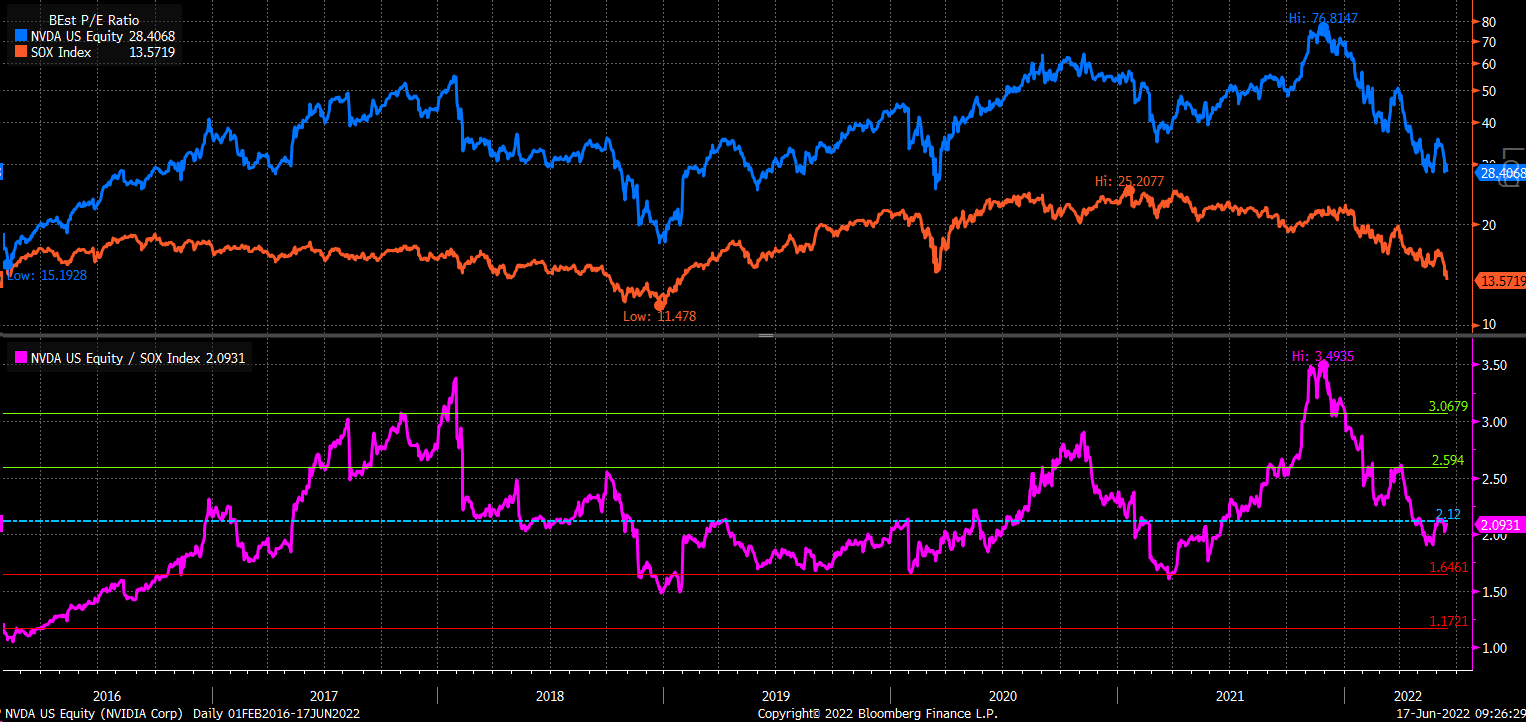
However, this is not to say that Nvidia doesn’t have the potential for fundamental risk because some trends appear to show a slowdown for the business may be rising. The company did provide weaker than expected guidance when it last reported results in May, which prompted analysts to downgrade their earnings estimates, as noted above. Also, based on data from the website CamelCamelCamel, prices for some of Nvidia’s more popular GPUs, such as the GeForce RTX 3080 Ti, have been steadily declining, whether new or used.
CamelCamelCamel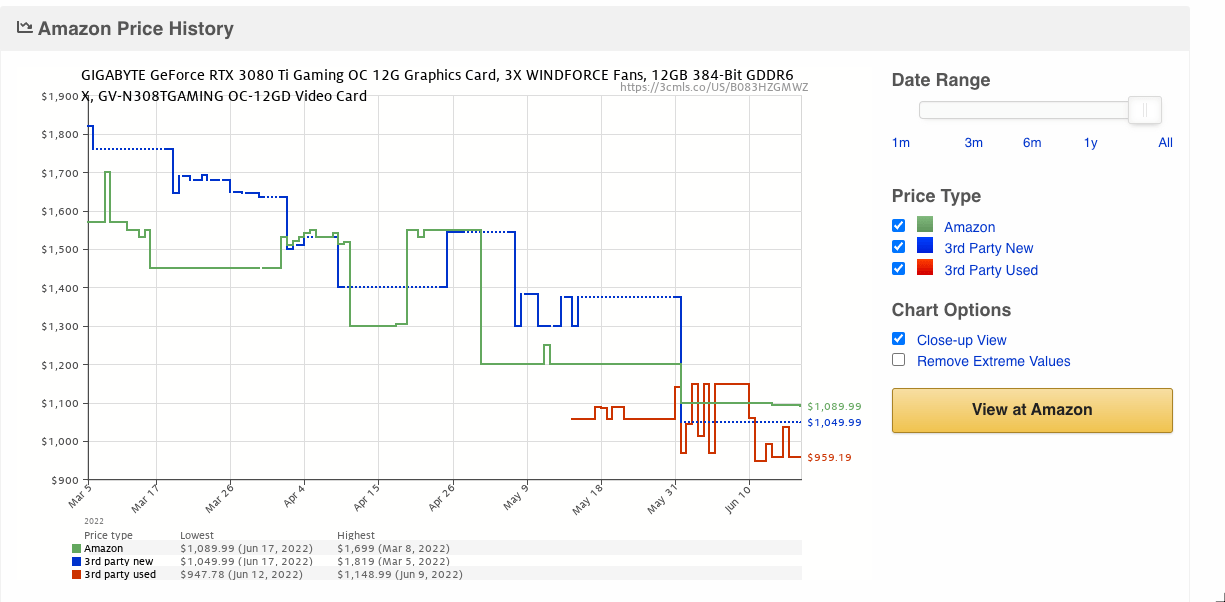
Similar trends can also be seen in the GeForce RTX 3090 Founders Edition.
CamelCamelCamel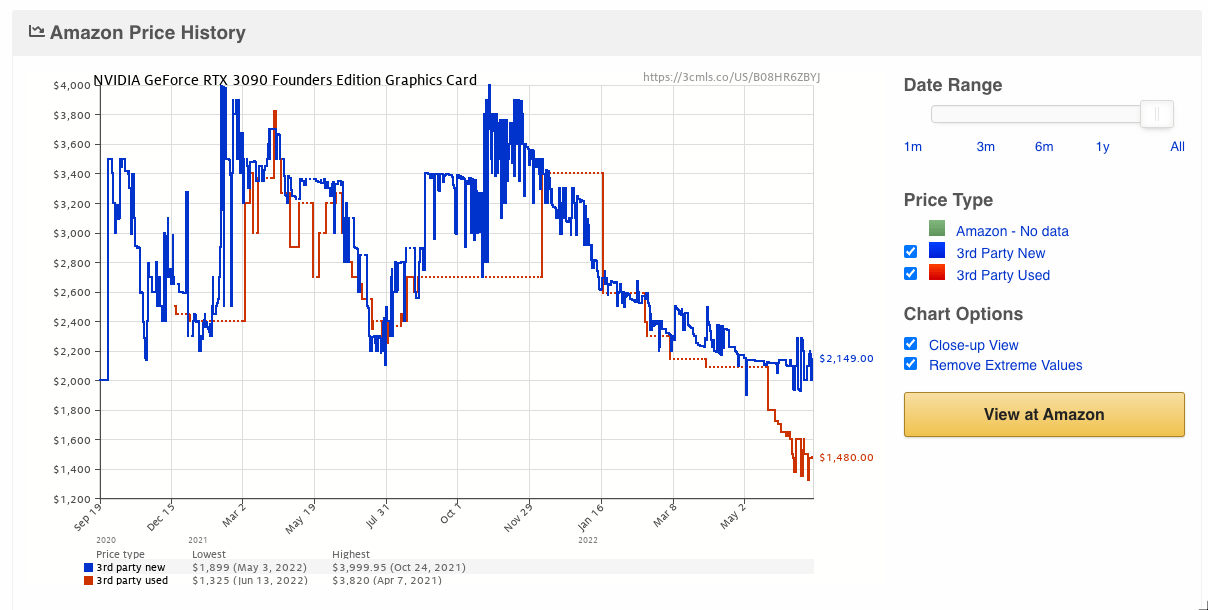
The falling GPU prices could suggest that demand for some of its GPUs has dropped recently. Also, the company noted on the conference call that the inventory channel had normalized and expected second quarter gaming revenue to decline from the first quarter. The first quarter data also showed that the annualized days inventory outstanding increased to 100.74 from 89.6. Meanwhile, the annualized days sales outstanding increased to 59.7 from 55.3. Both of these metrics reached their highest points in July 2019.
The last time Nvidia saw both its inventory and days sales outstanding rise came in the spring of 2018 when the company saw revenue plateau and fall through the winter of 2019. Current sales estimates show that revenue for the company at this point is expected to fall for the next quarter; whether this is the start of a long-term trend is yet to be seen.
Bloomberg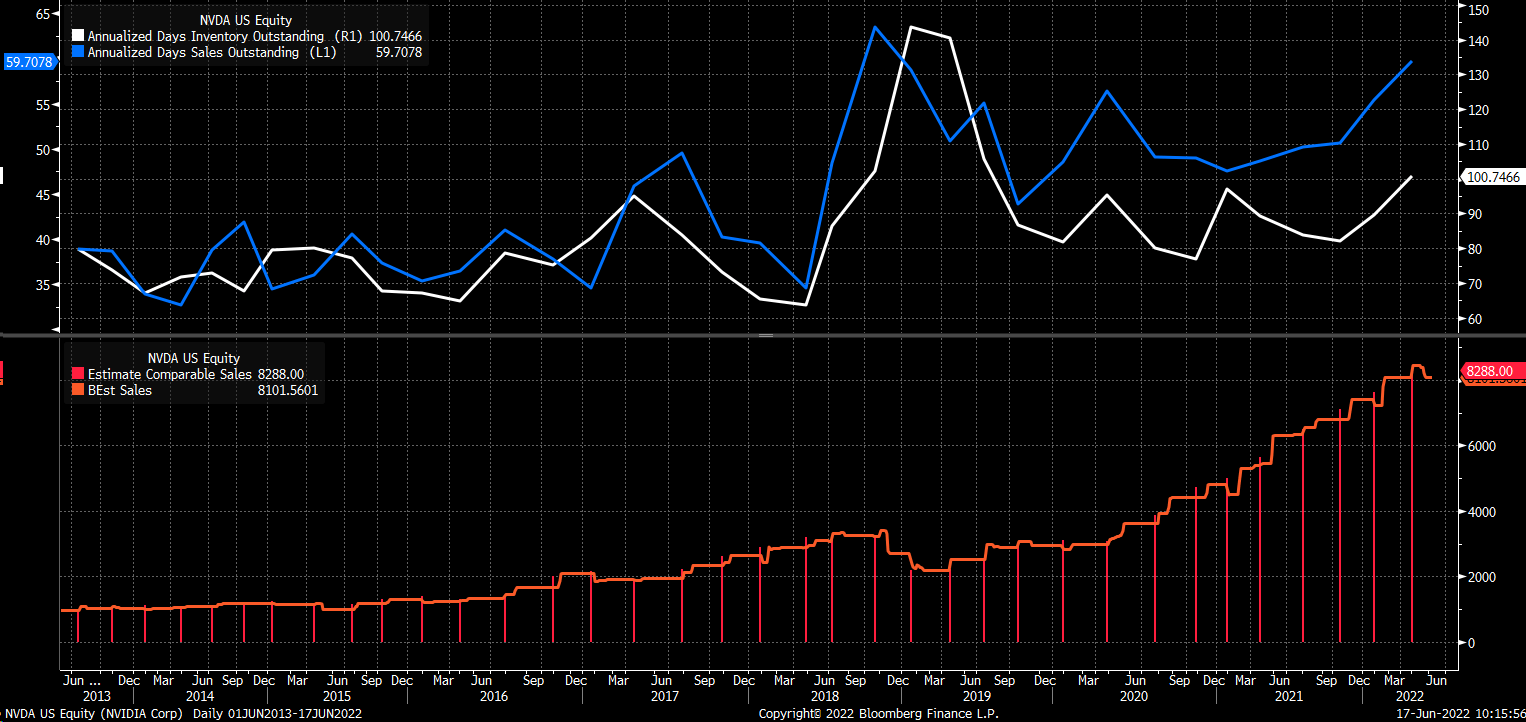
A Bet The Shares Drop Below $155
The uncertain outlook and broader market risks could be prompting a trader to bet that Nvidia shares will fall further. On July 22, the open interest for the $155 calls and puts both rose by around 16,100 contracts. The data shows that the calls traded on the bid and sold for $12.20 per contract. Meanwhile, the put contracts were traded on the ASK and bought for $12.20 per contract. This bearish bet would suggest that the stock is trading below $155 by the middle of July.
The option trade could be a hedge for an institution that owns shares of Nvidia and is looking to protect itself from further declines in the stock. However, the intention of the bet is essential: The fear that Nvidia has additional downside risk from its current price.
Technical Trends Are Bearish
The technical chart also suggests that the next leg lower in Nvidia may be coming. The stock is trading just above a support region between $150 to $155, a critical level for the stock over the past several weeks. That region is now being tested again. If this region of support between $150 to $155 breaks, it may lead to a significant drop in the stock to around $135.
The relative strength index is also trending sharply lower and has yet to hit oversold levels, which would suggest that the stock has further downside risk.
TradingView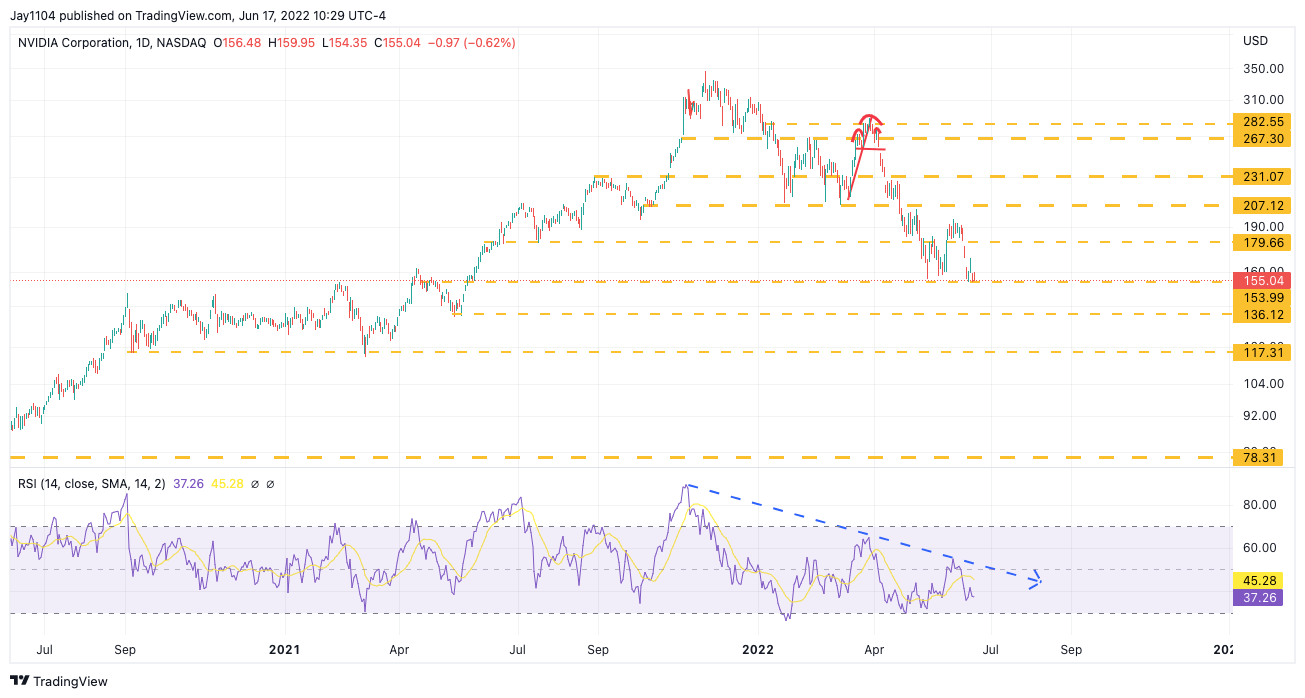
If the stock should hold on to support the region around the $150 to $155 area, it could move higher back towards $180. This could be due to broader market trends shifting or if analysts begin to raise their sales and earnings estimates.
But at this point, Nvidia is falling victim primarily to broader market forces and finds itself in a precarious position based on its technical charts. This could be due to the company’s potential risks to its fundamental outlook, which may be the next shoe to drop for the shares.
Be the first to comment